Abstract
The aim of this research is theoretical investigation of dynamics of the horn type waveguides with impact excitation. For this purpose, a scheme of system with piezoelectric transducer for burst-type electrical signal generation is presented. Such a system could be used in generation of burst-type electric signals or direct control for some kind of stepper motors, e.g. piezo motors. In this paper horn (waveguide), which could be used in a system, for burst type electrical signal generation, is theoretically investigated in different way – end of the horn with smaller cross sectional area is excited with the impulse excitation and displacement is obtained at the end with greater cross sectional area.
1. Introduction
Nowadays usage of various piezoelectric ultrasonic transducer is increasing. The main principle of the ultrasonic piezoelectric transducer is converting high frequency electric power to mechanical vibration power by the vibrator, and then steady amplitude of mechanical vibration is reached thereof. Since the output amplitude of piezoelectric transducer is very small, the ultrasonic horn is usually designed and operated in harmonization to amplify the output amplitude [1]. Ultrasonic horn could be used for various applications of atomizers [2], welding devices [3], surgery [4], etc. Different shapes of ultrasonic horns, such as Gaussian, exponential, sinusoidal, conical, stepped, catenoidal [5], etc. have been proposed and investigated by many researchers. Most of investigations were carried out when horn was excited with harmonic excitation on surface with greater cross sectional area and output displacement is obtained on smaller cross sectional area [6-8].
In this paper horn (waveguide), which could be used in a system, for burst type electrical signal generation, is investigated in different way – horn is excited with impulse excitation on surface with smaller cross sectional area. In this way energy from mechanical impact is transmitted to surface with greater cross sectional area, thus energy from excitation impact is dispersed and displacement of surface is obtained. This surface transmits displacement and energy with entire surface area to piezoelectric transducers. Surface area corresponds piezoelectric transducers dimensions so due to this fact the piezo electric transducers can generate electric signal for stepper drive control with the highest amplitude and impulse duration.
2. System for burst-type electrical signal generation
A scheme of system for burst-type electrical signal generation, which could be used in impact energy harvesting areas, is presented in Fig. 1. Such a system has energy supply 1, e.g. impact energy controller, etc., shock generator 2, e.g. hummer-type impactor, piezoelectric shock generator, etc. certain type of waveguide 3, piezoelectric transducer 4, backing 5 and drive 6, which should be controlled.
Presented system for burst-type electrical signal generation creates ability to transfer generated energy from impact directly to the controlled drive, thus additional energy capacity such a batteries, are unnecessary.
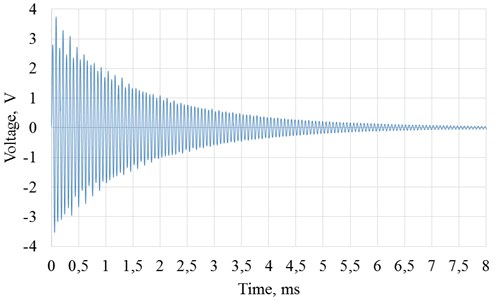
Electrical signal, generated during experimental investigation, by system with piezoelectric transducer for burst-type electrical signal generation, is presented in Fig. 2.
The most important parameters for burst type electrical signal generation is impact amplitude and duration [9]. By controlling shock parameters and waveguide types it is possible to obtain such signal (with required amplitude and duration), which could directly control stepper drive.
Fig. 1Scheme of system for burst-type electrical signal generation: 1 – impact energy controller, 2 – shock generator, 3 – waveguide, 4 – piezoelectric transducer, 5 – backing, 6 – stepper drive
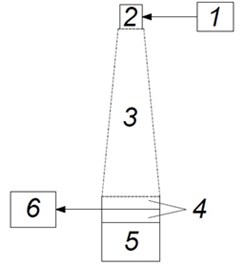
Fig. 2Signal, which is generated by system for burst-type electrical signal generation
3. Modelling of waveguides
To investigate mechanical impact parameters dependency from different waveguide types a computational model, presented in Fig. 3, was created using ANSYS Explicit dynamics software. Due to symmetry a quarter of the waveguide was modeled. During all modelling waveguides were made from Steel 1006, excitation was by 1 N force, added for certain time on surface B (20 mm diameter circle). Table 1 shows material properties, used in all modelling.
During all modelling boundary conditions were the same: waveguides was fixed on edge A (certain distance from surface C) with 0 mm/s velocity of direction and 2 section planes – with velocity 0 mm/s of accordingly and directions (see Fig. 3).
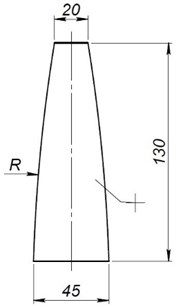
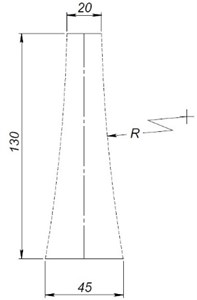
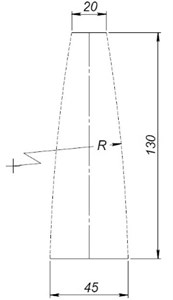
During theoretical research 5 types of waveguides were modelled. Modelled waveguides shapes and geometric dimensions are presented in Fig. 4.
Table 1Material (Steel 1006) properties, used in modelling
Parameter | Measurement unit | Value |
Density | kg/m3 | 7896 |
Gruneisen coefficient | – | 2.17 |
Shear modulus | GPa | 81.8 |
Yield stress | MPa | 350 |
Fig. 3Computational model
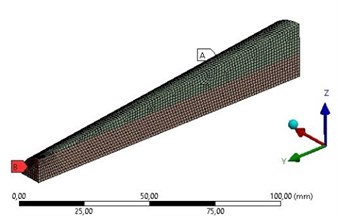
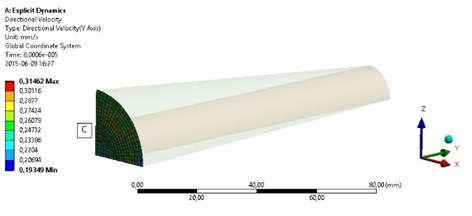
Fig. 4Modelled waveguide shapes and dimensions: a) cylindrical shape, b) conical shape, c) stepped shape, d) close exponential shape, e) reverse close exponential shape
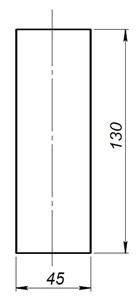
a)
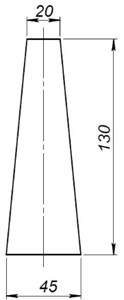
b)
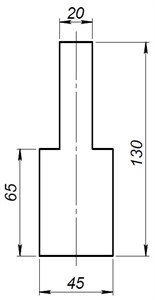
c)
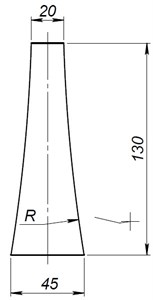
d)
e)
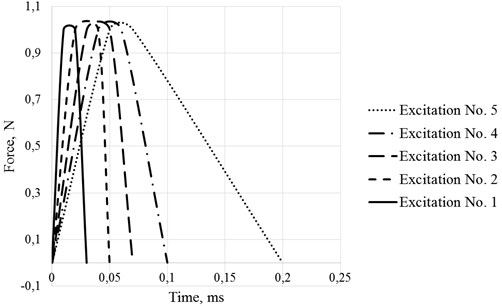
The first modelling was carried out on the conical shape waveguide to investigate surface velocity amplitude’s dependency from excitation impulse shape. During all modelling waveguide excitation impulse had the same force amplitude of 1 N, differed only duration. These impulse shapes was selected in order to determine resonant oscillations of the waveguide dependency from impulse duration. Modelled excitation impulse shapes are presented in Fig. 5.
Fig. 5Excitation impulse shapes, used in modelling for conical waveguide
During modelling maximum and minimum velocities in direction of all surface C points were determined. Due to discrepancy between maximum and minimum velocities of the surface C points in all modelling results (Fig. 6, Fig. 8, Fig. 10) are presented average velocity amplitude.
Modelling results – average velocity of surface C in direction amplitude’s dependency from excitation impulse duration are presented in Fig. 6.
Fig. 6Average velocity of surface C in y direction amplitude’s dependency from excitation impulse duration
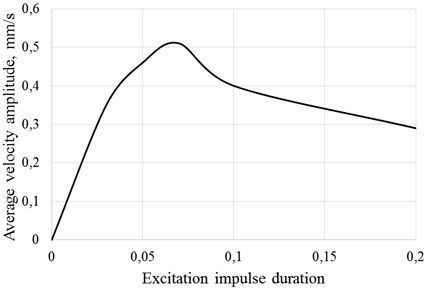
Obtained results showed that the highest amplitude of velocity (0.51 mm/s) generates excitation shape No. 3, which corresponds 0.07 s excitation impulse duration and the lowest amplitude of velocity (0.29 mm/s) generates excitation shape No. 5 (0.2 s excitation impulse duration). These results showed, that velocity is the highest when excitation frequency (impulse duration) is close to resonant frequency period of the waveguide.
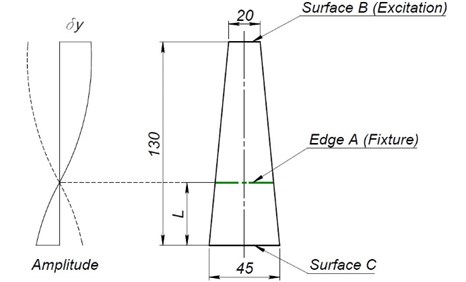
The second modelling was carried out to investigate velocity amplitude’s dependency from fixture’s place of the conical shape waveguide. During all modelling excitation shape was No. 3 (see Fig. 5), differed fixture’s place (fixtured edge distance , mm from surface C). Modelling scheme are presented in Fig. 7.
Fig. 7Scheme of the second modelling
Modelling results – average velocity of surface C in direction amplitude’s dependency from fixture’s place are presented in Fig. 8.
Obtained results showed, that velocity of direction had the highest amplitude (0.51 mm/s) when fixture was 49.12 mm from surface C. This distance conforms conical shape waveguide’s center of gravity.
The third modelling was carried out to investigate velocity amplitude’s dependency from waveguide shape. During this modelling waveguides with all geometrical shape (see Fig. 4) were fixture at the center of their gravity. Close exponential and reverse close exponential shape waveguide’s schemes are presented in Fig. 9.
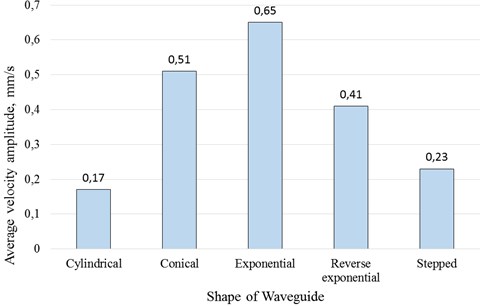
Modelling results – average velocity of surface C in direction amplitude’s dependency from waveguide shape are presented in Fig. 10.
Obtained results showed, that directional velocity had the highest amplitude (0.65 mm/s) when waveguide had close exponential shape, and the lowest (0.17 mm/s) when waveguide had cylindrical shape.
Fig. 8Modelling results: average velocity (y direction) amplitude, mm/s, of surface C. Conical shape waveguide, excitation shape No. 3
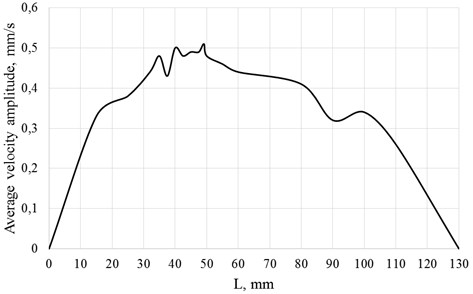
Fig. 9Forming waveguides – between two parallel lines arc of variable center arc is drawn: a) close exponential shape, b) reverse close exponential shape
a)
b)
Fig. 10Modelling results: average velocity (y direction) amplitude, mm/s, of surface C
4. Conclusions
In this research horn-type waveguide is used in a piezoelectric transducer system for burst type electrical signal generation. In this investigation a horn is excited in different way, i.e. with excitation impulse on surface with smaller cross sectional area.
Theoretical research results showed that the highest velocity amplitude of waveguide section with greater cross sectional area when excitation is generated by impulse, generates horn, which is excited with 0.07 s impulse duration. This impulse duration should be close to or correspond resonant frequency of the waveguide in order to obtain the highest velocity amplitude. When impulse duration is increasing the velocity amplitude of surface with greater cross sectional is decreasing. Modelling of waveguides showed that velocity amplitude significantly depends on horn fixture place (distance from horn edge) and is the highest when horn is fixtured at the center of gravity. This investigation showed that the velocity amplitude, when boundary conditions are the same, of horn which has close exponential shape is 3.8 higher than horn which has cylindrical shape.
References
-
Yi-Cheng H., Guan-Zhang D., Bo-Hsuan C., Yu-Jui H. Simulation and experiment of Langevin-type piezoelectric ultrasonic horn for micro tool motion. Intelligent Technologies and Engineering Systems, Vol. 234, 2013, p. 967-974.
-
Cheng C. H., Wang N., Song Y. L., Tsai S. C., Chou Y. F., Lee C. T., Tsai C. S. Design and simulation of silicon-based ultrasonic nozzles for production of monodispersed droplets. Proceedings of the 2nd Frontiers in Biomedical Devices Conference, USA, 2007, p. 11-12.
-
Al-Sarraf Z., Lucas M., Harkness P. A numerical and experimental study of ultrasonic metal welding. Materials Science and Engineering, Vol. 42, Issue 1, 2012, p. 012015.
-
Sadiq M., Yang K., Cochran S., Zhihong H. High-performance planar ultrasonic tool based on d31-mode piezocrystal. Ultrasonics, Ferroelectrics, and Frequency Control, Vol. 62, Issue 3, 2015, p. 428-438.
-
Dung-An W., Hai-Dang N. A planar Bézier profiled horn for reducing penetration force in ultrasonic cutting. Ultrasonics, Vol. 54, 2014, p. 375-384.
-
Taijiang P., Xiaoyu W., Xiong L., Hongyan S., Feng L. Investigation of a rotary ultrasonic motor using a longitudinal vibrator and spiral fin rotor. Ultrasonics, Vol. 61, 2015, p. 157-161.
-
Rosca I. C., Pop M. I., Cretu N. Experimental and numerical study on an ultrasonic horn with shape designed with an optimization algorithm. Applied Acoustics, Vol. 95, 2015, p. 60-69.
-
Qiang Z., Shengjun S., Weishan C. An electromechanical coupling model of a longitudinal vibration type piezoelectric ultrasonic transducer. Ceramics International, Vol. 41, 2015, p. 638-644.
-
Cyril H. Shock and Vibration Handbook. Fourth Edition, McGraw-Hill, New York, 1996.
-
Soedel W. Vibrations of Shells and Plates. Second Edition, Marcel Dekker Inc., New York, 1993.
About this article

