Abstract
With the increasing popularity of wearable devices, typically employed in fitness and health monitoring, there is an evident need to extend their autonomy and replace the conventional power sources with environmentally friendly alternatives. Piezoelectric energy harvesting systems, optimized for collecting kinetic energy from random human motion and transduce it into electrical energy, represent a viable option for powering autonomous wearables. Since established analytical methods are unable to model the behaviour of piezoelectric harvesters with complex optimized geometries, suitable numerical models need to be employed for their design. This implies the need of a thorough study focused on the mechanical engineering design optimization purposes of how the finite element type and mesh density affect the uncoupled modal and coupled transient responses of a new class of optimised design configurations of the studied devices.
Highlights
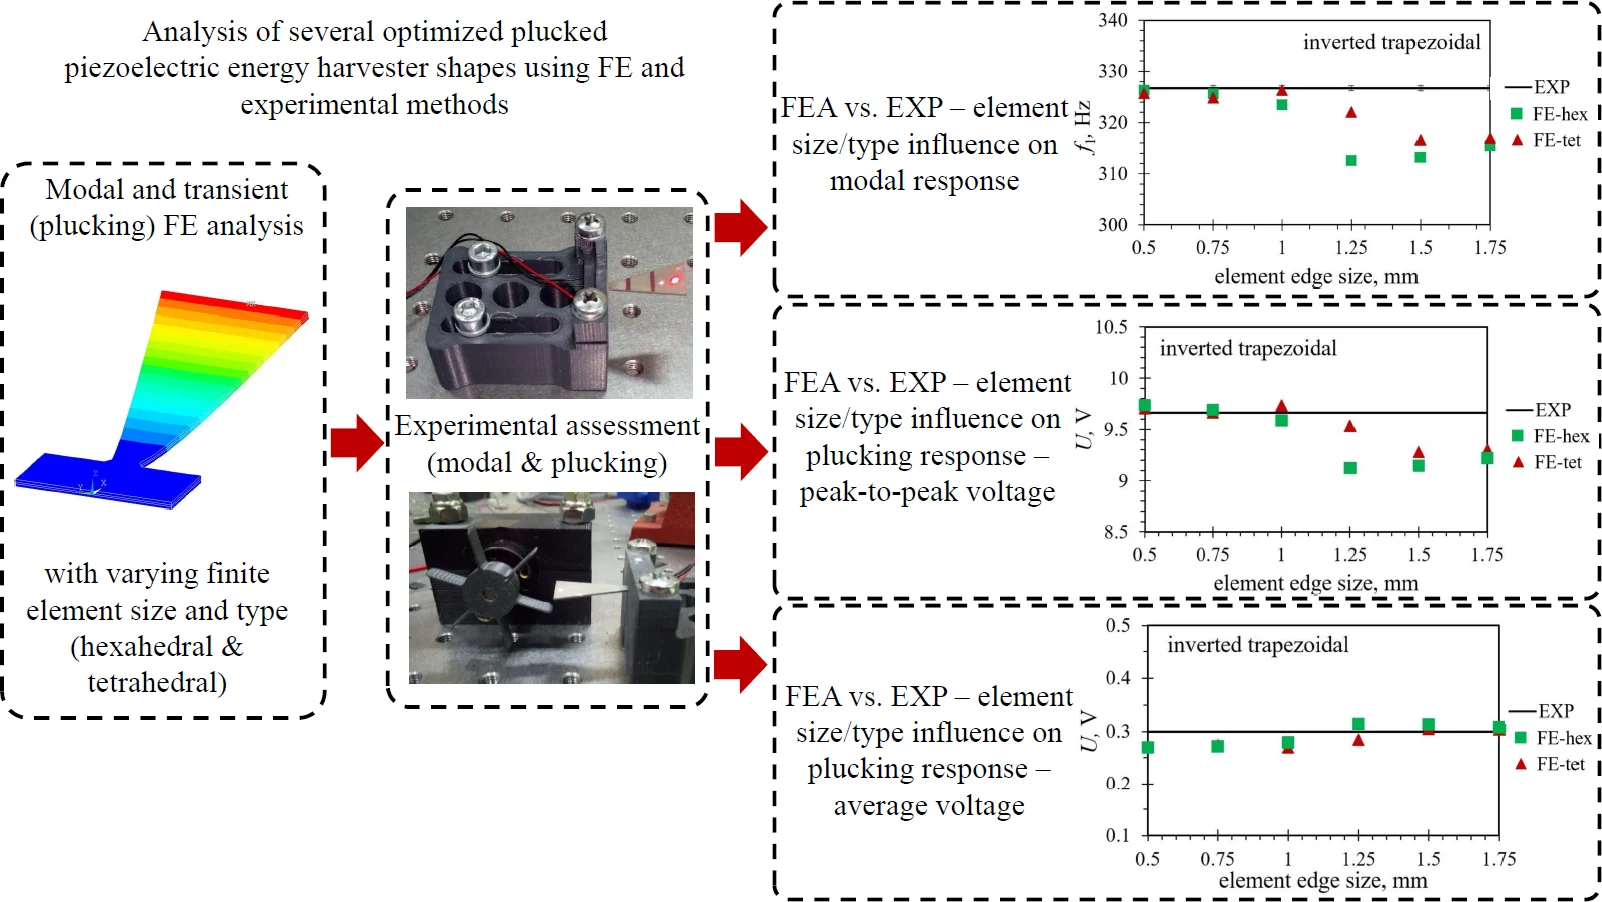
- The modal and transient (plucking) FE analyses are performed on optimized PEHs with varying element size and type, i.e. hexahedral and tetrahedral.
- The modal and plucking responses of the optimized PEHs are experimentally assessed and compared to the FEA results.
- A significant influence of the element type on the PEH response is observed, with tetrahedral elements being generally more suitable to model the complex PEH geometries of analogous size and shape.
- It is concluded that a fairly coarse mesh (element edge length of ~ 1 mm) can used to model optimised PEHs of dimensions comparable to those considered in this work, with an acceptable error of ~ 5 % or less vs. the experiments.
1. Introduction
The power autonomy of a wearable device can be significantly increased by replacing its conventional power source with an energy harvesting (EH) system, collecting low level kinetic energy from human motion and converting it into usable electrical energy [1-4]. Piezoelectric bimorph cantilevers, shown in Fig. 1, commonly used as kinetic energy harvesters due to their high energy density and very good scalability, exhibit a rapid decline in conversion efficiency, i.e., reduced performances, when subjected to an excitation different from the eigenfrequency of the specific device [4]. Several approaches to piezoelectric energy harvester (PEH) design, aimed at overcoming this issue, have been suggested in literature [4-6], most promising being geometry optimization [7-9] and frequency up-conversion (FUC) based on plucking PEH’s free end and letting it oscillate at its eigenfrequency [10].
Fig. 1Piezoelectric bimorph energy harvester [11]
![Piezoelectric bimorph energy harvester [11]](https://static-01.extrica.com/articles/22910/22910-img1.jpg)
With that in mind, several novel optimized PEH shapes have been suggested, intended to be paired with a suitable FUC mechanism, thus collecting random kinetic energy from human motion and converting it into electrical energy [12]. The optimized PEHs were developed using an innovative design approach comprising a combination of the Design-of-Experiment (DoE) methodology and complex finite element (FE) analyses and material strength considerations, resulting in outstanding performance gains [12].
In order to enable the analyses of the performances, the optimization and, finally, the design development of such optimised devices, a suitable numerical (FE) model needs to be employed, implying the need to use an appropriate mesh able to accurately reproduce the behaviour of the complex geometries being studied, i.e. the trapezoidal, the inverted trapezoidal, the notched as well as the trapezoidal and inverted shapes with added stress concentrators, as shown in Fig. 2. All these optimized shapes were derived from a commercially available 30 mm×15 mm rectangular bimorph cantilever, comprising two 0.254 mm PZT-5A layers on top of a 0.15 mm stainless steel substrate. The thus obtained optimised harvester shapes are able to substantially outperform (by up to even 5 times) the conventional rectangular devices on which they are based [12–14].
Fig. 2Optimized PEH shapes: a) trapezoidal, b) inverted trapezoidal, c) notched, d) trapezoidal with stress concentrators and e) inverted trapezoidal with stress concentrators [14]
![Optimized PEH shapes: a) trapezoidal, b) inverted trapezoidal, c) notched, d) trapezoidal with stress concentrators and e) inverted trapezoidal with stress concentrators [14]](https://static-01.extrica.com/articles/22910/22910-img2.jpg)
a)
![Optimized PEH shapes: a) trapezoidal, b) inverted trapezoidal, c) notched, d) trapezoidal with stress concentrators and e) inverted trapezoidal with stress concentrators [14]](https://static-01.extrica.com/articles/22910/22910-img3.jpg)
b)
![Optimized PEH shapes: a) trapezoidal, b) inverted trapezoidal, c) notched, d) trapezoidal with stress concentrators and e) inverted trapezoidal with stress concentrators [14]](https://static-01.extrica.com/articles/22910/22910-img4.jpg)
c)
![Optimized PEH shapes: a) trapezoidal, b) inverted trapezoidal, c) notched, d) trapezoidal with stress concentrators and e) inverted trapezoidal with stress concentrators [14]](https://static-01.extrica.com/articles/22910/22910-img5.jpg)
d)
![Optimized PEH shapes: a) trapezoidal, b) inverted trapezoidal, c) notched, d) trapezoidal with stress concentrators and e) inverted trapezoidal with stress concentrators [14]](https://static-01.extrica.com/articles/22910/22910-img6.jpg)
e)
As the type of finite elements and the density of the mesh, defined by the length of the element edge, can considerably affect the results attained via the FE model, different element types and mesh densities, potentially suited for accurately modelling the various considered optimised PEH geometries, are thoroughly assessed [15]. In fact, although it is well known that a finer mesh generally results in more accurate results, above a certain element edge threshold the required computational time increases significantly. The selection of the mesh density entails, thus, a compromise between the desired accuracy of the results and the computational time used to achieve them [15]. As a considerable number of FE analyses requiring a long computational time is necessary to carry out the aimed shape optimization, a mesh sensitivity analysis is therefore needed to enable expediting the process while maintaining a satisfactory level of result accuracy [15], thus providing important practical guidelines for all subsequent PEH optimisation studies. A systematic study is therefore carried out in this work, whereby each of the considered PEH geometries is meshed using two different element types with incrementally increasing edge lengths. The ensuing modal responses in terms of the first uncoupled (pure mechanical) eigenfrequency [16], obtained for each of the models, are compared to the respective experimentally obtained eigenfrequency values. The uncoupled modal response is initially considered to avoid the influence of the complex forward and backward piezoelectric coupling effects on the behaviour of the studied class of harvesting devices [4, 16-17]. The coupled transient responses, simulating the plucking (frequency up-conversion) excitation of the harvester’s free end and the resulting coupled electromechanical responses, are subsequently assessed for all the studied mesh and element variations and compared to the experimental results [12] in terms of the maximal peak-to-peak and average output voltages.
2. Experimental assessment
2.1. Modal response
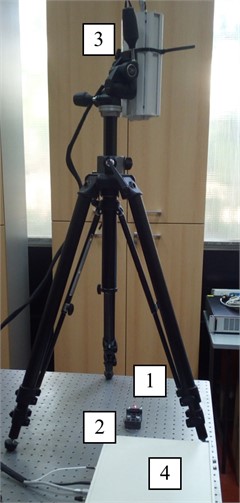
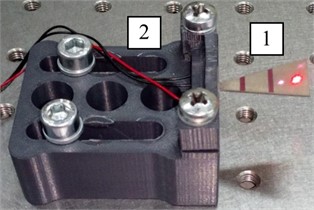
In order to experimentally assess the modal responses of the optimized PEHs shapes in terms of the oscillations of their free ends, and thus the first eigenfrequency of the studied devices, a suitable experimental setup is devised and realized. The setup, displayed in Fig. 3, consists of the studied optimized PEH (1), a clamping mechanism produced using additive manufacturing (AM) technologies and used to obtain the fixture of the PEH clamped end (2), as well as the Metrolaser 500V® laser-Doppler vibrometer (3) with its respective control and DAQ interface (4) [18], all connected to a PC equipped with the appropriate NI LabVIEW® software [19]. The electrodes attached to the piezoelectric layers of the studied devices are disconnected in the performed experiments in order to remove the influence of the resistive load on the response of the device via the mentioned forward and backward piezoelectric coupling effects.
The measurements are performed by subjecting the free end of the optimized PEH to impact excitation and letting the device oscillate at its mechanical eigenfrequency. The oscillations of the free end, i.e., the modal responses, are then measured by using the laser vibrometer, while the first eigenfrequency is assessed via the NI LabVIEW® software. The clamping force applied to the piezoelectric layers of the studied devices is controlled by carefully tightening the two clamping bolts with a 1.5 Nm (± 6 %) torque measured by using a micro-torque wrench. The thus obtained experimental first eigenfrequencies for all the studied optimised PEH shapes, together with their respective standard deviations, are listed in Table 1.
Fig. 3a) Experimental setup: optimized PEH (1), clamping mechanism (2), laser vibrometer (3), vibrometer control and DAQ (4); b) detail: clamped optimized PEH; c) setup schematic representation. Photos were taken by Petar Gljušćić in May 2022 in the Precision Engineering Laboratory of the Department of Mechanical Engineering Design at the University of Rijeka, Faculty of Engineering, Rijeka, Croatia
a)
b)
c)
2.2. Plucking excitation
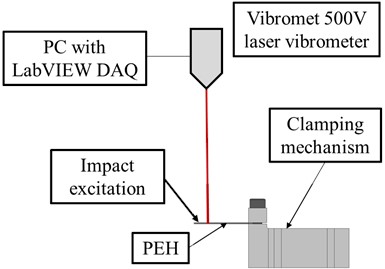
The experimental setup designed for characterizing the coupled electromechanical response of the optimised PEHs while enduring plucking excitation is schematically represented in Fig. 4(a). The setup (shown in detail in Fig. 4(b) and 4(c)) consists of 3D printed clamping mechanisms (1) and rotating plectra (2) plucking the various optimized harvesters (3) via a purely mechanical (i.e., not magnetic) plucking mechanism. This ensures avoiding possible dampening effects of the magnets close to the PEHs’ free ends due to their steel substrates [12]. The thus excited PEHs generate output voltages, which are measured by using an Agilent® DSO-X 2012A oscilloscope paired with a variable resistance box (4) [12]. The resistance box simulates in this case the resistive load of an electrical load (e.g. the sensor) coupled to the PEH transducer, and it is set at the value of the optimal load resistance of the respective energy harvester shape. The initial displacement of the free end, required for later numerical analyses is, in turn, assessed via the mentioned Metrolaser® Vibromet 500V laser doppler vibrometer (5) [12].
Table 1Experimentally assessed modal responses for the optimized PEHs
PEH shape | 1st eigenfrequency , Hz | , Hz |
Trapezoidal | 926.8 | ± 0.58 |
Inverted trapezoidal | 326.7 | ± 0.63 |
Notched | 374.4 | ± 0.39 |
Trapezoidal with stress concentrators | 761.8 | ± 1.01 |
Inverted trapezoidal with stress concentrators | 333.9 | ± 0.59 |
Fig. 4a) Experimental setup schematic representation; b) setup detail: clamping mechanism (1), rotating plectra (2), optimized PEH (3); c) setup detail: DAQ with resistance box (4) and laser vibrometer (5) [12]. Photos were taken by Petar Gljušćić in May 2022 in the Precision Engineering Laboratory of the Department of Mechanical Engineering Design at the University of Rijeka, Faculty of Engineering, Rijeka, Croatia
![a) Experimental setup schematic representation; b) setup detail: clamping mechanism (1), rotating plectra (2), optimized PEH (3); c) setup detail: DAQ with resistance box (4) and laser vibrometer (5) [12]. Photos were taken by Petar Gljušćić in May 2022 in the Precision Engineering Laboratory of the Department of Mechanical Engineering Design at the University of Rijeka, Faculty of Engineering, Rijeka, Croatia](https://static-01.extrica.com/articles/22910/22910-img10.jpg)
a)
![a) Experimental setup schematic representation; b) setup detail: clamping mechanism (1), rotating plectra (2), optimized PEH (3); c) setup detail: DAQ with resistance box (4) and laser vibrometer (5) [12]. Photos were taken by Petar Gljušćić in May 2022 in the Precision Engineering Laboratory of the Department of Mechanical Engineering Design at the University of Rijeka, Faculty of Engineering, Rijeka, Croatia](https://static-01.extrica.com/articles/22910/22910-img11.jpg)
b)
![a) Experimental setup schematic representation; b) setup detail: clamping mechanism (1), rotating plectra (2), optimized PEH (3); c) setup detail: DAQ with resistance box (4) and laser vibrometer (5) [12]. Photos were taken by Petar Gljušćić in May 2022 in the Precision Engineering Laboratory of the Department of Mechanical Engineering Design at the University of Rijeka, Faculty of Engineering, Rijeka, Croatia](https://static-01.extrica.com/articles/22910/22910-img12.jpg)
c)
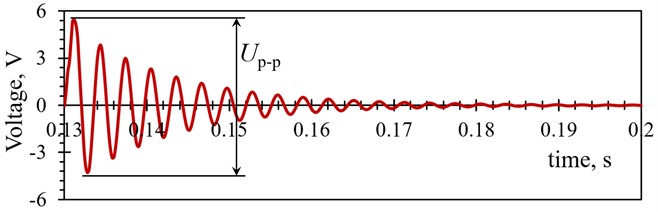
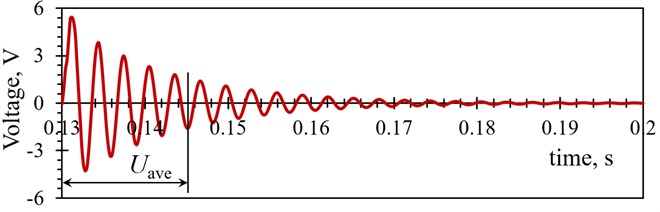
The voltage outputs generated by the optimized PEHs subjected to plucking excitation are listed in Table 2 in terms of the maximal peak-to-peak and average voltages as calculated for the first two and five oscillations respectively. Due to the complexity of the plucking mechanism, the initial deflection of the free end is heavily influenced by the shape and stiffness of both the PEH and the plectrum (resulting from the nonuniform material deposition and delamination during the respective 3D printing process), as well as by the plucking speed, and cannot thus be accurately controlled or predicted in the herein used setup, resulting in different values for each experimentally studied PEH shape [14]. Moreover, the mechanical properties (i.e., stiffness) of the piezoelectric layers is affected by the electrical load applied to the harvester via the piezoelectric coupling effects as well [12, 14].
Table 2Experimentally assessed voltage outputs of the plucked optimized PEHs [12, 14]
PEH shape | , V | , V |
Trapezoidal | 9.66 | 0.299 |
Inverted trapezoidal | 11.46 | 0.283 |
Notched | 23.12 | 0.475 |
Trapezoidal with stress concentrators | 17.9 | 0.452 |
Inverted trapezoidal with stress concentrators | 41.62 | 1.16 |
3. Finite element analyses
As the currently available analytical models are restricted to constant rectangular cross-sections, and are therefore not suitable for modelling complex PEH geometries [2, 16], a numerical finite element approach, using the ANSYS® FE modelling software package, is employed in this work to study the behaviour of the optimized PEH devices. As evidenced above, both modal and transient analyses are employed in this frame to better understand the effects of the utilized mesh on the performances of the studied class of transducers.
3.1. Modal responses
The FE analysis is utilized first to obtain the modes of vibration and the respective eigenfrequencies of the energy harvesters, providing inter alia the indispensable input values for the subsequent coupled transient analyses [20-21]. Only the first vibration mode is considered in this work, as it results in the largest deformations of the vibrating structure, and therefore generates the highest charge (voltage) in the piezoelectric layers [16, 22]. In order to obtain the uncoupled modal responses, the piezoelectric coefficient is set to zero in FE model’s material properties of the piezoelectric layers [7, 16]. As per ANSYS® guidelines for large and symmetric eigenvalue problems, the block Lanczos method, along with the sparse direct matrix solver, are selected for the extraction of the first flexural vibration mode [23]. The models of the studied optimised PEH devices are then clamped at one end by setting the displacement of the top and bottom nodes within the clamping area to zero, and the required number of modes to extract as well as the desired frequency range are set. Bearing in mind the aimed balance between the accuracy of the results and the employed computational times [13, 15, 23, 24], a sensitivity analysis, based on gradually varying the density of the mesh by increasing the element edge length from 0.5 mm up to 1.75 mm, with 0.25 mm increments, is then performed.
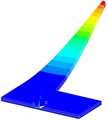
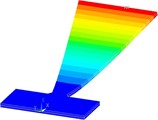
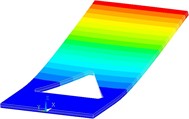
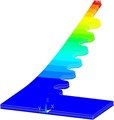
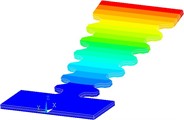
The effect that the used type of the finite elements has on the accuracy of the model is concurrently studied as well. Two different finite element forms are therefore considered: the hexahedral (brick or cube) and the tetrahedral elements’ form. The PEHs’ piezoelectric layers are modelled by using the standard ANSYS® 3D coupled-field solid finite element SOLID226, suitable for modelling piezoelectric, piezoresistive and thermoelectric materials, having 20 nodes and up to 6 DoFs per node. The SOLID186 ANSYS® 3D structural solid element, with 20 nodes and 3 DoFs per node, is, in turn, employed for the substrate [23]. Two different element bonding methods available in ANSYS® were analysed in a previous study, allowing to establish that their variation does not result in a significant effect on the FE model accuracy; the quicker and simpler method of “gluing” neighbouring volumes is therefore used [12-13]. The described modal analyses are employed to generate the modal responses of all the studied optimized PEH shapes and their respective first flexural vibration modes. Examples of the numerically obtained results are displayed in Fig. 5. The attained first eigenfrequencies are thus assessed at different mesh densities and element forms. The numerically attained first eigenfrequencies for the different optimized PEH shapes, obtained by using hexahedral finite elements of varying edge lengths, are listed in Table 3, while those obtained by using tetrahedral elements are listed in Table 4.
Fig. 5Numerically assessed first flexural vibration modes for the optimized PEH shapes: a) trapezoidal, b) inverted trapezoidal, c) notched, d) trapezoidal with stress concentrators and e) inverted trapezoidal with stress concentrators
a)
b)
c)
d)
e)
Table 3Numerically attained first eigenfrequencies f1 for the optimized PEHs using hexahedral elements
PEH shape | Element edge length, mm | |||||
0.5 | 0.75 | 1 | 1.25 | 1.5 | 1.75 | |
Trapezoidal (, Hz) | 928.2 | 926.4 | 926.4 | 925.1 | 916.6 | 928.9 |
Inverted trapezoidal (, Hz) | 326.3 | 325.6 | 323.5 | 312.7 | 313.2 | 315.5 |
Notched (, Hz) | 370.4 | 365.3 | 363.3 | 375.5 | 369.9 | 359.5 |
Trapezoidal with stress concentrators (, Hz) | 756.6 | 760.4 | 751.2 | 759.3 | 761.4 | 762.2 |
Inverted trap. with stress concentrators (, Hz) | 333.3 | 333 | 332.7 | 340.3 | 337.3 | 338 |
Table 4Numerically attained first eigenfrequencies f1 for the optimized PEHs using tetrahedral elements
PEH shape | Element edge length, mm | |||||
0.5 | 0.75 | 1 | 1.25 | 1.5 | 1.75 | |
Trapezoidal (, Hz) | 929.8 | 930.2 | 929.4 | 934.4 | 936.8 | 926.8 |
Inverted trapezoidal (, Hz) | 325.8 | 324.9 | 326.3 | 322.1 | 316.7 | 316.9 |
Notched (, Hz) | 374 | 374.1 | 373.1 | 381.6 | 376.1 | 377.5 |
Trapezoidal with stress concentrators (, Hz) | 760.5 | 762.6 | 760.9 | 769.4 | 772.9 | 778.1 |
Inverted trap. with stress concentrators (, Hz) | 333.9 | 333.5 | 332.8 | 340.3 | 337.3 | 338 |
3.2. Transient responses
Transient FE analyses employed in this work are aimed to simulate the plucking excitation of the piezoelectric energy harvesters. In order to attain the voltage outputs, a coupled FE model with the same geometry and material properties as in the modal analysis is used. The mesh sensitivity analysis is then performed by using the same element types as in case of the modal analysis (i.e., SOLID226 and SOLID186) across the same element edge length range (from 0.5 mm up to 1.75 mm, with 0.25 mm increments). The electromechanical coupling is carried out by setting the effective transverse piezoelectric coefficient, corresponding to the coupling mode 31 of a cantilever-based PEH under a bending load with the force applied perpendicular to the material poling direction, to the PZT-5A piezoelectric material value – 10.4 C/m2 derived from the data obtained from the supplier of the original rectangular bimorph cantilevers [13], as well as by introducing a finite element acting as a variable resistor, i.e., simulating the applied resistive loads, and connecting it to the nodes on the elements forming the piezoelectric layers [12, 14]. The load resistance itself is set to the optimal value for the respective PEH shape [14].
The PEH model is again clamped at one end while an initial displacement, equal to that measured in the respective experiments, is gradually applied to the edge of the free end. The deflected free end is then released by setting the displacement value in the next loading time step to zero, allowing the harvester to freely oscillate at its eigenfrequency [12, 14].
The resulting numerically obtained transient responses for all the studied optimized PEH shapes, assessed at different mesh densities and element forms, are listed in Tables 5 and 6. The results are represented both as maximal peak-to-peak voltages (Fig. 6(a)) generated in the first oscillation of the PEH, and as the average voltages calculated for the first five oscillation cycles (Fig. 6(b)), where the majority of the PEHs’ power output is generated.
Fig. 6Graphical representation of a) the maximal peak-to-peak and b) average voltage calculated over the first five PEHs’ oscillations
a)
b)
Table 5Numerically attained voltage outputs for the optimized PEHs using hexahedral elements
PEH shape | Element edge length, mm | ||||||
0.5 | 0.75 | 1 | 1.25 | 1.5 | 1.75 | ||
Trapezoidal | , V | 11.50 | 11.51 | 11.49 | 11.52 | 11.52 | 11.48 |
, V | 0.33 | 0.33 | 0.33 | 0.33 | 0.35 | 0.33 | |
Inverted trapezoidal | , V | 9.74 | 9.69 | 9.59 | 9.13 | 9.15 | 9.22 |
, V | 0.27 | 0.27 | 0.28 | 0.31 | 0.31 | 0.31 | |
Notched | , V | 22.69 | 22.04 | 21.75 | 23.32 | 22.71 | 21.31 |
, V | 0.56 | 0.60 | 0.62 | 0.53 | 0.57 | 0.65 | |
Trapezoidal with stress concentrators | , V | 40.79 | 41.19 | 40.47 | 41.30 | 41.39 | 41.49 |
, V | 0.92 | 0.90 | 0.96 | 0.91 | 0.90 | 0.89 | |
Inverted trap. with stress concentrators | , V | 17.45 | 17.44 | 17.42 | 17.27 | 17.23 | 17.28 |
, V | 0.49 | 0.49 | 0.50 | 0.52 | 0.52 | 0.51 | |
4. Analysis and discussion of the results
In order to evaluate the impact of mesh density and element form on the modal and transient responses, the results obtained via the FE methods, displayed in Tables 3-6, need to be critically assessed and compared to the experimental data presented in Section 2.
Table 6Numerically attained voltage outputs for the optimized PEHs using tetrahedral elements
PEH shape | Element edge length, mm | ||||||
0.5 | 0.75 | 1 | 1.25 | 1.5 | 1.75 | ||
Trapezoidal | , V | 11.50 | 11.51 | 11.52 | 11.51 | 11.51 | 11.53 |
, V | 0.32 | 0.32 | 0.33 | 0.32 | 0.32 | 0.33 | |
Inverted trapezoidal | , V | 9.71 | 9.66 | 9.73 | 9.53 | 9.28 | 9.30 |
, V | 0.27 | 0.27 | 0.27 | 0.28 | 0.30 | 0.30 | |
Notched | , V | 23.14 | 23.20 | 23.08 | 23.87 | 23.63 | 23.51 |
, V | 0.61 | 0.61 | 0.62 | 0.57 | 0.59 | 0.60 | |
Trapezoidal with stress concentrators | , V | 41.16 | 41.42 | 41.38 | 42.43 | 43.42 | 43.59 |
, V | 1.14 | 1.12 | 1.14 | 1.07 | 1.05 | 1.02 | |
Inverted trap. with stress concentrators | , V | 17.63 | 17.62 | 17.55 | 18.37 | 18.19 | 18.25 |
, V | 0.48 | 0.48 | 0.49 | 0.44 | 0.46 | 0.45 | |
4.1. Modal results
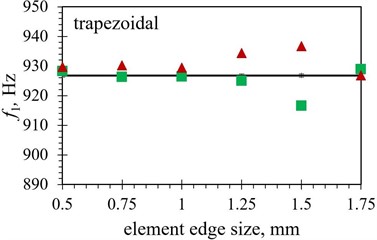
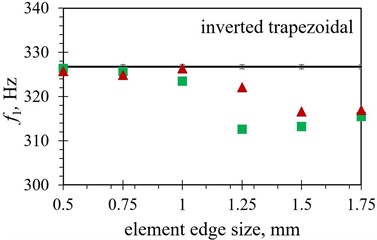
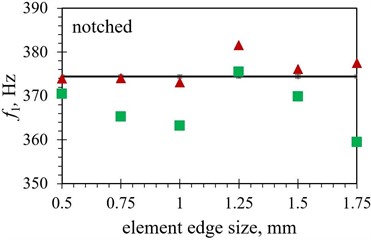
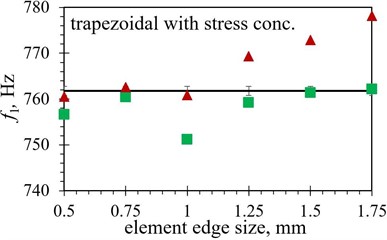
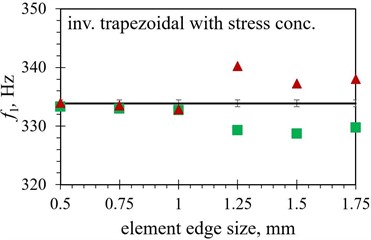
When the modal responses of Tables 2 and 3 are observed, a notable difference in eigenfrequency values can be observed between the models obtained by using the hexahedral and those based on using tetrahedral finite element forms. The absolute difference ranges from as little as < 0.1 % for several shapes using a finer mesh up to ~ 5 % for the inverted trapezoidal shape. This could imply that the correct selection of the element is more important in some geometries than in the others, as the average difference in eigenfrequency values between the two considered element forms is found to be ~ 0.7 % in the case of the trapezoidal shape, while it increases to ~ 2.5 % when the notched shape is analysed. The modal response results obtained by using both considered element forms are graphically displayed in Fig. 7 in comparison with the experimental values. As it can be seen from the figures, the tetrahedral elements seem, overall, to be better suited to model the complex studied optimised PEH geometries. In most cases, most prominently for the notched shape, the hexahedral element results start to diverge from the experimental values even if the mesh is fairly dense, i.e., at element edge lengths of 0.5 mm, while the tetrahedral results follow the experimental values more accurately.
In terms of the element edge length, generally a relatively close match of the FE values with the experimental results can be achieved with tetrahedral elements up to 1 mm, or even, in some cases, 1.25 mm, while more prominent fluctuation can be observed for longer edge lengths. Even if in some of these cases, notably of the 1.75 mm elements applied to both trapezoidal shapes, the use of larger elements results in a very close match with experimental data, such a model should be thoroughly assessed in terms of its stability.
The hexahedral elements exhibit, in turn, a fairly close match to the experimental values with element edge lengths up to 1 mm only in case of both trapezoidal shapes (1.25 mm in case of the straight edged one). When more complex optimised PEH geometries are investigated, the mentioned limitation of hexahedral elements hinders a comprehensive analysis, as only elements of 1 mm or less can be used, most apparently when the notched and the inverted shape with stress concentrators are observed.
Table 7Average difference between numerical vs. experimental first eigenfrequencies f1 for the two different elements forms
PEH shape | Element form | |
Hexahedral | Tetrahedral | |
Trapezoidal (FE vs. EXP) | 0.17 % | 0.47 % |
Inverted trapezoidal (FE vs. EXP) | 2.27 % | 1.44 % |
Notched (FE vs. EXP) | 1.92 % | 0.43 % |
Trapezoidal with stress concentrators (FE vs. EXP) | 0.43 % | 0.73 % |
Inverted trap. with stress concentrators (FE vs. EXP) | 0.83 % | 0.62 % |
In order to illustrate the influence of the element type on the model accuracy, the average difference between the FE eigenfrequency values obtained via the two used element forms and those assessed experimentally is listed in Table 7. A clear advantage of using tetrahedral elements can thus be observed, with differences smaller than 1.5 % (generally < 0.7 %), except for the trapezoidal shapes, which seem to favour the hexahedral elements, displaying an average difference of 0.17 % vs. 0.47 % for the straight edged shape and 0.43 % vs. 0.73 % for the shape with stress concentrators.
Fig. 7Numerical first eigenfrequency values f1 obtained with different finite element forms with varying edge lengths for the optimized PEH shapes, compared to the respective experimental data: a) trapezoidal, b) inverted trapezoidal, c) notched, d) trapezoidal with stress concentrators and e) inverted trapezoidal with stress concentrators
a)
b)
c)
d)
e)

4.2. Transient results
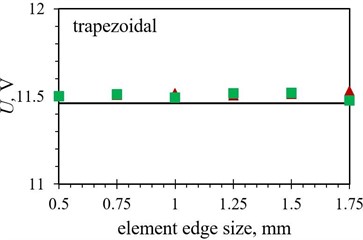
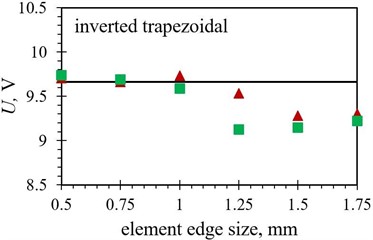
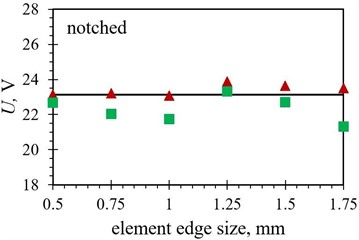
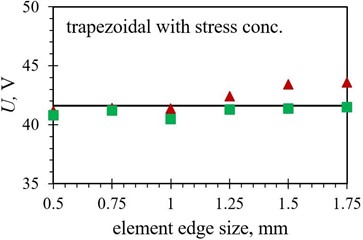
When the transient results are considered, a pattern similar to that seen in the modal case can be observed. The comparison is graphically displayed in Figs. 8 and 9 for the maximal peak-to-peak and the average output voltages respectively. Tables 6 and 7 show, in turn, the average difference between the numerical and experimental results in terms of the maximal peak-to-peak and the average output voltages obtained by using the two different element forms.
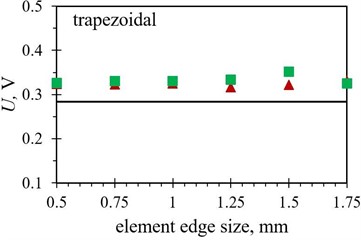
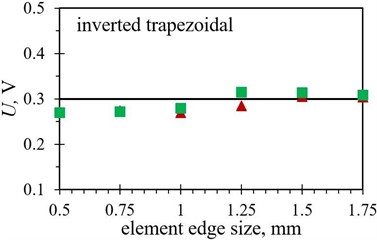
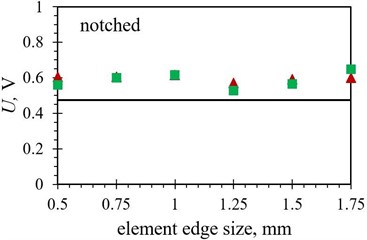
The absolute difference between the results of the experimental and the FE analyses, in terms of the maximal peak-to-peak output voltages, ranges from as little as < 0.1 % for the straight edged inverted trapezoidal shape, up to ~ 8 % for the notched shape. If the average voltage is considered, a notably larger discrepancy can be seen between the experiments and FE analyses, ranging from ~ 1.6 % for the inverted trapezoidal shape up to ~ 26 % in case of the notched shape. Such an occurrence, i.e., the inability of the numerical model to accurately predict the behaviour of the oscillating PEH throughout its oscillating period could be attributed to the slight shift in the oscillation frequency (as discussed in Subsection 4.1.), the non-ideal modelling of the clamping area, as well as the inaccuracies present in assessing the FEA damping coefficients.
Fig. 8Numerical maximal peak-to-peak output voltage values obtained with different finite element forms with varying edge lengths for the optimized PEH shapes, compared to the respective experimental data: a) trapezoidal, b) inverted trapezoidal, c) notched, d) trapezoidal with stress concentrators and e) inverted trapezoidal with stress concentrators
a)
b)
c)
d)
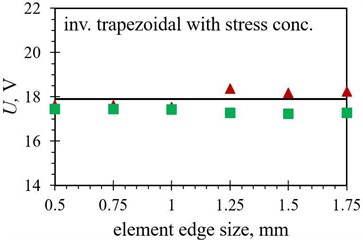
e)

As it can be observed in Figs. 8 and 9, the tetrahedral elements appear to generally be more suitable for modelling the considered complex optimised PEH geometries, except, similar as in the case of the modal responses, for both the trapezoidal shapes, where the usage of hexahedral elements results in more accurate results in terms of the maximal peak-to-peak output voltages. This could be attributed to the relatively wide and homogenous trapezoidal area near the clamping base (where most of the charge is generated), which might favour brick elements. In general, the maximal peak-to-peak voltage results, obtained by using both tetrahedral and hexahedral elements, follow fairly accurately the experimental data up to an element edge length of 1.25 mm. The two exceptions are the straight edged inverted trapezoidal shape, where a significant divergence occurs at the 1 mm edge length, and the notched shape, where the hexahedral element results start to deviate already at an element edge length of 0.75 mm.
Fig. 9Numerical average output voltage values, measured over the first five PEH oscillations, obtained with different finite element forms with varying edge lengths for optimized PEH shapes, compared to the respective experimental data: a) trapezoidal, b) inverted trapezoidal, c) notched, d) trapezoidal with stress concentrators and e) inverted trapezoidal with stress concentrators
a)
b)
c)
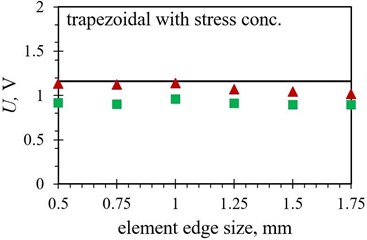
d)
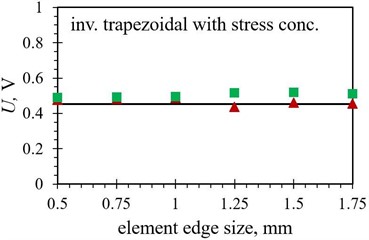
e)

In terms of the average output voltages, the overall divergence from the experimental results is significantly more pronounced for all the studied PEH shapes due to the above-mentioned issues. The trend exhibited by the two datasets (hexahedral vs. tetrahedral) seems, however, to be very similar.
As it was the case with the modal results, the importance of selecting the appropriate element form for modelling a specific optimised PEH geometry is apparent in the transient analyses as well, shown by the average differences listed in Table 8, where an average difference in the maximal peak-to-peak voltage values between the two considered element forms is found to be smaller than 0.5 % in case of the trapezoidal shape with straight edges, increasing to ~ 3 % for the inverted trapezoidal shape with stress concentrators. The tetrahedral elements show again a slightly better performance (differences of ~ 2 % or less) for most of the studied PEH shapes, except for the two trapezoidal ones, where hexahedral element exhibit slightly better results (0.38 % vs. 0.46 % and 1.25 % vs. 2.15 % respectively).
When the average voltage values, listed in Table 9, are in turn observed, the previously mentioned overall smaller deviations between the diverse element forms can be seen (apart for the trapezoidal shape with stress concentrators), whereas the divergence from the experimental results is significantly more pronounced. It should be also noted here that the required computational times, typically insignificant for modal analyses of this scale and already much longer in the case of the transient analyses, vary considerably depending on the element edge length, ranging from several minutes per simulation in case of elements with an edge length of 1 mm and above, up to several hours for finer meshes using 0.5 mm and 0.75 mm elements. The influence of element form is negligible in this frame, while the volume of the studied PEH, predictably, does somewhat affect the time required to solve the larger number of equations.
Table 8Average difference between numerical vs. experimental maximal peak-to-peak output voltages for the two different elements forms
PEH shape | Element form | |
Hexahedral | Tetrahedral | |
Trapezoidal (FE vs. EXP) | 0.38 % | 0.46 % |
Inverted trapezoidal (FE vs. EXP) | 2.94 % | 1.73 % |
Notched (FE vs. EXP) | 1.92 % | 1.29 % |
Trapezoidal with stress concentrators (FE vs. EXP) | 1.25 % | 2.15 % |
Inverted trap. with stress concentrators (FE vs. EXP) | 3.12 % | 1.88 % |
Table 9Average difference between numerical vs. experimental average output voltages for the two different elements forms
PEH shape | Element form | |
Hexahedral | Tetrahedral | |
Trapezoidal (FE vs. EXP) | 16.07 % | 13.25 % |
Inverted trapezoidal (FE vs. EXP) | 6.64 % | 6.31 % |
Notched (FE vs. EXP) | 20.67 % | 22.95 % |
Trapezoidal with stress concentrators (FE vs. EXP) | 23.83 % | 6.43 % |
Inverted trap. with stress concentrators (FE vs. EXP) | 11.04 % | 4.23 % |
5. Conclusions
The accuracy of the FE model is strongly influenced by the size and the type of the used finite elements, which is particularly apparent when complex geometries, such as the herein considered optimised PEH shapes, are modelled. In this work the modal analysis, an important step in the complex FE modelling of optimised PEHs’ behaviour, together with the transient analyses, aimed to be used in subsequent studies as potential virtual experiments when the optimization of the complex coupled electromechanical behaviour of piezoelectric transducers is aimed at, are employed to systematically investigate these issues.
Two experimental setups aimed at assessing the optimised PEHs devices’ first flexural eigenfrequency as well as the coupled output voltage responses are therefore devised, and the respective stress concentrators. In all the studied cases, two different forms of finite elements are used, i.e., the hexahedral and the tetrahedral type, concurrently with varying element edge lengths, resulting in varying mesh densities.
The comparison of the thus obtained results allows establishing that, compared to hexahedral elements, tetrahedral elements are generally more suitable to model the complex PEH geometries of analogous size and shape. The performances of the hexahedral elements are observed to be slightly better in case of both trapezoidal shapes, i.e., with and without stress concentrators, which could be attributed to the relatively wide and homogenous trapezoidal area near the clamping base (where most of the charge is generated), possibly favouring the choice of such elements. In terms of eigenfrequency, both element forms allow attaining a relatively small deviation from the experimental values for element edge lengths of up to 1 mm, providing a good guideline for future mesh density settings. In some of the studied cases, larger sized elements result in a surprisingly good match between numerical and experimental data; such cases need, however, to be additionally assessed in terms of model stability.
When transient analyses are considered, a similar trend occurs, with 1.25 mm being the largest element edge length suitable for achieving sufficiently accurate results in terms of the maximal peak-to-peak output voltages with a < 5 % difference with respect to the experimental results in the case of tetrahedral elements and < 6.5 % for the hexahedral ones. In terms of the average output voltages generated within the first five oscillation cycles of the PEHs, the trends exhibited by the two sets of results (obtained by using the hexahedral and the tetrahedral elements) seem to be relatively uniform, albeit slightly offset. Moreover, a quite more pronounced deviation from the experimental values is observed in this case, necessitating further adjustments in the FE model itself, i.e., critically reconsidering the modelled clamping conditions and damping coefficients.
With all of this in mind, if a substantial number of coupled transient analyses is to be employed as virtual experiments in an optimization process, a fairly coarse mesh with an element edge length of 1 mm, or even 1.25 mm can confidently be utilized to model optimised PEHs of dimensions comparable to those considered in this work. This way, an acceptable accuracy level with a discrepancy of < 5 % vs. the experimental data can be expected in terms of the maximal peak-to-peak output voltages along with a considerable reduction in computational time, thus expediting the optimization process.
The results given in this work represent, therefore, an appropriate starting point for future studies of the effects of mesh density and element forms of complex FE models, when nonlinear damping influences and different excitation methods are to be included as well. As the density of the mesh and the element arrangements strongly affect both the uncoupled and the coupled responses of an optimised PEH, more in depth studies of their influence on the modal and transient responses might produce additional valuable insights as well as, combined with the aforementioned DoE approach, provide a useful tool for quicker optimization and development of high-performance piezoelectric energy harvesters. This could, in turn, lead to better designs of energy harvesting devices suited for a wide range experimental values are obtained for five considered optimised PEH shapes, i.e., the trapezoidal, the inverted trapezoidal and the notched shapes, as well as the trapezoidal and the inverted shapes with
of applications, from wearable medical devices, to remote autonomous sensor nodes and aerospace structural health monitoring.
References
-
Y. K. Tan, Energy Harvesting Autonomous Sensor Systems: Design, Analysis, and Practical Implementation. Boca Raton: CRC Press, 2017.
-
P. Gljušćić, S. Zelenika, D. Blažević, and E. Kamenar, “Kinetic energy harvesting for wearable medical sensors,” Sensors, Vol. 19, No. 22, p. 4922, Nov. 2019, https://doi.org/10.3390/s19224922
-
Q. Ouyang et al., “Self-powered, on-demand transdermal drug delivery system driven by triboelectric nanogenerator,” Nano Energy, Vol. 62, pp. 610–619, Aug. 2019, https://doi.org/10.1016/j.nanoen.2019.05.056
-
S. Priya and D. J. Inman, Energy Harvesting Technologies. New York, NY: Springer, 2009.
-
K. Aouali, N. Kacem, N. Bouhaddi, E. Mrabet, and M. Haddar, “Efficient broadband vibration energy harvesting based on tuned non-linearity and energy localization,” Smart Materials and Structures, Vol. 29, No. 10, p. 10LT01, Oct. 2020, https://doi.org/10.1088/1361-665x/abaa95
-
Z. Xu, X. Shan, D. Chen, and T. Xie, “A novel tunable multi-frequency hybrid vibration energy harvester using piezoelectric and electromagnetic conversion mechanisms,” Applied Sciences, Vol. 6, No. 1, Jan. 2016, https://doi.org/10.3390/app6010010
-
D. Benasciutti, L. Moro, S. Zelenika, and E. Brusa, “Vibration energy scavenging via piezoelectric bimorphs of optimized shapes,” Microsystem Technologies, Vol. 16, No. 5, pp. 657–668, May 2010, https://doi.org/10.1007/s00542-009-1000-5
-
D. O. Masara, H. El Gamal, and O. Mokhiamar, “Split cantilever multi-resonant piezoelectric energy harvester for low-frequency application,” Energies, Vol. 14, No. 16, p. 5077, Aug. 2021, https://doi.org/10.3390/en14165077
-
P. Biswal, S. K. Kar, and B. Mukherjee, “Design and optimization of high-performance through hole based MEMS energy harvester using PiezoMUMPs,” Journal of Electronic Materials, Vol. 50, No. 1, pp. 375–388, Jan. 2021, https://doi.org/10.1007/s11664-020-08528-6
-
M. M. Ahmad, N. M. Khan, and F. U. Khan, “Review of frequency up‐conversion vibration energy harvesters using impact and plucking mechanism,” International Journal of Energy Research, Vol. 45, No. 11, pp. 15609–15645, Sep. 2021, https://doi.org/10.1002/er.6832
-
P. Gljušćić and S. Zelenika, “Assessment of performances of optimized piezoelectric energy harvesters for wearables,” in Proceedings of the 20th International Conference of the EUSPEN – European Society for Precision Engineering and Nanotechnology, pp. 49–52, 2020.
-
P. Gljušćić and S. Zelenika, “Experimental characterization of optimized piezoelectric energy harvesters for wearable sensor networks,” Sensors, Vol. 21, No. 21, p. 7042, Oct. 2021, https://doi.org/10.3390/s21217042
-
piezo.com. https://piezo.com/ (accessed Feb. 20, 2021).
-
P. Gljušćić, “Design of miniaturized wearable broadband energy harvesters,” Ph.D. thesis, University of Rijeka, Faculty of Engineering, Rijeka, 2022.
-
D. W. Nicholson, Finite Element Analysis Thermomechanics of Solids. CRC Press, 2003, https://doi.org/10.1201/9780203009512
-
A. Erturk and D. J. Inman, “An experimentally validated bimorph cantilever model for piezoelectric energy harvesting from base excitations,” Smart Materials and Structures, Vol. 18, No. 2, p. 025009, Feb. 2009, https://doi.org/10.1088/0964-1726/18/2/025009
-
D. J. Inman, Engineering Vibration. Pearson, 2014.
-
“Metrolaser Vibromet 500V vibrometer.”. http://www.metrolaserinc.com/products/vibrometer/ (accessed Jan. 18, 2022).
-
NI LabVIEW. https://www.ni.com/en-rs/shop/labview.html (accessed Jan. 18, 2022).
-
P. Gljuscic and S. Zelenika, “Coupled electromechanical numerical modelling of piezoelectric vibration energy harvesters,” Proceedings of the 29th International DAAAM Symposium 2018, Vol. 1, pp. 0009–15, 2018, https://doi.org/10.2507/29th.daaam.proceedings.002
-
Y. Yang, Q. Shen, J. Jin, Y. Wang, W. Qian, and D. Yuan, “Rotational piezoelectric wind energy harvesting using impact-induced resonance,” Applied Physics Letters, Vol. 105, No. 5, p. 053901, Aug. 2014, https://doi.org/10.1063/1.4887481
-
L. Meirovitch, Fundamentals of Vibrations. Boston: McGraw-Hill, 2001.
-
S. Ahmad, B. M. Irons, and O. C. Zienkiewicz, Theory Reference for the Mechanical APDL and Mechanical Applications. Ansys, 2009, p. 1226.
-
J. Sorić, Finite Element Method. 2004.
About this article

Work supported by the University of Rijeka grants uniri-tehnic-18-32 “Advanced mechatronics devices for smart technological solutions” and uniri-tehnic-18-116 “Research and development of machine learning-based predictive models of design-relevant materials’ behaviour”, supported in part by the Croatian Science Foundation under the project IP-2020-02-5764 “Development of machine learning-based models for materials behaviour estimation”, and partially performed in the frame of the EU COST Action CA18203 “Optimizing Design for Inspection”.
The datasets generated during and/or analyzed during the current study are available from the corresponding author on reasonable request.
The authors declare that they have no conflict of interest.
