Abstract
This paper establishes a three-dimensional solid model of J76-125 Straight Side High-speed Double-crack Precision Press using CATIA, and then the model is imported into an ANSYS environment to form the static and dynamic finite element simulation model. Based on the finite element analysis method, the static stress, deformation, vibration mode and transient response of the press bed are developed under preload conditions, as well as under the combination of the preload and nominal pressure conditions. Besides, the static loading experiment, the mode experiment and the pile-driving experiment are conducted to revise the simulation model. Finally, the simulation model and analysis procedure are verified through the comparison of the experiment results and the simulation ones.
1. Introduction
High-speed press is a type of forging machine which is extensively used in the industrial manufacturing and production [1]. As usual, forging machines are designed by analogical and empirical methods. The size of the press is determined when setting a certain safety coefficient to ensure the maximum stress and deformation of the press are less than the allowable ones. However, there are some problems about this method. Firstly, the stress and deformation is worked out under a series of hypothesis and a larger safety factor is often selected for safety sake. Therefore, the press designed with this method is quite bulky and material-wasting [2]. Secondly, the safety coefficient method is mainly applied to simple rod pieces. However, it could lead to large difference between the stress obtained by the classical mechanics method and the actual ones. Thirdly, most failure modes of the press bed are loss of accuracy caused for suffering the impact load working conditions. However, this kind of load is ignored when the press is designed by the safety coefficient method. Thus, the press designed by this way usually has a low stability of accuracy [3, 4]. Finally, the procedure of the traditional design method can be summarized as “design – evaluation – to design”. First of all, according to the design scheme, make a prototype and then take relative tests on the prototype. Next adjust the design scheme according to the tests result. Then recycle repeat the procedure above. These tedious procedures make the traditional press design time-wasting and expensive.
The virtual simulation analysis mainly consists of static and dynamic analysis for they build a base for optimized design and remanufacturing of high-speed press [5]. Through the static analysis, the stress and deformation of the press can be obtained and the weak parts under the static load conditions can be found; similarly, through the dynamic characteristic analysis, the vibration mode and weak parts of the press bed under the dynamical load conditions can be obtained [6]. And based on this, the later researchers can conduct further optimal design of the press bed structure and strengthen its weak parts [7, 8].
This paper is devoted to dynamics analysis and static analysis of the J76-125 Straight Side high-speed Double-crack Precision Press bed (in the following of this paper, it is called J76-125 high-speed Press for short). The remaining of this paper is organized as follows: Section 2 presents the static characteristic simulation analysis method. Section 3 presents the dynamic characteristic simulation analysis method. Section 4 presents the experiment verification and Section 5 concludes this paper.
2. Finite element model and load characteristic
2.1. Finite element model of the press bed
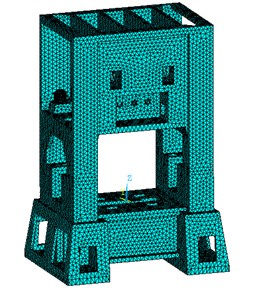
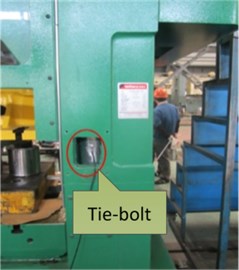
As is shown in Fig. 1, the high-speed press bed mainly consists of two parts: beam and base. The two parts are contacted by four pairs of struts and fixed by four tie-bolts. And there are four convex plates on the beam to fit the tie-bolts. Besides, there are two four in the beam to install the crankshaft. The worktable is installed on the upper surface of the base and the slider is driven by the crankshaft which is installed on the crankshaft-hole. A three-dimensional (3D) model of the press bed is modeled in CATIA. Then the model is imported into an ANSYS environment. The finite element model of the high-speed press is obtained and it is shown in Fig. 2.
Fig. 13D model of the high-speed press bed
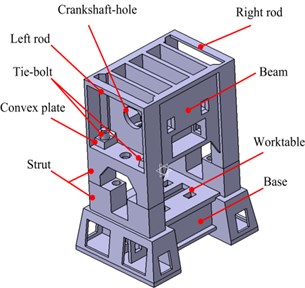
Fig. 2FEM model of the high-speed press bed
2.2. Force analysis of the press bed
2.2.1. Preload applied on the tie-bolts under the nominal pressure
To ensure the press operate properly, the beam and the base should be contacted closely together. Therefore, preload should be applied on the four tie-bolts directly. According to the computational analysis, the preload of tie-bolts should be 1.89 times of the nominal pressure. The nominal pressure of this type of press is 1250 kN, so the preload of each tie-bolt should be 590.625 kN.
2.2.2. Loads applied on the beam and base under the nominal pressure
The surface of crankshaft-hole is subjected to loads which are perpendicular to the upper surface in point-load form when the press is working. The loads are shown in Fig. 3.
Fig. 3Loads on the crankshaft-hole
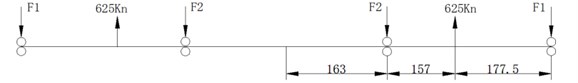
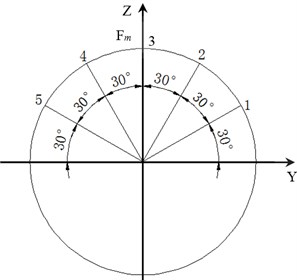
is 293.35 kN, is 331.65 kN. According to Persson [9, 10], the loads follow cosine distribution when the contact gap is close to 0. To simplify the computation, the upper half of the crankshaft-hole is equally divided into 6 parts in the circumferential direction by 5 nodes, as shown in Fig. 4. Then:
where is the maximum load applied on the upper half of the left bearing; is the maximum load applied on the upper half of the right bearing.
Fig. 4The force decomposition on bearing hole
From Eq. (1) and Eq. (2), the value of and can be expressed as:
So the load distribution of the 5 nodes of the upper half of bearing hole in the circumferential direction is shown in Table 1.
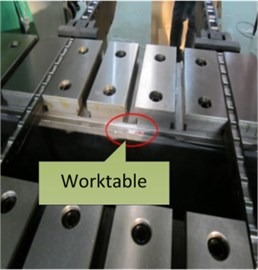
The direction of the load applied to the worktable is acting vertically downward; the area of the worktable is 0.825 m2 and the nominal pressure is 1250 kN, so the mean load is 1.52 MPa.
Table 1Load distribution of the 5 nodes of upper half of bearing hole
Left bearing bore | Right bearing bore | ||||
Location | Force of axis | Force of axis | Location | Force of axis | Force of axis |
1 | 8148.6 | 14113.8 | 1 | 9212.5 | 15956.5 |
2 | 24445.8 | 14113.8 | 2 | 27637.5 | 15956.5 |
3 | 32594.4 | 0 | 3 | 36850.0 | 0 |
4 | 24445.8 | 14113.8 | 4 | 27637.5 | 15956.5 |
5 | 8148.6 | 14113.8 | 5 | 9212.5 | 15956.5 |
3. Static characteristic analysis of the press bed
3.1. Boundary conditions
3.1.1. Constraints
The beam and the base are contacted by their struts and the struts are of the same stiffness, so the contact forms are set as surface-to-surface contact in flexible structures. Four struts of the base are regarded as the target surface while the four struts of the beam are set as contact surface. The type of the contact elements of the target surface is set as Targe170, while the contact surface as Conta174. The contact between the base and ground is set as fixed constraint.
3.1.2. Loads
Firstly, apply Gravity on the beam and base, and then set the preload of the tie-bolts through the pretension element PRETS179. So the static characteristic of the bed and tie-bolts under preload can be developed.
Secondly, apply the nominal pressure on them. So the static characteristic of the bed and tie-bolts under the combination of preload and nominal pressure can be also solved.
3.2. Stress and strain analysis under the preload only
The stress and deformation of the press under the preload only are solved by ANSYS.
The beam and base which mainly bear pressure stress are made of cast iron, so they don’t need to be verified. The tie-bolts bear tensile stress that is concentrated on the contact area with the nuts. The maximum value is 206.77 MPa, which is shown in Fig. 5. The strength of the tie-bolts is 600 MPa, so it meets the strength requirement.
Fig. 5Stress diagram of the tie-bolts
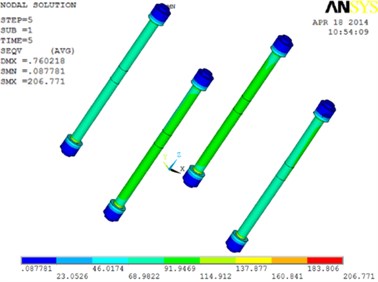
Fig. 6Strain diagram of the base along the Z axis
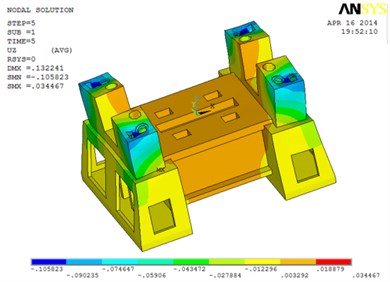
As to the deformation under the preload, we only concern on the deformation of the worktable for that the machining precision of the press is mainly determined by the worktable. The deformation of the worktable is homogeneous and the value is 3.292×10⁻³mm, which is shown in Fig. 6. According to the design standard, the permissible deflection is 2×10⁻⁵, where is the length of worktable with a value of 1300 mm, so the maximum allowed deflection of the worktable is 0.26 mm. Therefore, it meets the stiffness requirement.
3.3. Stress and strain analysis under the combination of preload and nominal pressure
The stress and deformation of the press bed under the combination of preload and nominal pressure are solved by ANSYS. Comparison of the maximum stress and deformation of different parts under two loading conditions (preload only, as well as combination of preload and nominal pressure) are shown in Table 2.
The results of the analysis can be summarized as follows. When the beam bears both the preload and nominal pressure, it also bears compressive stress. The stress of the four tie-bolts decreases while the stress of the middle part of the beam increases. The position of the maximum stress changes from the convex plate to the upper part of the crankshaft-hole. The position where the beam deforms most doesn’t change, but the value decreases. Besides, the base bears compressed stress and the position of the maximum stress doesn’t change but the value decreases. The position where the base distorts seriously changes from the contact areas between the base and the beam to the convex plate. In addition, the tie-bolts still bear tensile stress and the positions of the maximum stress and deformation don’t change, while the values of stress and deformation increase.
Corresponding to the previous section, we also only concern on the stress of the tie-bots and the deformation of the worktable along the axis. The maximum stress of the tie-bolts is 319.109 MPa and the tensile strength is 600 MPa, so it meets the strength requirement. The deformation of the middle part of the worktable is larger than the one of the two ends, and the maximum deformation is –0.055551 mm. The permissive deformation of the worktable is 0.26 mm which also meets the stiffness requirement.
Table 2The maximum stress and deformation of different parts under two loading conditions
Analysis part | Combination of preload and nominal pressure | Preload only | |||
Stress / MPa | Deformation / mm | Stress / MPa | Deformation / mm | ||
Beam | Value | 156.82 | –0.141991 | 66.938 | –0.333255 |
Position | Upper surface of the crankshaft -hole | Convex plate fitted tie-bolts of beam | Convex plate fitted tie-bolts of beam | Convex plate fitted tie-bolts of beam | |
Base | Value | 58.7695 | 0.063941 | 60.3114 | –0.105823 |
Position | Convex plate fixed tie-bolts of beam | Convex plate fixed tie-bolts of beam | Convex plate fixed tie-bolts of beam | Contact area with beam. | |
Tie-bolts | Value | 319.109 | 0.5301 / –0.5749 | 206.771 | 0.5492 / –0.7598 |
Position | Contact area with nuts | Two ends of tie-bolts | Contact area with nuts | Two ends of the tie-bolts | |
4. Dynamic analysis of the bed
4.1. Modal analysis of the press bed
The motion equation of the system was established firstly when performing modal analysis. The press bed is an elastomer with its mass distributing evenly, so it can be taken as a multiple-degree-of-freedom system which consists of several lumped masses. And its motion equation can be expressed by the following equation:
where is the stiffness matrix of the system; is the damping matrix of the system; is the mass matrix of the system; is the displacement vector of the system; is the exciting vector imposed on the system.
Take the system displacement vector of simple harmonic motion into the equation above. Then (the square of the natural frequency) and (vibration modes of the system) can be calculated.
Vibration mode represents the natural dynamic features of the press system, and each vibration mode has a specific natural frequency, damping ratio and modal shape. In this study, the vibration modes are named the first order, the second order, and so on from small to large of the specific natural frequency. The press vibrates when the order natural frequency of the vibration mode is close to the working frequency of the press. Therefore, the press has low machining accuracy, large noise and even failure when the press system works close to the natural frequency. The resonance of the press occurs when the working frequency is equal to the natural frequency.
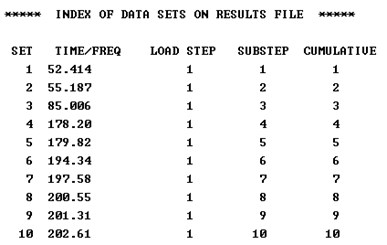
The frequency range of the outer impulse generated by the crankshaft rotation is from 2.5 Hz to 8.3 Hz, which is regarded as the punching frequency of the press. And the punching frequency is quite low, so only the top-ranked vibration mode needs to be considered while performing modal analysis [11]. The first ten orders natural frequencies were obtained through virtual simulation as shown in Fig. 7 [12]. All of the first ten orders natural frequencies are higher than the working frequency, so the design of the press structure meets the requirements
Fig. 7First ten order natural frequencies
To better understand the present pattern of the vibration modes, the first three order vibration modes of the press are illustrated as shown in Fig. 8. The first order vibration mode represents that the bed’s vibration direction is along the axis and its amplitude increases gradually in the direction of axis; and the second vibration mode represents that the bed vibration direction is along the axis and its amplitude increases gradually in the direction of axis; the third vibration mode presents that the bed rotates about the axis and the rotation amplitude increases from the internal to the external of the bed structure.
Fig. 8First three order vibration modes
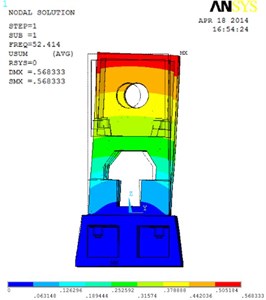
a) The first order vibration mode
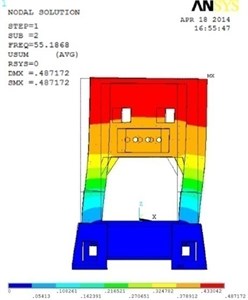
b) The second order vibration mode
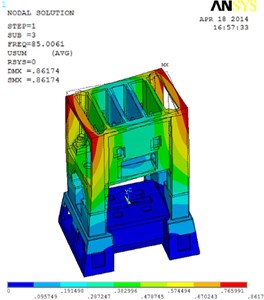
c) The third order vibration mode
4.2. Transient response analysis of the press bed
4.2.1. Parameter setting
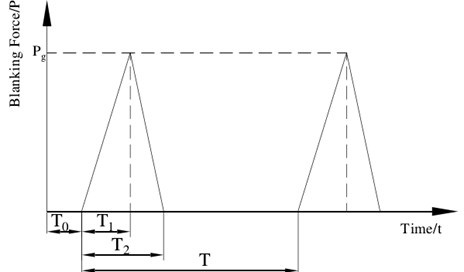
Generally speaking, when the punch press reaches one third of the thickness of the sheet metal, the blanking force reaches the maximum value and then decreases rapidly. When the punch reaches the 0.45 times thickness of the sheet metal, the sheet metal would break up. The change law of the load over time is shown in Fig. 9, where and represents the time that the punch reaches 0.33 and 0.45 times of the thickness of the sheet metal, respectively.
According to the working principle of the press, the load under the typical processing conditions can be obtained and the results are shown in Table 3.
Table 3The load and time distribution under the typical processing condition
Working condition data | Time | |||
(times/min) | Depth / mm | / s | / s | / s |
300 | 2.00 | 0.0027 | 0.0036 | 0.2 |
In this paper, we adopt complete analysis method to perform the transient response analysis [13]. The simulation parameters are set according to Table 3.
Fig. 9Load changes over time
4.2.2. Transient response analysis
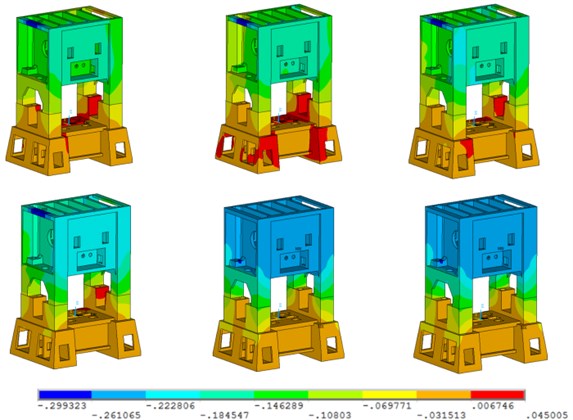
In order to obtain the law of deformation and stress of the press bed, deformation nephogram and stress nephogram along the axis of the bed at some selected time in a loading cycle are extracted. They are 0.004 s, 0.0067 s, 0.0103 s, 0.0737 s, 0.1370 s and 0.2004 s, respectively. And their deformation and stress diagrams along the axis are shown in Fig. 10 and Fig. 11.
From Fig. 10, in a loading cycle, the serious deformation of the press occurs at the left rod of the beam. From Fig. 11, the maximum strain value of the press occurs at the struts and the tie-bolts. In the pile-driving experiment section later, we will take these three positions as key points to analyze.
Fig. 10Z axis deformation diagram of the bed at the selected time
5. Experimental verification
5.1. Experimental procedure
5.1.1. Static loading experiment
Five positions where there would be deformations verified by the finite element analysis method are selected to install strain foils to measure the strain data. The specific location where the strain foils are fixed are shown in Fig. 12.
Fig. 11Strain diagram of the bed at the selected time
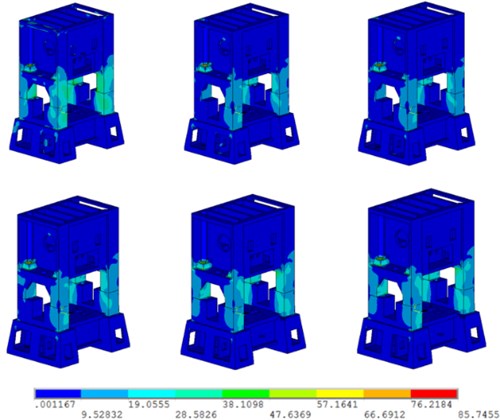
Fig. 12Positions where strain foils are fixed
Meanwhile, whether the value of 1.89 times nominal pressure is the optimal preload will be verified in the static loading experiment. First, set two variables, one is the preload which is simulated by the hydraulic loading device. The other is the static load which is simulated by the hydraulic jack which is applied on the upper slider and the worktable of the press. The preload and the static load are both divided into four levels.
The experiment can be conducted through the following procedures:
(1) Before the experiment, it is necessary to prevent the interference sources as far as possible. And then check the measuring system and zero them.
(2) Measure strain for 10 seconds by five strain foils when there is no static load and the preload of each tie-bolts is 50 t (the total preload of the four tie-bolts is 1.6 times of nominal pressure).
(3) Keep the preload constant, then measure strain for 10 seconds by five strain foils when the static load is 56.5 t. In the same way, measure signals for 10 seconds when the static load is 79.1 t, 101.7 t and 124.3 t (equal to the nominal pressure), respectively.
(4) Unload the static load when all the procedures above have been done. Repeat the procedure (3) with the preload of 59.38 t (1.9 times), 68.75 t (2.2 times) and 78.13 t (2.5 times), respectively.
(5) Check and save the experiment data when all the procedures above have been completed.
5.1.2. Dynamic loading experimental procedure
5.1.2.1. Mode experiment
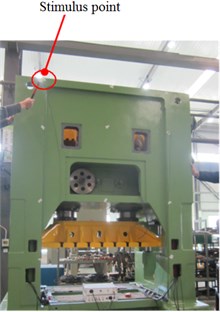
Corresponding to the modal analysis derived by the simulation method, the experimental validation is conducted with the single-point excitation technique [14]. The stimulus signal and response signal of the press bed can be obtained by force sensor and acceleration sensor, respectively. So 48 points are selected to establish the frame model of the press bed. The distribution of the selected points in the front side of the press bed and the press bed frame model are shown in Fig. 13. The stimulus point is on the top-left of the press, which is shown in Fig. 14.
Fig. 13Distribution of the selected points in the front side of the press bed and the press bed frame
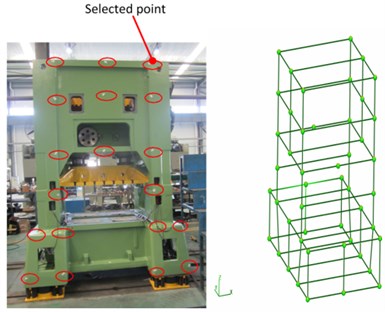
Fig. 14Stimulus point
The experiment can be conducted through the following procedures:
(1) Before the experiment, it is necessary to prevent the interference as far as possible. And then check the measuring system and zero them.
(2) Install an acceleration senor at the selected point of the press. Knock the stimulus point along axis with the same force twice, and then save the data.
(3) Install an acceleration senor at the remaining selected points in turn. And repeat the operation which is shown in Eq. (1).
(4) After that all the experiments have been completed along the axis, the experiments along the axis and axis are conducted in the same way.
(5) Check and save the experiment data after all the procedures above have been completed.
5.1.2.2. Dynamic pile-driving experiment
Dynamic pile-driving experiment should be conducted to verify the strength of the press bed with the piling force. The deformations of the left rod of the beam, the strut of the base and the tie-bolt whose deformation and stress are highest in the transient response analysis are measured by the strain foils.
As seen from Fig. 15, strain data were gathered as follows. First, stick strain foils whose resistance can change with the deformation of the press on the pre-selected positions with half-bridge method. The output ends of strain foils are connected with the wireless strain gauge. The type of the strain foils is FR-1B12L30W05MS with the coefficient of 1.9-2.1. The resistance of the strain foils could be collected by the wireless resistance strain gauge and then be converted to strain signals of the press. The type of the wireless strain gauge is SG402-EX with a strong noise reduction function and its measurement accuracy is 0.1 % red ±2 με. It can convert analog signals to digital signals, eliminate high level noise in strain signals and convert strain signals into digital signals. Then, strain signals are transferred to the wireless gateway which is connected with the computer through LAN. Finally, the data are gathered and saved in the computer.
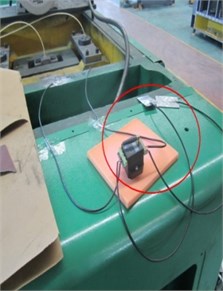
Fig. 16 shows installations of strain foils and wireless strain gauge on the beam of the press.
Fig. 15The strain data collection procedure
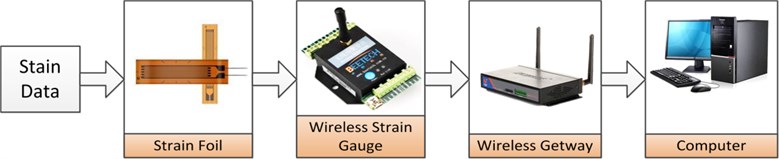
Fig. 16Installations of strain foils and wireless strain gauges
The piling force would be set according to the height of the die-filling in the experiment, because it is changed with the height of the die-filling. Comparing with the static loading experiment, a new variable that the piling frequency is introduced. The piling frequency of this kind of press is 160-500 times per minute. Besides, in order to develop the impaction law of three variables to the press, we divide the preload into two levels, the piling force into four levels and the piling frequency into five levels. Then:
(1) Before the experiment, it is necessary to prevent the interference as far as possible, check the measuring system and zero them.
(2) Set the preload of each tie-bolt at 62.5 t (total force is 2 times of the nominal force).
(3) Set the piling force at 50 t.
(4) Measure the signal by sensors located on different positions for 1 minute when the piling frequency is 150 200, 250, 300 and 330 times per minute, respectively.
(5) Set the piling force at 75 t, 100 t, and 125 t, respectively. Repeat procedure 4).
(6) Set the preload of each tie-bolt at 78.13 t (total force is 2.5 times of the nominal force), and repeat procedure (3), (4) and (5).
(7) Check and save the experiment data after all the procedures above have been completed.
5.2. Data processing
5.2.1. Processing of the static loading experiment data
5.2.1.1. Relative stiffness
Table 4 shows strains of four tie-bolts and worktable in the static loading experiment.
Each tie-bolt is 1640 mm in length and worktable is 1300 mm, so the deformation caused by the static load can be obtained with the following formula:
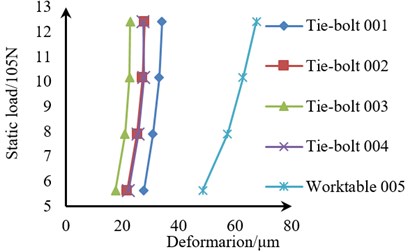
where is the deformation of the selected position caused by the static load; is the length of the tie-bolt or the worktable; is the strain of the tie-bolt or the worktable under the preload only; is the strain of the tie-bolt under the preload and static load; Then the static load-deformation diagram of the worktable and four tie-bolts under different preload times can be obtained and shown in Fig. 17.
Table 4Strains in the static loading experiment under different preload times (με)
Preload Times | Position | Static Load / t | ||||
0 | 56.5 | 79.1 | 101.7 | 124.3 | ||
1.6 | Tie-bolt 001 | 248.84 | 265.71 | 267.68 | 269.04 | 269.63 |
Tie-bolt 002 | 256.95 | 270.22 | 272.36 | 273.51 | 273.93 | |
Tie-bolt 003 | 293.09 | 303.83 | 305.86 | 306.89 | 307.04 | |
Tie-bolt 004 | 225.99 | 239.57 | 241.63 | 242.85 | 242.68 | |
Worktable 005 | 15.67 | –9.47 | –14.03 | –16.85 | –19.34 | |
1.9 | Tie-bolt 001 | 296.22 | 313.59 | 315.72 | 317.35 | 317.56 |
Tie-bolt 002 | 302.40 | 320.05 | 322.60 | 323.91 | 324.13 | |
Tie-bolt 003 | 339.62 | 353.46 | 354.59 | 355.92 | 357.25 | |
Tie-bolt 004 | 225.99 | 239.57 | 241.63 | 242.85 | 242.68 | |
Worktable 005 | 16.96 | –7.55 | –12.92 | –15.48 | –18.04 | |
2.2 | Tie-bolt 001 | 351.68 | 367.06 | 369.85 | 371.10 | 371.12 |
Tie-bolt 002 | 361.61 | 373.25 | 376.45 | 377.51 | 378.18 | |
Tie-bolt 003 | 396.17 | 406.87 | 408.61 | 409.73 | 410.53 | |
Tie-bolt 004 | 324.97 | 336.35 | 338.60 | 339.54 | 340.306 | |
Worktable 005 | 18.39 | –6.86 | –12.40 | –15.47 | –17.82 | |
2.5 | Tie-bolt 001 | 399.06 | 419.26 | 427.79 | 433.27 | 439.26 |
Tie-bolt 002 | 407.06 | 423.98 | 431.17 | 436.15 | 441.15 | |
Tie-bolt 003 | 442.70 | 458.22 | 465.40 | 469.94 | 474.81 | |
Tie-bolt 004 | 360.80 | 379.00 | 386.99 | 391.57 | 396.54 | |
Worktable 005 | 20.84 | –9.71 | –23.37 | –31.89 | –39.72 | |
Then the data above are fitted for straight lines. The slopes of the fitting lines are approximate to the relative static stiffness of the tie-bolt and the worktable under different preload times. Relative static stiffness is shown in Table 5.
Table 5Relative static stiffness of each tie-bolt under different preload times
Position | Preload | |||
1.6 times | 1.9 times | 2.2 times | 2.5 times | |
Tie-bolt 001 | 94063N/μm | 87048 N/μm | 78534 N/μm | 19692 N/μm |
Tie-bolt 002 | 96358 N/μm | 83724 N/μm | 72035 N/μm | 22856 N/μm |
Tie-bolt 003 | 105656 N/μm | 102331 N/μm | 104453 N/μm | 23701 N/μm |
Tie-bolt 004 | 100694 N/μm | 93267 N/μm | 94655 N/μm | 22368 N/μm |
Worktable 005 | 34096 N/μm | 31889 N/μm | 30149 N/μm | 11245 N/μm |
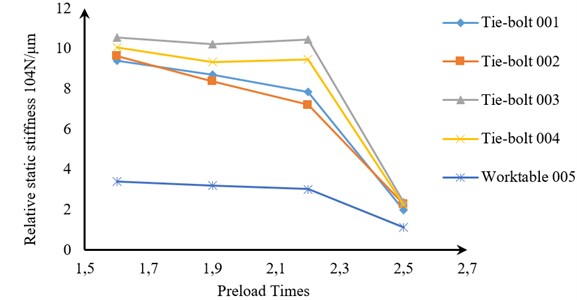
Fig. 18 shows the relationship between the preload times and the relative static stiffness of the worktable and tie-bolts.
5.2.1.2. Real preload of the press
Considering the effect of errors, the real preload times are estimated according to the deformation of the tie-bolts. The formula is:
where is the elastic modulus of the tie-bolt, which is equal to 210 GPa; is the mean strain of the tie-bolt; is the cross-sectional area of the tie-bolts; is the preload of the tie-bolts; is the nominal pressure of the press; is the preload times of the press.
Fig. 17Static load-deformation diagrams of the tie-bolts and the four tie-bolts under different preload times
a) Under 1.6 times preload
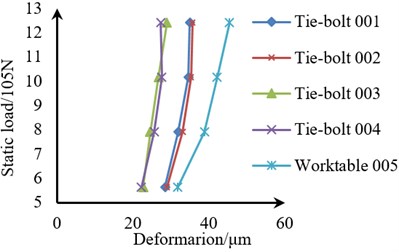
b) Under 1.9 times preload
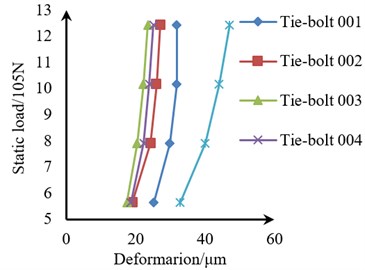
c) Under 2.2times preload
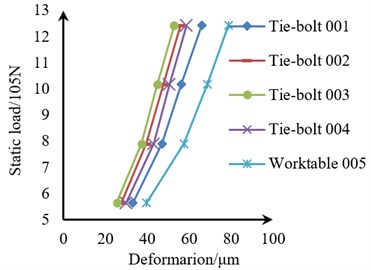
d) Under 2.5 times preload
The diameter of the tie-bolt is 10 cm and the real preloads when there is no static load are shown in Table 6.
Table 6The real preload times of the tie-bolts when there is no static load
Preset preload times | Mean strain of tie-bolts / με | Preload of tie-bolts / KN | Real preload times |
1.60 | 256.22 | 422.37 | 1.35 |
1.90 | 307.10 | 506.25 | 1.62 |
2.20 | 358.61 | 591.17 | 1.89 |
2.50 | 402.40 | 663.36 | 2.12 |
As seen from Fig. 18, the relative static stiffness of the worktable and tie-bolts decreases with the increase of the preload times. When the preload times is less than 2.2, the decline tendency is quite slow; when the preload times is within 2.2 to 2.5, it declines rapidly. Therefore, when the real preload times increases from 1.35 to 1.89, the relative static stiffness of the press would decrease slowly. While from 1.89 to 2.12, the relative static stiffness would decrease rapidly. So the 1.89 times of the nominal force can be regard as the optimal preload value.
Fig. 18Relationship between the preload times and the relative static stiffness
5.2.1.3. Results comparison
We take the deformation data which are obtained by the simulation and experiment when the press is under both the 1.89 times preload and nominal pressure to conduct comparison. The deformation of the tie-bolts caused by both preload and nominal pressure in the experiment can be obtained by the following formula:
where is the deformation of the tie-bolts caused by both preload and nominal pressure.
The results are shown in Table 7.
As can be seen from Table 7, deformation obtained by the simulation is almost equal to that by the experiment. Therefore, the finite element model is rational in static loading condition.
Table 7Deformation obtained by simulation and experiment under preload and nominal force
Position | Deformation by the simulation (μm) | Deformation by the experiment / μm | Relative error |
Tie-bolts 001 | 25.8 | 31.8 | 18.87 % |
Tie-bolts 002 | 25.8 | 27.2 | 5.15 % |
Tie-bolts 003 | 25.8 | 23.6 | 9.32 % |
Tie-bolts 004 | 25.8 | 25.2 | 2.38 % |
Worktable 005 | 55.6 | 47.1 | 18 % |
5.2.2. Processing of the dynamic loading experiment data
5.2.2.1. Vibration mode experiment data
5.2.2.1.1. Vibration mode and frequency
For the same reason in the modal analysis in Section 3, only the first three order of the vibration mode experiment data are collected in modal experiment. Through analysis, the result is shown in Table 8.
Table 8The first three levels of vibration mode experiment data
Order of vibration mode | Natural frequency / Hz | Description of vibration mode |
1 | 50.04 | Vibration along axis of the press bed |
2 | 57.15 | Vibration along axis of the press bed |
3 | 97.51 | Rotation around axis of the press bed |
5.2.2.1.2. Results comparing
Table 9 shows the vibration mode comparison.
From Table 9, the error of natural frequency is within 12.8 % which can be explained by that the parameters of the contact surface between preset values and real values are different in some degrees. Therefore, the finite element model is rational in this section.
Table 9Vibration mode comparison
Order of vibration mode | Vibration mode | Result of simulation | Result of experiment | Relative error |
1 | Frequency / Hz | 52.41 | 50.04 | 4.70 % |
Description | Vibration along axis | Vibration along axis | ||
2 | Frequency / Hz | 55.19 | 57.15 | 3.40 % |
Description | Vibration along axis | Vibration along axis | ||
3 | Frequency /Hz | 85.01 | 97.51 | 12.80 % |
Description | Rotation around axis | Rotation around axis |
5.2.2.2. Pile-driving experiment data
Preload times, piling frequency and piling force are three variables in the pile-driving experiment, so we get 40 kinds of result. Here, we take 4 typical kinds of the result to analyze.
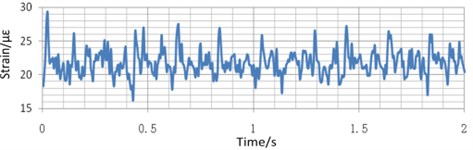
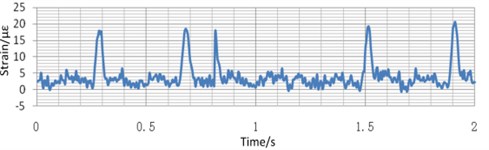
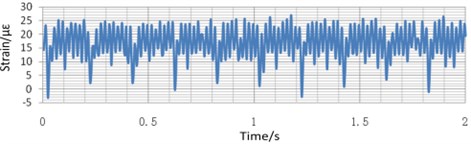
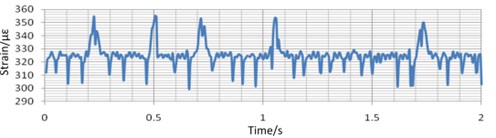
Fig. 19(a) shows the strain of the beam when the piling frequency is set at 300 times/min, the piling force is set at 100 t, and the total preload is 2 times and 2.5 times of the nominal force. Fig. 19(b) shows the strain of the beam when the piling frequency is set at 300 times/min, the piling force is set at 50 t, and the total preload is 2 times of the nominal force. Fig. 19(c) shows the strain of the beam when the piling frequency is set at 150 times/min, the piling force is set at 100 t, and the total preload is 2 times of the nominal force. Fig. 20 and Fig. 21 shows the strain of the base and the tie-bolts with the same variable value to Fig. 19.
Fig. 19Strain of the beam under different variable values
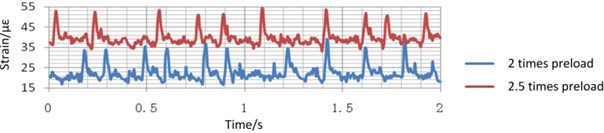
a) 300 times/min piling frequency, 100 t piling force, 2 times and 2.5 times preload
b) Piling force changes to 50 t
c) Piling frequency changes 150 times/min
Take the strain of the beam under different variable values as an example. As is shown in Fig. 20(a), when only the preload times changes, the strain equilibrium positions of the measured points change obviously, but the amplitude of the strain is almost unchanged. Comparing the blue curve in Fig. 20(a) with the one Fig. 20(b), when only the piling force changes, the equilibrium position of the strain is almost unchanged, but the amplitude of the strain increases with the decrease of the piling force obviously. Comparing the blue curve in Fig. 20(a) with the one in Fig. 20(c), when the only piling frequency changes, the equilibrium position of the deformation changes obviously, but the amplitude of the strain is almost unchanged. Fig. 21 and Fig. 22 shows the same tendency of the strain of the base and the tie-bolt. Therefore, during the real blanking process, the piling force has a great influence on the strain of the bed.
Fig. 20Strain of the base under different variable values
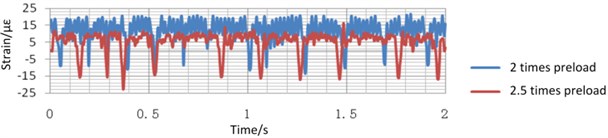
a) 300 times/min piling frequency, 100 t piling force, 2 times and 2.5 times preload
b) Piling force changes to 50 t
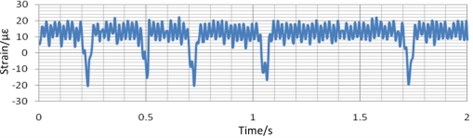
c) Piling frequency changes 150 times/min
Fig. 21Strain of the tie-bolt under different variable values
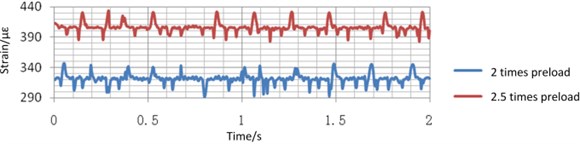
a) 300 times/min piling frequency, 100 t piling force, 2 times and 2.5 times preload
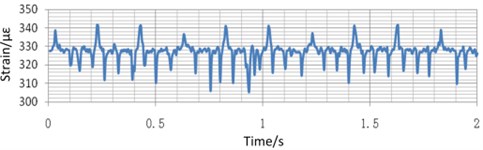
b) Piling force changes to 50 t
c) Piling frequency changes 150 times/min
What’ more, from Fig. 21, the strain of the tie-bolts is obvious and it meets with the cyclic stress-strain curve. So it should be verified. The maximum strain of tie-bolts is 440×10-6, the stress is equal to multiply by , that is 92.4 MPa. As for tie-bolts whose material is 45 steel (ASTM), its allowable fatigue limit under the tensile deformation is equal to 0.3 multiply by , that is 200 MPa. Therefore, design of tie-bolts is rational under alternating loads.
6. Conclusions
Considering too much disadvantages brought by the analogical and empirical design method, this paper proposed a simulation model which could be used to perform the optimization design of the press. Meanwhile, a series of static and dynamic experiments were conducted to verify the simulation mode. It is concluded that:
1) A three-dimensional solid model of J76-125 high-speed press bed is established in CATIA. And then the model is imported into an ANSYS environment to build the finite element model of the press bed.
2) The static simulation analysis shows that under the only preload the tie-bolts bear tensile stress which is concentrated on the contact area with the nuts and the maximum value is 206.77 MPa. The deformation of the worktable is homogeneous and the maximum value is 3.29×10⁻³ mm. Under the combination of the preload and nominal force, the maximum stress of the tie-bolts is 319.109 MPa. The deformation of the middle part of the worktable is larger than the two ends, and the maximum deformation is –5.56×10⁻²mm. They are all acceptable by comparison with the design requirements. When performing the static loading experiment, the 1.89 times of the nominal force is turned out to be the optimal preload value. Through comparison, the deformation obtained by the simulation method is almost equal to that by the experiment method.
3) Through comparison, the relative error of the natural frequency is within 12.8 %. In other words, the simulation model is rational and can be used to do optimization design.
4) Through the transient response analysis, deformation of the left rods of the beam is seen obviously, stress of the struts and tie-bolts are quite large. In the pile-driving experiment, the strain tendency of these three positions is obtained: during the real blanking process, the piling force has a great influence on the strain of the bed. Besides, the maximum strain of the tie-bolts is 4.40×10⁻⁶ and the maximum stress of the tie-bolts is 92.4 MPa, which all meet the design requirements.
References
-
Shengdun Z., Xuelai Z., Changyu G. Current condition and its development trend of high-speed press. Forging Equipment and Manufacturing Technology, Vol. 40, Issue 1, 2005, p. 19-24.
-
Zufang Z. Finite Element Method Analysis and Optimum Design for Frame of Open-back Press. Nanjing, 2004.
-
Chuang M. Analysis and Optimization of Toggle CNC Punch. Nanjing, 2007.
-
Kangkang Q. Finite Element Method Analysis and Optimum Design for Frame of JG21-250A Press. Shandong, 2008.
-
Guofa L., Xingping Z., Chuanhai C. Load analysis and life prediction of key components of high-speed press based on virtual prototyping. Journal of Vibroengineering, Vol. 17, Issue 4, 2015, p. 1769-1782.
-
Bocharow Y. A., Vasow A. V. Computer aided analysis of screw press dynamic. International Journal of Machine Tools and Manufacture, Vol. 27, Issue 2, 1987, p. 23-25.
-
Weiqian Q., Shuanhu W., Deqian X. Dynamic simulation analysis of high-speed punch actuator based on Adams and analysis. Forging Technologies, Vol. 36, Issue 6, 2011, p. 159-162.
-
Wirley A., Valentim B., Juliana A. Effect of unilateral misfit on preload of retention screws of implant-supported prostheses submitted to mechanical cycling. Journal of Prosthodontic Research, Vol. 55, Issue 1, 2011, p. 12-18.
-
Ping Z. Finite Element Method Analysis and Optimum Design of New Type Press. Nanjing, 2007.
-
Baojun S., Xiangjun F. Finite element method analysis and structure optimization of JB21-160 C-frame stamping press. Forging Machine, Vol. 34, Issue 1, 1993, p. 7-10.
-
Weiliang S., Jinghua X., Rui L. Dynamic response analysis of high-speed press frame. Manufacturing Technology and Machine Tool, Vol. 55, Issue 10, 2005, p. 40-43.
-
Demir Cihan, Alapan Yunus Modeling and dynamic response analysis of a point supported plate by using ANSYS and MATLAB. Advanced Materials Research, Vol. 445, Issue 1, 2012, p. 1088-1093.
-
Rodriguez O., Medina A. Efficient methodology for the transient and periodic steady-state analysis of the synchronous machine using a phase coordinates model. IEEE Transactions on Energy Conversion, Vol. 19, Issue 2, 2004, p. 464-466.
-
Ahmadik Ahm Adian H. Modelling machine tool dynamics using a distributed parameter tool-holder joint interface. International Journal of Machine Tools and Manufacture, Vol. 47, Issue 12, 2007, p. 1916-1928.
Cited by
About this article

Our deepest gratitude goes first to the editors and reviewers for their constructive suggestions on the paper. And thank the authors of this paper’s references whose work have contributed greatly to the completion of this thesis. Second, we would like to thank the Important National Science and Technology Specific Projects of China (2014ZX04014-011), National Natural Science Foundation-Youth Foundation (51505186), China Postdoctoral Science Foundation (No. 2015M580245), Science Research Plan of Jilin Province ([2015]472) and Special Industrial Base Construction Projects of Science and Technology Development Plan of Jilin Province (20130302009GX).
Guofa Li conceived the idea of using ANSYS to form the static and dynamic finete element simulation model and designed the study; Jian Wang and Chuanhai Chen conducted the majority of the experimental work and discussed the results; Hailong Tian and Chuanyang Zhou wrote the manuscript; Fan Xu analyzed the experimental data; Xiaohui Shi edited the manuscript and checked grammatical and spelling errors.
