Abstract
This research has experimentally investigated on the influence on modal parameters of thin cylindrical shell coated with constrained layer damping (CLD). Firstly, based on vibration behavior of thin walled shell structure, an experiment system is established to measure modal parameters of the shell with high accuracy and efficiency, and the corresponding test methods and identification techniques which are suitable for the shell coated with CLD are proposed. Then, the shell is coated with different numbers and sizes of CLD pieces or in different coating positions of CLD rings, and modal parameters are obtained by the proposed test method. Finally, based on the accurate measured data, the influence on natural frequencies, mode shapes and damping ratios of TCS coated with CLD are analyzed and discussed in details. This research can provide technical support for CLD application on thin walled shell structure.
1. Introduction
Thin cylindrical shell (TCS) has long been an important structural component due to its high stiffness to weight and strength to weight ratios, which is widely used in the engineering fields, such as aircraft casings, pipes and ducts, rotary drums in granulator and aircraft engine [1-4]. Modal parameters of TCS are mainly composed of natural frequencies, mode shapes and damping ratio, these parameters are the basis of further study on vibration characteristics of TCS [5, 6], which are of great importance to theoretical modeling, response prediction, vibration reduction optimization, vibration mechanism research, structural damage identification and etc. In recent years, due to continuous reduced costs and more mature technologies of constrained layer damping (CLD), it has drawn increasingly academic and engineering attention. Usually this damping material is coated on the surface of TCS, through the viscous shear deformation controlled by the constraint layer, the structural vibration energy is transformed into strain energy which will be dissipated finally in the form of heat energy [7, 8], so that the effect of restraining and reducing vibration of TCS can be realized.
At present, great efforts have been made to study vibration character of TCS coated with CLD, including the corresponding modeling and analysis techniques, anti-vibration design and evaluation methods and etc. For example, Pan [9] investigated the vibration of a finite-length cylindrical shell coated with CLD, and derived the partial differential equation of motion by expressing the viscoelastic property of the material in terms of a complex shear modulus in 1969. Ramesh and Ganesan [10] obtained natural frequencies and loss factors of cylindrical shells with CLD by finite element method, and the finite element is developed based on a discrete layer theory, and variation of inplane displacements across the thickness and a constant transverse displacement was taken into account. Chen and Huang [11] presented a mathematical model for a cylindrical shell with a partially CLD treatment, and the effects of treatment length, thickness and stiffness of constraining layer and material core thickness of viscoelastic material were discussed. Chen and Huang [12] also studied the influence of the fixed sizes of CLD number and CLD length on the vibration attenuation of TCS. They found that increasing CLD length can significantly improve structural damping, and increasing CLD number was also helpful for vibration reduction, but when its length exceeded more than 40 % of shell length, the damping effect would diminish. Wang and Chen [13] also used finite element method to analyze the vibration and damping of TCS with a partially CLD, they discovered that the orthotropic cylindrical shell with larger treatment area or with thicker damping layer cannot always have better damping properties than those with smaller treatment or with thinner damping layer. In order to obtain good damping effect, the material properties, shell geometries, treatment thickness, treatment area and locations, as well as boundary conditions must be considered. Zheng et al. [14] studied the layout optimization of TCS coated with CLD under simply supported conditions and discussed the influences of position and number of coated CLD. It is believed that CLD patches with large ratio of axial length to angular length can produce better damping effects, and the degree of vibration attenuation of the shell increased with the increase of the total amount of CLD materials. Wang and Fang [15] used the spectrum transfer matrix method to calculate coupled vibration of cylindrical shells treated with active constrained layer damping (ACLD), which is contributed to reducing the degrees of freedom and calculated time. However, the studied object is relatively simple and it is limited to the discussion of axis symmetry model. Li et al. [16] obtained natural frequencies, loss factors and curves of frequency response of a CLD cylindrical shell by distributed parameter transfer function method, which had better accuracy and adaptability of boundary conditions as well as geometrical parameter, and considering the frequency-depended shear modulus of viscoelastic material in damping layer. Xiang et al. [17] proposed a matrix method with high efficiency and precision for analyzing vibration of TCS with partially CLD treatment, which can be written in a matrix differential equation of first order and be derived by considering the energy dissipation due to the shear deformation of the viscoelastic layer and the interaction between all layers. Mohammadi and Sedaghati [18] used semi-analytical finite element method to study linear and nonlinear vibration of sandwich cylindrical shell with CLD, and the effect of geometric nonlinearity due to the large deformation of the shell was considered.
However, most of researches done by the above scholars and researchers are mainly based on theory or simulation, and the calculated influence factors as well as conclusions on the thickness of CLD, anti-vibration position and other coating parameters are mainly based on simplified model and theoretical boundary conditions, experimental studies on the influence on modal parameters of TCS coated with CLD are still scarce. And as a lack of the related test conclusion, theoretical analysis results of the shell cannot be effectively verified, let alone validate some advanced composite shell theories. In order to meet the needs of engineering applications of such damping material, it is necessary to adopt some experimental techniques to study the influences of varied CLD parameters on vibration characteristics of TCS.
This research has experimentally investigated on the influence on modal parameters of TCS coated with CLD. Firstly, based on vibration behavior of thin walled shell structure, an experiment system is established to measure modal parameters of the shell with high accuracy and efficiency, and the corresponding test methods and identification techniques which are suitable for the shell coated with CLD are also proposed in Section 2. Then we coat the shell with different numbers and sizes of CLD pieces or in different coating positions of CLD rings in Section 3, and the natural frequency, damping and mode shape results are obtained by the proposed test method. Finally, in Section 4, based on the accurate measured data, the influence on natural frequencies, mode shapes and damping ratios of TCS coated with CLD are analyzed and discussed in details. This research can provide services for objectively evaluating the effect of suppressing vibration of TCS coated with CLD, provide experimental data for effective selection of such damping material, and also provide technical support for damping application on thin walled shell structure.
2. Test system and method of modal parameters of TCS coated with constrained layer damping
In this section, based on vibration behavior of thin walled shell structure, an experiment system is firstly established to measure modal parameters of the shell with high accuracy and efficiency, and the corresponding test methods and identification techniques which are suitable for the shell coated with CLD are also proposed.
2.1. Test system of modal parameters of TCS coated with CLD
The TCS studied in this paper is shown in Fig. 1, its material is structural steel with elastic modulus of 212 GPa, Poisson’s ratio of 0.3, and the density of 7850 kg/m3. Its length is 70 mm with external radius of 144 mm and an average thickness of 2 mm. There is the extension edge with 150 mm external radius and 3 mm thickness on this shell which is machined to be clamped by a clamping-ring with eight M8 bolts, so that it can be of certain that the shell be in cantilever boundary condition. Firstly, CLD material named as SOUNDFOIL 5D2 is made into different pieces and rings, as seen in Fig. 1, whose material and thickness parameters are shown in Table 1. Then, we can coat these CLD pieces and CLD rings on the outside surface of the shell by double-sided adhesive, and measure modal parameters of the shell coated with or without CLD based on the established test system with high accuracy and efficiency, whose functions and features will be described in the following.
Fig. 1TCS coated with and without constrained layer damping
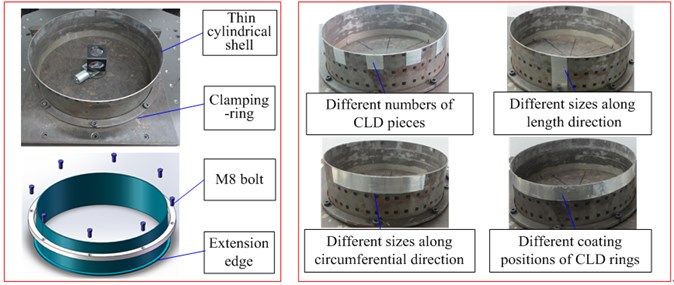
Table 1Material parameters of CLD (22°testing result)
Name | Thickness (mm) | Young’s modulus (MPa) | Poisson ratio | Density (kg/m3) |
The viscoelastic layer | 0.13 | 12 | 0.495 | 1200 |
The constraint layer | 0.13 | 7×10⁴ | 0.3 | 2700 |
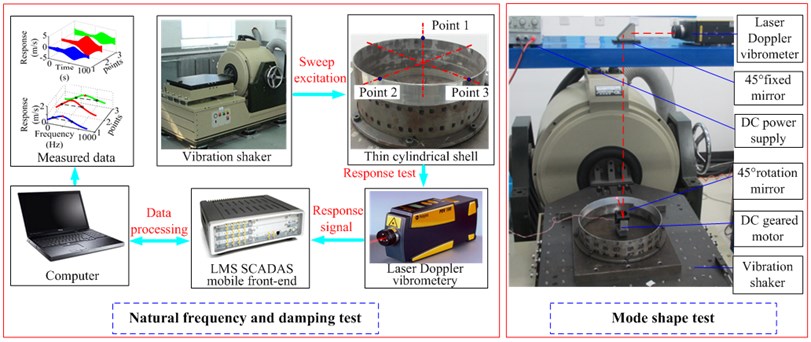
On the one hand, due to light weight, closed modes, low level and complicated local vibration of TCS, traditional accelerometer will bring added mass and stiffness to the tested shell, which will severely affect the tested frequency and damping results, so laser Doppler vibrometer is used as non-contact response sensor to measure the vibration and frequency information of the shell. On the other hand, different excitation techniques also will result in test errors, so the disadvantages of four common vibration excitation devices are compared in Table 2, and vibration shaker is finally chosen as excitation source with excitation level being precisely controlled, and test system of modal parameters of TCS coated with CLD is given in Fig. 2. Once the test system is set up, we can accurately measure modal parameters of the shell with and without CLD by the corresponding test method, which will be described in next section.
The instruments used in the test system are as follow: (I) Polytec PDV-100 laser Doppler vibrometer; (II) King-design EM-1000F vibration shaker systems; (III) LongWei PS-305DM DC power supply; (IV) Aslong JGA25 DC geared motor; (V) 45° rotation mirror and 45° fixed mirror; (VI) LMS SCADAS Mobile Front-End and Dell notebook computer. In these devices, LMS SCADAS Mobile Front-End and Dell notebook computer are responsible for recording and saving response signal from laser Doppler vibrometer. Dell notebook computer with Intel Core i7 2.93 GHz processor and 4G RAM is used to operate LMS Test.Lab 12A software and store measured data.
Table 2The disadvantages of different vibration excitation devices for modal test of TCS coated with CLD
Excitation device | Modal parameters of TCS | Disadvantage | ||
Natural frequency | Mode shape | Damping ratio | ||
Hammer | √ | √ | × | Pulse excitation level cannot be precisely controlled and the excitation force varies for each measurement, and double hit can often lead to test errors |
Electromagnetic exciter | × | × | × | The related force sensor will bring added mass and stiffness to TCS, which will severely affect test results of damping and natural frequency |
Piezoelectric ceramic exciter | √ | √ | × | The excitation energy of piezoelectric ceramic exciter is often insufficient for TCS, which will result in poor response signal with low level of signal noise ratio. |
Vibration shaker | √ | √ | √ | Excitation frequencies are not that high, which are often limited to 1 Hz-3000 Hz, and the test procedures are often complicated |
Fig. 2Schematic of test system of modal parameters of TCS coated with CLD
2.2. Test method of modal parameters of TCS
In this section, some test methods of modal parameters and the related identification techniques which are suitable for TCS coated with CLD are proposed. For the frequency and damping test, sine sweep excitation is conducted with a closed loop control via accelerometer on the countertop of the vibration shaker, and point1, point 2 and point 3 (being 180° with each other) in the internal wall of the shell, as seen in being Fig. 2, are used to get response signal by adjusting laser point and average is used as the final results. Then, natural frequencies of the tested shell can be precisely determined through each resonant peak in frequency domain, and damping ratio can also be identified by the half-power bandwidth method which is calculated by measuring the bandwidth of the frequency curve (or approximately 3 dB) down from the resonant peak. For mode shape test, laser rotating scanning technique is used to get shape results of TCS. Firstly, employ one of natural frequencies of TCS to drive the tested shell under the resonance state by vibration shaker, and then DC power supply is used to provide stable voltage and current for DC geared motor, and the motor is to drive the 45° rotation mirror to complete a set of cross sectional scan with 360° circumferential coverage for the tested shell, and in this way mode shapes data at certain mode can be obtained in a shorter amount of time than traditional test methods.
In the actual test, we firstly measure modal parameters of TCS without CLD under fixed constraint boundary. Then, we divide the CLD into different pieces and rings, and under the same boundary condition, we can finish the test work of the shell coated with different numbers and sizes of CLD pieces or in different coating positions of CLD rings by the same test methods, which can be described in the following five key steps.
2.2.1. Accurately determine tightening torque of the shell in the pre-experiment
Because modal parameters of TCS are closely related to constraint boundary, in actual test, we must ensure that one end of the tested shell be effectively clamped, to this end, a torque wrench is used to determine the level of tightening torque on the M8 bolts of clamping-ring, as seen in Fig. 1, and the “pre-experiment” is adopted to determine the required tightening torque as well as to verify whether or not the tested shell is under fixed constraint boundary. For instance, it should be done at least three times to test natural frequencies, and every time the same level of torque value should be applied on M8 bolts. If test results of the first 3 natural frequencies under three pre-experiments are close to each other (for example 1-3 Hz), we will regard this torque value as the determined tightening torque under fixed constraint boundary. If the differences between each natural frequency are big, more than 5-20 Hz, we need to increase torque value and to repeat pre-experiments several times.
2.2.2. Measure modal parameters of TCS without CLD under fixed constraint boundary
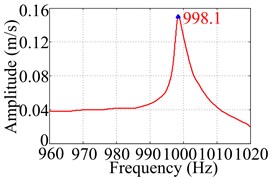
This step involves three different measurements and identification techniques. Firstly, using sine sweep excitation by vibration shaker to test natural frequencies of TCS, and in order to get precise frequency results, the small-segment FFT processing technique is employed to deal with the measured sweep signal. The time domain signal involving the 4th natural frequency of the tested shell is showed in Fig. 3(a). If FFT processing technique is directly applied on this sweep signal, we can obtain its frequency spectrum, as seen in Fig. 3(b), and the frequency of the response peak is 998.8 Hz. However, if the whole time of sweep signal can be divided into mall segments, and we conduct FFT on each segment of them (in this example, it is 1 s with respect to the whole time of 67 s), the resulting frequency spectrum, as seen in Fig. 3(c), are plotted through the combination of the response peak of each segment (also treated with interpolation and smoothing), the frequency value related to the peak is 998.1 Hz, which is truly accurate result of the 4th natural frequency. Therefore, for time-dependent sweep signal of the shell, it is necessary to use the small-segment FFT processing technique to accurately get frequency results.
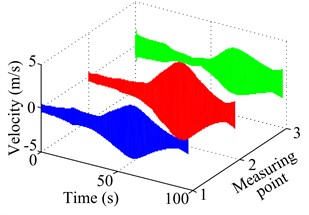
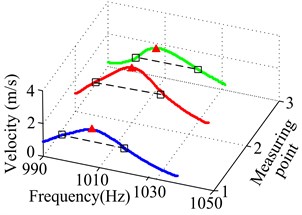
Then, use the half-power bandwidth technique to identify each damping ratio of TCS from the frequency spectrum obtained by small-segment FFT processing technique. Because the resonant peak in the spectrum is already known, we can identify two half-power bandwidth points by measuring the bandwidth of the frequency curve (or approximately 3 dB) down from the resonant peak, consequently according to the damping formula to calculate the corresponding damping results based the MATLAB program. Fig. 4 gives time waveform and frequency spectrum for the fourth natural frequency and damping ratio of TCS at 3 measuring points, and in order to improve accuracy of frequency and damping results, the final results is obtained by averaging the test results at these points.
Finally, use each of natural frequency to excite TCS at resonance state, and gradually obtain each mode shape with obvious reduction in time costs by laser rotating scan method.
Fig. 3The 4th natural frequency of TCS without CLD obtained by different FFT processing techniques
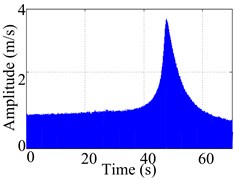
a) The raw sweep signal
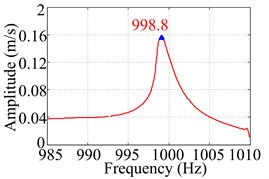
b) The spectrum by Direct FFT
c) The spectrum by small-segment FFT
Fig. 4Time waveform and frequency spectrum for the 4th natural frequency and damping ratio of TCS without CLD at 3 measuring points
a) Time waveform
b) Frequency spectrum
2.2.3. Measure modal parameters of TCS with different numbers of CLD pieces
Firstly, make the damping material into totally 12 CLD pieces with the same sizes of 30 mm×30 mm, and paste different numbers of CLD pieces on the outside surface of the shell according to the sequence of coating 3 pieces, 6 pieces, 9 pieces and 12 pieces, from sequence I to sequence IV as shown in Fig. 5, Then we can use the small-segment FFT processing technique and half-power bandwidth technique to identify natural frequency and damping at the same measuring points which are determined in the previous step. Finally, we can employ laser rotation scanning method to obtain mode shape of TCS with CLD under the same excitation level used in the second step.
Fig. 5Different numbers of CLD pieces and its coating sequence on the TCS
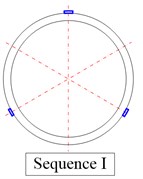
a) 3 pieces
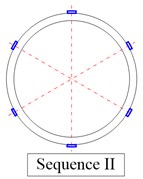
b) 6 pieces
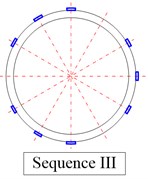
c) 9 pieces
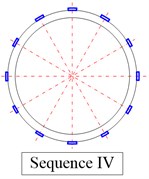
d) 12 pieces
2.2.4. Measure modal parameters of TCS with different sizes of CLD pieces
In this step, the damping material is divided into different sizes and each size must contain three pieces with the same dimension of 23 mm. On the one hand, we make them into the increased sizes along the circumference direction of the shell, according to the sequence of length-width ratio of 1:1, 1:2, 1:3 and 1:6, from sequence I to sequence IV as shown in Fig. 6(a), consequently use the same measurement techniques to obtain the frequency, damping and shape results of TCS with different sizes of CLD pieces along the circumference direction. On the other hand, we make them into the increased sizes along the axis direction of the shell, according to the sequence of length-width ratio of 1:1, 1.5:1, 2:1 and 3:1, from sequence I to sequence IV as shown in Fig. 6(b), and consequently by using the same measurement techniques, we can obtain the resulting modal parameters of TCS with different sizes of CLD pieces along the axis direction.
Fig. 6Different sizes of CLD coated along the circumferential and the axis direction of the shell
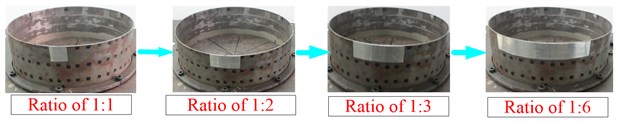
a) Along the circumferential direction
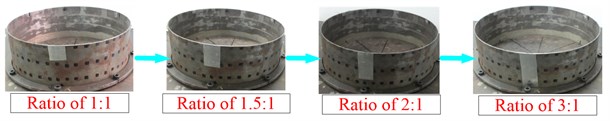
b) Along the axis direction
2.2.5. Measure modal parameters of TCS in different coating positions of CLD rings
In this step, the damping material is firstly made into three different rings with the width of 23 mm, and the length of each ring must cover the whole circumference of the shell. Then, according to the coating positions as shown in Fig. 7, paste these CLD rings on the free end, the middle and the constrained end of the shell. Finally, by using the same measurement techniques, we can obtain the frequency, damping and shape results of TCS in different coating positions of CLD rings.
Fig. 7CLD rings coated in different positions of TCS
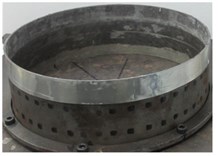
a) On the free end
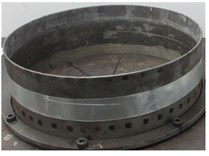
b) On the middle
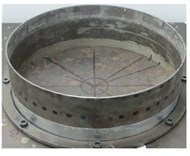
c) On the constrained end
3. Test results of modal parameters of TCS coated with and without CLD
In this section, based on the established experiment system in Section 2.1, natural frequencies, damping ratios and mode shapes of TCS coated with and without CLD are obtained by the proposed test method with high accuracy and efficiency. In the test, point1, point 2 and point 3 are used as the response points, which are 180° with each other and in the same cross section of the shell, the axial distance from this section to free end of TCS is about 3mm, as seen in Fig. 2.
For the natural frequency and damping test, the following set-ups and parameters are chosen: (I) excitation level of 1g; (II) sweep rate of 1 Hz/s; (III) frequency resolution of 0.125 Hz; (IV) hanging window for sweep response signal with upward sweep direction; (V) frequency range of 0-2048 Hz. For the mode shape test, the following set-ups and parameters are chosen: (I) excitation level of 1 g-3 g; (II) frequency resolution of 0.125 Hz; (III) rectangular window for stable response signal; (IV) sampling frequency of 12800 Hz; (V) rotated scan speed of 2 r/min. Besides, the first 8 mode shapes of TCS are obtained in the test, and each mode shape is assembled from two sets of cross sectional scans, one is in the section which includes point1, point 2 and point 3, the other is about 25 mm to the clamped end of the shell (restricted by the height of DC geared motor itself, but do not affect the test results when the number of axial half-waves 1).
3.1. Test results of modal parameters of the shell coated with different numbers of CLD pieces
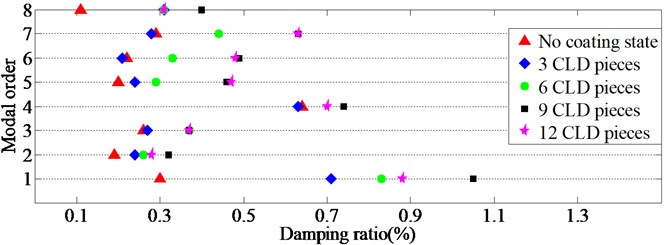
Firstly, according to the test method in Section 2.2, we have checked that the level of torque value on the M8 bolts of clamping-ring should be 40 Nm in the pre-experiment, and consequently we can obtain the resulting frequencies, damping ratios and shapes of the shell coated without CLD under fixed constraint boundary. Then, paste different numbers of CLD pieces on the outside surface of the shell and measure the corresponding frequency, damping and shape results, and according to the sequence of coating 3 pieces, 6 pieces, 9 pieces and 12 pieces, from sequence I to sequence IV as shown in Fig. 5, we can obtain the measured results in Table 3, Table 4 and Table 5. It should be noted that the above results are also compared with the ones without CLD, where represents the number of axial half-waves and represents the number of circumferential waves of TCS. Besides, in order to clearly describe the effect degree and trend of the shell coated with different numbers of CLD pieces, the scattergrams of natural frequencies and damping ratios are also given, as shown in Fig. 8 and Fig. 9.
Table 3The measured natural frequencies of TCS coated with different numbers of CLD pieces
Modal order | No coating state (Hz) | 3 CLD pieces (Hz) | Effect degree (%) | 6 CLD pieces (Hz) | Effect degree (%) | 9 CLD pieces (Hz) | Effect degree (%) | 12 CLD pieces (Hz) | Effect degree (%) |
1 | 858.2 | 844.9 | –1.5 | 839.2 | –2.2 | 837.8 | –2.4 | 837.0 | –2.5 |
2 | 878.9 | 871.7 | –0.8 | 867.1 | –1.3 | 865.9 | –1.5 | 864.1 | –1.7 |
3 | 938.4 | 933.3 | –0.5 | 926.9 | –1.2 | 926.5 | –1.3 | 925.2 | –1.4 |
4 | 998.1 | 994.9 | –0.3 | 988.9 | –0.9 | 984.7 | –1.3 | 984.0 | –1.4 |
5 | 1050.2 | 1048.8 | –0.1 | 1044.1 | –0.6 | 1038.3 | –1.1 | 1037.8 | –1.2 |
6 | 1297.2 | 1294.6 | –0.2 | 1289.7 | –0.6 | 1285.8 | –0.9 | 1284.1 | –1.0 |
7 | 1607.2 | 1606.1 | –0.1 | 1603.1 | –0.3 | 1594.5 | –0.8 | 1593.0 | –0.9 |
8 | 1988.5 | 1986.2 | –0.1 | 1979.8 | –0.4 | 1977.8 | –0.5 | 1978.9 | –0.5 |
Table 4The measured damping ratios of TCS coated with different numbers of CLD pieces
Modal order | No coating state (%) | 3 CLD pieces (%) | Effect degree (%) | 6 CLD pieces (%) | Effect degree (%) | 9 CLD pieces (%) | Effect degree (%) | 12 CLD pieces (%) | Effect degree (%) |
1 | 0.30 | 0.71 | 136.7 | 0.83 | 176.7 | 1.05 | 250.0 | 0.88 | 193.3 |
2 | 0.19 | 0.24 | 26.3 | 0.26 | 36.8 | 0.32 | 68.4 | 0.28 | 47.4 |
3 | 0.26 | 0.27 | 3.8 | 0.37 | 42.3 | 0.37 | 42.3 | 0.37 | 42.3 |
4 | 0.64 | 0.63 | –1.6 | 1.43 | 123.4 | 0.74 | 15.6 | 0.70 | 9.4 |
5 | 0.20 | 0.24 | 20.0 | 0.29 | 45.0 | 0.46 | 130.0 | 0.47 | 135.0 |
6 | 0.22 | 0.21 | –4.5 | 0.33 | 50.0 | 0.49 | 122.7 | 0.48 | 118.2 |
7 | 0.29 | 0.29 | 0 | 0.44 | 51.7 | 0.63 | 117.2 | 0.63 | 117.2 |
8 | 0.11 | 0.31 | 181.8 | 0.31 | 181.8 | 0.40 | 263.6 | 0.31 | 181.8 |
Table 5The measured mode shapes of TCS coated with different numbers of CLD pieces
Modal order | No coating state | 3 CLD pieces | 6 CLD pieces | 9 CLD pieces | 12 CLD pieces |
1 | 1,4 | 1,4 | 1,4 | 1,4 | 1,4 |
2 | 1,5 | 1,5 | 1,5 | 1,5 | 1,5 |
3 | 1,3 | 1,3 | 1,3 | 1,3 | 1,3 |
4 | 1,6 | 1,6 | 1,6 | 1,6 | 1,6 |
5 | 1,7 | 1,7 | 1,7 | 1,7 | 1,7 |
6 | 1,2 | 1,2 | 1,2 | 1,2 | 1,2 |
7 | 1,8 | 1,8 | 1,8 | 1,8 | 1,8 |
8 | 1,9 | 1,9 | 1,9 | 1,9 | 1,9 |
Fig. 8The scattergrams of natural frequencies of TCS coated with different numbers of CLD pieces
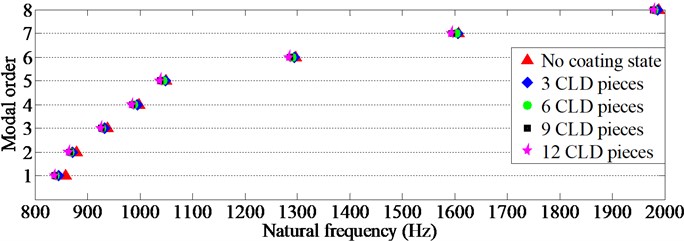
Fig. 9The scattergrams of damping ratios of TCS coated with different numbers of CLD pieces
3.2. Test results of modal parameters of the shell coated with different sizes of CLD pieces
In this section, we firstly make CLD pieces into different sizes, and each size must contain three pieces with the same shape. Secondly, divide them into two different types, i.e., the increased sizes along the circumference direction and the increased sizes along the axis direction, and paste them on the outside surface of the shell so that TCS with different sizes of CLD pieces can be prepared. Thirdly, make these CLD pieces into different length-width ratio, and according to the sequence of length-width ratio of 1:1, 1:2, 1:3 and 1:6, from sequence I to sequence IV as shown in Fig. 6(a), we can finish the test work of the shell coated with 3 CLD pieces (basically being 180° with each other) along the circumference direction. Finally, according to the sequence of length-width ratio of 1:1, 1.5:1, 2:1 and 3:1, from sequence I to sequence IV as shown in Fig. 6(b), we can finish the same test work along of the shell coated with 3 CLD pieces along the axis direction.
Similarly, using the same test method we can obtain modal parameters of the shell coated with and without different sizes of CLD pieces at the same response points, and the measured frequency, damping results of the shell, coated with different sizes of CLD pieces along the circumference direction, are given in Table 6 and Table 7, while the corresponding test results along the axis direction are given in Table 8 and Table 9, and these test results are compared with the ones without CLD. Besides, for the sake of comparison between the two different types of the increased sizes of CLD pieces, the resulting mode shapes are given in the same table, as shown in Table 10.
Table 6The measured natural frequencies of TCS coated with different sizes of CLD along the circumferential direction
Modal order | No coating state (Hz) | Ratio of 1:1 (Hz) | Effect degree (%) | Ratio of 1:2 (Hz) | Effect degree (%) | Ratio of 1:3 (Hz) | Effect degree (%) | Ratio of 1:6 (Hz) | Effect degree (%) |
1 | 858.2 | 844.9 | –1.5 | 842.7 | –1.8 | 843.6 | –1.7 | 837.4 | –2.4 |
2 | 878.9 | 871.7 | –0.8 | 870.5 | –1.0 | 869.1 | –1.1 | 866.8 | –1.4 |
3 | 938.4 | 933.3 | –0.5 | 933.3 | –0.5 | 931.9 | –0.7 | 929.4 | –1 |
4 | 998.1 | 994.9 | –0.3 | 990.3 | –0.8 | 991.0 | –0.7 | 986.8 | –1.1 |
5 | 1050.2 | 1048.8 | –0.1 | 1047.3 | –0.3 | 1047.0 | –0.3 | 1050.8 | 0.1 |
6 | 1297.2 | 1294.6 | –0.2 | 1292.1 | –0.4 | 1292.7 | –0.3 | 1292.9 | –0.3 |
7 | 1607.2 | 1606.1 | –0.1 | 1603.8 | –0.2 | 1608.0 | 0 | 1608.0 | 0 |
8 | 1988.5 | 1986.2 | –0.1 | 1987.3 | –0.1 | 1986.7 | –0.1 | 1989.9 | 0.1 |
Table 7The measured damping ratios of TCS coated with different sizes of CLD along the circumferential direction
Modal order | No coating state (%) | Ratio of 1:1 (%) | Effect degree (%) | Ratio of 1:2 (%) | Effect degree (%) | Ratio of 1:3 (%) | Effect degree (%) | Ratio of 1:6 (%) | Effect degree (%) |
1 | 0.30 | 0.71 | 136.7 | 0.81 | 170.0 | 0.97 | 223.3 | 0.92 | 206.7 |
2 | 0.19 | 0.24 | 26.3 | 0.27 | 42.1 | 0.35 | 84.2 | 0.41 | 115.8 |
3 | 0.26 | 0.27 | 3.8 | 0.29 | 11.5 | 0.35 | 34.6 | 0.52 | 100.0 |
4 | 0.64 | 0.63 | -1.6 | 0.92 | 43.8 | 1.04 | 62.5 | 0.86 | 34.4 |
5 | 0.20 | 0.24 | 20.0 | 0.35 | 75.0 | 0.45 | 125.0 | 0.69 | 245.0 |
6 | 0.22 | 0.21 | -4.5 | 0.38 | 72.7 | 0.40 | 81.8 | 0.78 | 254.5 |
7 | 0.29 | 0.29 | 0 | 0.35 | 20.7 | 0.53 | 82.8 | 0.64 | 120.7 |
8 | 0.11 | 0.31 | 181.8 | 0.22 | 100.0 | 0.51 | 363.6 | 0.68 | 518.2 |
Table 8The measured natural frequencies of TCS coated with different sizes of CLD along the axis direction
Modal order | No coating state (Hz) | Ratio of 1:1 (Hz) | Effect degree (%) | Ratio of 1.5:1 (Hz) | Effect degree (%) | Ratio of 2:1 (Hz) | Effect degree (%) | Ratio of 3:1 (Hz) | Effect degree (%) |
1 | 858.2 | 844.9 | –1.5 | 835.6 | –2.6 | 836.4 | –2.5 | 839.9 | –2.1 |
2 | 878.9 | 871.7 | –0.8 | 866.7 | –1.4 | 866.4 | –1.4 | 868.2 | –1.2 |
3 | 938.4 | 933.3 | –0.5 | 928.6 | –1 | 928.3 | –1.1 | 930.5 | –0.8 |
4 | 998.1 | 994.9 | –0.3 | 986.5 | –1.2 | 986.3 | –1.2 | 989.1 | –0.9 |
5 | 1050.2 | 1048.8 | –0.1 | 1044.8 | –0.5 | 1045.2 | –0.5 | 1046.2 | –0.4 |
6 | 1297.2 | 1294.6 | –0.2 | 1290.6 | –0.5 | 1289.2 | –0.6 | 1290.1 | –0.5 |
7 | 1607.2 | 1606.1 | –0.1 | 1599.2 | –0.5 | 1598.2 | –0.6 | 1601.3 | –0.4 |
8 | 1988.5 | 1986.2 | –0.1 | 1982.0 | –0.3 | 1981.9 | –0.3 | 1984.6 | –0.2 |
Table 9The measured damping ratios of TCS coated with different sizes of CLD along the axis direction
Modal order | No coating state (%) | Ratio of 1:1 (%) | Effect degree (%) | Ratio of 1.5:1 (%) | Effect degree (%) | Ratio of 2:1 (%) | Effect degree (%) | Ratio of 3:1 (%) | Effect degree (%) |
1 | 0.30 | 0.71 | 136.7 | 0.98 | 226.7 | 1.05 | 250.0 | 0.88 | 193.3 |
2 | 0.19 | 0.24 | 26.3 | 0.29 | 52.6 | 0.32 | 68.4 | 0.29 | 52.6 |
3 | 0.26 | 0.27 | 3.8 | 0.26 | 0 | 0.27 | 3.8 | 0.28 | 7.7 |
4 | 0.64 | 0.63 | –1.6 | 0.65 | 1.6 | 0.68 | 6.3 | 0.77 | 20.3 |
5 | 0.20 | 0.24 | 20.0 | 0.25 | 25.0 | 0.32 | 60.0 | 0.33 | 65.0 |
6 | 0.22 | 0.21 | –4.5 | 0.27 | 22.7 | 0.27 | 22.7 | 0.46 | 109.1 |
7 | 0.29 | 0.29 | 0 | 0.46 | 58.6 | 0.56 | 93.1 | 0.81 | 179.3 |
8 | 0.11 | 0.31 | 181.8 | 0.20 | 81.8 | 0.25 | 127.3 | 0.24 | 118.2 |
Table 10The measured mode shapes of TCS coated with different sizes of CLD
Modal order | No coating state | Different sizes of CLD along the circumferential direction | Different sizes of CLD along the axis direction | ||||||
Ratio of 1:1 | Ratio of 1:2 | Ratio of 1:3 | Ratio of 1:6 | Ratio of 1:1 | Ratio of 1.5:1 | Ratio of 2:1 | Ratio of 3:1 | ||
1 | 1,4 | 1,4 | 1,4 | 1,4 | 1,4 | 1,4 | 1,4 | 1,4 | 1,4 |
2 | 1,5 | 1,5 | 1,5 | 1,5 | 1,5 | 1,5 | 1,5 | 1,5 | 1,5 |
3 | 1,3 | 1,3 | 1,3 | 1,3 | 1,3 | 1,3 | 1,3 | 1,3 | 1,3 |
4 | 1,6 | 1,6 | 1,6 | 1,6 | 1,6 | 1,6 | 1,6 | 1,6 | 1,6 |
5 | 1,7 | 1,7 | 1,7 | 1,7 | 1,7 | 1,7 | 1,7 | 1,7 | 1,7 |
6 | 1,2 | 1,2 | 1,2 | 1,2 | 1,2 | 1,2 | 1,2 | 1,2 | 1,2 |
7 | 1,8 | 1,8 | 1,8 | 1,8 | 1,8 | 1,8 | 1,8 | 1,8 | 1,8 |
8 | 1,9 | 1,9 | 1,9 | 1,9 | 1,9 | 1,9 | 1,9 | 1,9 | 1,9 |
Table 11The measured natural frequencies of TCS coated with CLD rings in different positions
Modal order | No coating state (Hz) | CLD coated in the constrained end (Hz) | Effect degree (%) | CLD coated in the middle (Hz) | Effect degree (%) | CLD coated in the free end (Hz) | Effect degree (%) |
1 | 858.2 | 843.4 | –1.7 | 840.4 | –2.1 | 834.5 | –2.8 |
2 | 878.9 | 870.1 | –1.0 | 866.7 | –1.4 | 864.8 | –1.6 |
3 | 938.4 | 934.8 | –0.4 | 931.9 | –0.7 | 925.4 | –1.4 |
4 | 998.1 | 994.0 | –0.4 | 986.3 | –1.2 | 976.5 | –2.2 |
5 | 1050.2 | 1047.1 | –0.3 | 1049.4 | –0.1 | 1048.3 | –0.2 |
6 | 1297.2 | 1293.3 | –0.3 | 1292.1 | –0.4 | 1294.7 | –0.2 |
7 | 1607.2 | 1604.4 | –0.2 | 1609.1 | 0.1 | 1607.7 | 0.0 |
8 | 1988.5 | 1984.6 | –0.2 | 1991.7 | 0.2 | 1989.8 | 0.1 |
3.3. Test results of modal parameters of the shell in different coating positions of CLD rings
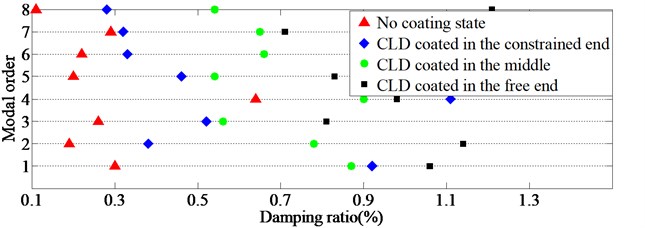
In this section, we firstly make CLD into 3 different rings with the width of 23 mm, and the length of each ring must cover the whole circumference of the shell. Then, paste these CLD rings on the different positions of TCS, such as the free end, the middle and the constrained end of the shell, as seen in Fig. 7, and using the same test method to obtain modal parameters at the same response points. The measured frequency, damping and shape results of the shell, in different coating positions of CLD rings, are given in Table 11, Table 12 and Table 13, and these test results are compared with the ones without CLD. Besides, in order to clearly describe the effect degree and trend of the positions of damping rings, the corresponding scattergrams of natural frequencies and damping ratios are also given, as shown in Fig. 10 and Fig. 11.
Table 12The measured damping ratios of TCS coated with CLD rings in different positions
Modal order | No coating state (%) | CLD coated in the constrained end (%) | Effect degree (%) | CLD coated in the middle (%) | Effect degree (%) | CLD coated in the free end (%) | Effect degree (%) |
1 | 0.30 | 0.92 | 206.7 | 0.87 | 190.0 | 1.06 | 253.3 |
2 | 0.19 | 0.38 | 100.0 | 0.78 | 310.5 | 1.14 | 500.0 |
3 | 0.26 | 0.52 | 100.0 | 0.56 | 115.4 | 0.81 | 211.5 |
4 | 0.64 | 1.11 | 73.4 | 0.90 | 40.6 | 0.98 | 53.1 |
5 | 0.20 | 0.46 | 130.0 | 0.54 | 170.0 | 0.83 | 315.0 |
6 | 0.22 | 0.33 | 50.0 | 0.66 | 200.0 | 1.17 | 431.8 |
7 | 0.29 | 0.32 | 10.3 | 0.65 | 124.1 | 0.71 | 144.8 |
8 | 0.11 | 0.28 | 154.5 | 0.54 | 390.9 | 1.21 | 1000.0 |
Table 13The measured mode shapes of TCS coated with CLD rings in different positions
Modal order | No coating state | CLD coated in the constrained end | CLD coated in the middle | CLD coated in the free end |
1 | 1,4 | 1,4 | 1,4 | 1,4 |
2 | 1,5 | 1,5 | 1,5 | 1,5 |
3 | 1,3 | 1,3 | 1,3 | 1,3 |
4 | 1,6 | 1,6 | 1,6 | 1,6 |
5 | 1,7 | 1,7 | 1,7 | 1,7 |
6 | 1,2 | 1,2 | 1,2 | 1,2 |
7 | 1,8 | 1,8 | 1,8 | 1,8 |
8 | 1,9 | 1,9 | 1,9 | 1,9 |
4. The influence analysis of modal parameters of TCS coated with CLD
In this section, on the basis of the measured results in Section 3, the influence on natural frequencies, mode shapes and damping ratios of TCS coated with CLD are analyzed and discussed in details.
4.1. The influence analysis of modal parameters of TCS coated with different numbers of CLD pieces
4.1.1. The influence on natural frequencies of TCS
From Table 3 and Fig. 8, it can be found that: (I) Compared with no coating state, CLD will reduce the natural frequency of TCS due to the added mass. (II) The decreased degree of each natural frequency is becoming more obvious with the increase of numbers of CLD pieces, and the low order natural frequency will reduce more than the ones of other modes. For example, the 1st natural frequency is decreased nearly to 2.5 %. (III) For some high order modes, their decreased degree is very small. Taking the 7th and 8th natural frequencies for an example, they only decrease 0.1 %-0.9 % compared with the ones under no coating state. (IV) With the increase of numbers of CLD pieces, the decreased degrees of most modes are gradually unobvious. For example, the resulting frequency of 9 CLD pieces is very close to the one of 12 CLD pieces, and the difference between them is within 0.2 %.
Fig. 10The scattergrams of natural frequencies of TCS coated with CLD rings in different positions
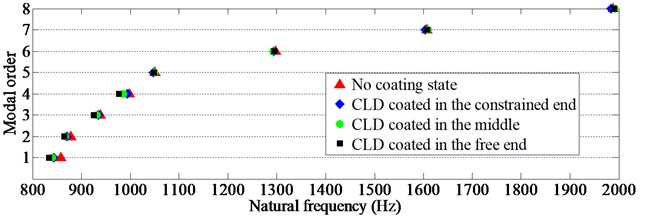
Fig. 11The scattergrams of damping ratios of TCS coated with CLD rings in different positions
4.1.2. The influence on damping ratios of TCS
From Table 4 and Fig. 9, it can be found that: (I) For most modes of TCS, CLD will increase the damping of TCS, and their damping effect is good both in the low order and high order mode. For example, the increased damping of the1st mode can reach to 250 % and the increased damping of the 8th mode can reach to 263.6 %. (II) The increased degree of damping of TCS is not proportional to the increased numbers of CLD pieces. Taking 9 CLD pieces and 12 CLD pieces for an example, their damping effect is very close to each other. And for the first modal damping, the increased damping of 9 CLD pieces is higher than the one of 12 CLD pieces by 0.17 %. (III) For a small part of modes of TCS, the damping results will slightly decrease compared with the ones under no coating state when the numbers of CLD pieces are less than 3 pieces, but the maximum reduction is less than 4.5 %. And with the increase of numbers of CLD pieces, the resulting damping of the related mode is reversely up more than 50 %. Therefore, it is still believed that the contribution of CLD is much larger than its negative effect to the thin walled shell structure.
4.1.3. The influence on mode shapes of TCS
From Table 5, it can be found that basically the resulting mode shapes of TCS can hardly be changed by the increase of numbers of CLD pieces, and they are just as the same as the ones under no coating state.
4.2. The influence analysis of modal parameters of TCS coated with different sizes of CLD pieces
4.2.1. The influence on natural frequencies of TCS
From Table 6 and Table 8, it can be found that: (I) Compared with no coating state, the natural frequency of TCS will be reduced by the increase of sizes of CLD pieces, and the decreased degree of low order mode is more obvious than the ones of other modes. For example, the 1st natural frequency is down within the level of 2.4 %-2.6 %. (II) For some high order modes, their decreased degree is very small. Taking the 7th and 8th natural frequencies for an example, they only decrease 0.1 %-0.6 %. (III) For the increased sizes of CLD along the circumference direction of TCS, the decreased degrees of the 1st and 2nd natural frequency are basically proportional to the increased size of the damping material, while for the increased sizes of CLD along the axis direction, the corresponding frequency value is not proportional to the increased size of the damping material, and its minimum of 2.6 % can be reached when the length-width ratio is 1.5:1 rather than 3:1. (IV) Compared with two types of the increased sizes of CLD while each type changes with the same size, the damping size increased along the axis direction will have a greater reduction on frequency results for the most modes of TCS.
4.2.2. The influence on damping ratios of TCS
From Table 7 and Table 9, it can be found that: (I) For most modes of TCS, coating different sizes of CLD pieces on the shell will definitely increase its damping, especially when the length-width ratio of CLD pieces is 1:6, the damping effect is significant, e.g., excepting the 4th mode, damping results of the other modes increase at least 100 %. (II) For the increased sizes of CLD along the circumference or direction of TCS, each type can significantly improve the 1st damping, and the degree of improvement can reach to the range of 170 %-250 %. (III) Compared with two types of the increased sizes of damping material, for the increased sizes of CLD along the circumference of TCS, it can also increase the high order modal damping with high efficiency, e.g., the increased damping of the 8th mode can reach to 518.2 %.
4.2.3. The influence on mode shapes of TCS
From Table 10, it can be found that basically the resulting mode shapes of TCS can hardly be changed by the increase of sizes of CLD pieces, and they are just as the same as the ones under no coating state.
4.3. The influence analysis of modal parameters of TCS coated with CLD rings in different positions
4.3.1. The influence on natural frequencies of TCS
From Table 11 and Fig. 10, it can be found that: (I) Compared with no coating state, the natural frequency of TCS will be reduced when CLD rings are coated on the free end, the middle and the constrained end of TCS. And the low order and middle order frequency results seem to be more sensitive to the CLD rings coated on the free end, e.g., the decreased degree of the first 4 natural frequencies can reach to the range of 1.8 %-2.6 %. (II) For some high order modes, their decreased degree is very small. Taking the 7th and 8th natural frequencies for an example, the maximum of the related decrease is less than 0.2 %. (III) For some high order modes, such as the 8th mode, its natural frequency is up slightly, but the increased degree is limited, which is within the range of 0.1 %-0.2 %. Therefore, it is still believed that CLD rings in different positions will not increase the stiffness, but bring the additional mass to TCS, and this is response for the decrease of natural frequencies of the thin walled shell structure.
4.3.2. The influence on damping ratios of TCS
From Table 12 and Fig. 11, it can be found that: (I) When CLD rings are coated on the free end, the middle and the constrained end of TCS, all of them can increase the damping. But the CLD ring coated on the free end will have the best damping effect, e.g., excepting the 4th mode, damping results of the other modes increase at least 144.8 %. (II) When CLD ring is coated on the free end of TCS, it will not only improve the low order modal damping, e.g., the 1st damping is improved by 253.3 % and the 2nd damping by 500 %, but also will increase the high order mode damping significantly, e.g., the increased damping of the 8th mode can reach to 1000 %. (III) For the TCS under free-fixed boundary, the maximum vibration response is generally located in the free end while the maximum stress in the constrained end. In order to achieve the best damping effect, it is suggested that the damping material be coated on the position of the maximum response rather than the position of the maximum stress.
4.3.3. The influence on mode shapes of TCS
From Table 13, it can be found that basically the resulting mode shapes of TCS can hardly be changed by CLD rings coated in different positions, and they are just as the same as the ones under no coating state.
5. Conclusions
This research has experimentally investigated on the influence on modal parameters of TCS coated with CLD, and the corresponding experiment system and test methods which are suitable for the shell coated with CLD are also proposed. Based on the accurate measured data, the following conclusions can be drawn:
1) Increasing the numbers and sizes of CLD pieces or changing coating positions of CLD rings basically will not lead to the change of mode shapes of TCS, but will reduce its natural frequencies within the range of 0.1 %-2.8 %, and the damping sizes increased along the axis direction will have a greater reduction on frequency results for the most modes of TCS. However, some high order natural frequencies, e.g., the 7th and 8th frequency results, are little reduced by the varied CLD pieces and rings, and the corresponding decreased degree is within the range of 0.1 %-0.9 %.
2) Coating CLD pieces or CLD rings on TCS will definitely increase its damping, especially when the length-width ratio of CLD pieces is 1:6, the damping effect is significant, e.g., excepting the 4th mode, damping results of the other modes increase at least 100 %. Besides, the CLD ring coated on the free end of TCS will have the best damping effect, e.g., excepting the 4th mode, damping results of the other modes increase at least 144.8 %, and this coating techniques will also increase the high order mode damping significantly, e.g., the increased damping of the 8th mode can reach to 1000 %.
References
-
Leissa Arthur W. Vibrations of Shells. Acoustical Society of America, Ohio, 1973.
-
Ip K. H., Chan W. K., Tse P. C., et al. Vibration analysis of orthotropic thin cylindrical shells with free ends by the Rayleigh-Ritz method. Journal of Sound and Vibration, Vol. 195, Issue 1, 1996, p. 117-135.
-
Amabili M. Free vibration of a fluid-filled circular cylindrical shell with lumped masses attached, using the receptance method. Shock and Vibration, Vol. 3, Issue 3, 1996, p. 159-167.
-
Farshidianfar A., Farshidianfar M. H., Crocker M. J., et al. Vibration analysis of long cylindrical shells using acoustical excitation. Journal of Sound and Vibration, Vol. 330, Issue 14, 2011, p. 3381-3399.
-
Goldman R. L. Mode shapes and frequencies of clamped-clamped cylindrical shells. AIAA Journal, Vol. 12, Issue 12, 1974, p. 1755-1756.
-
Ewins D. J. Modal Testing: Theory and Practice. Research Studies Press, Latchworth, Hertfordshire, 1984.
-
Zheng H., Pau G. S. H., Wang Y. Y. A comparative study on optimization of constrained layer damping treatment for structural vibration control. Thin-Walled Structures, Vol. 44, Issue 8, 2006, p. 886-896.
-
Jin G., Yang C., Liu Z., et al. A unified method for the vibration and damping analysis of constrained layer damping cylindrical shells with arbitrary boundary conditions. Composite Structures, Vol. 130, 2015, p. 124-142.
-
Pan H. H. Axisymmetrical vibrations of a circular sandwich shell with a viscoelastic core layer. Journal of Sound and Vibration, Vol. 9, Issue 2, 1969, p. 338-348.
-
Ramesh T. C., Ganesan N. Vibration and damping analysis of cylindrical shells with a constrained damping layer. Computers and Structures, Vol. 46, Issue 4, 1993, p. 751-758.
-
Chen L. H., Huang S. C. Vibrations of a cylindrical shell with partially constrained layer damping (CLD) treatment. International Journal of Mechanical Sciences, Vol. 41, Issue 12, 1999, p. 1485–1498.
-
Chen L. H., Huang S. C. Vibration attenuation of a cylindrical shell with constrained layer damping strips treatment. Computers and Structures, Vol. 79, Issue 14, 2001, p. 1355-1362.
-
Wang H. J., Chen L. W. Finite element dynamic analysis of orthotropic cylindrical shells with a constrained damping layer. Finite Elements in Analysis and Design, Vol. 40, Issue 7, 2004, p. 737-755.
-
Zheng H., Cai C., Pau G. S. H., et al. Minimizing vibration response of cylindrical shells through layout optimization of passive constrained layer damping treatments. Journal of Sound and Vibration, Vol. 279, Issue 3, 2005, p. 739-756.
-
Wang M., Fang Z. C. Coupled vibration control of cylindrical shells partially treated with active constrained layer damping. Chinese Journal of Applied Mechanics, Vol. 22, Issue 4, 2005, p. 545-549.
-
Li E. Q., Li D. K., Tang G. J., et al. Dynamic analysis of constrained layer damping cylindrical shell. Engineering Mechanics, Vol. 25, Issue 5, 2008, p. 6-11.
-
Xiang Y., Huang Y. Y., Lu J., et al. A matrix method for analyzing vibration of a circular cylindrical shell with partially constrained layer damping treatment. Journal of Vibration Engineering, Vol. 22, Issue 2, 2009, p. 175-182.
-
Mohammadi F., Sedaghati R. Linear and nonlinear vibration analysis of sandwich cylindrical shell with constrained viscoelastic core layer. International Journal of Mechanical Sciences, Vol. 54, Issue 1, 2012, p. 156-171.
Cited by
About this article

This study was supported by the National Natural Science Foundation of China Grant No. 51505070, the Fundamental Research Funds for the Central Universities of China Grant No. N150304011 and the National Basic Research Program of China Grant No. 2012CB026006.
