Abstract
Currently, researches on the acoustic radiation efficiency and sound insulation performance of the micro-perforated plate mainly focused on the experimental test, and the numerical simulation is rarely reported. In this paper, firstly, the discrete element method was applied to test the acoustic radiation efficiency of the micro-perforated plate. It was shown that the experimental result was reliable, which made up for the deficiency of the traditional vibro-acoustic test method. Secondly, the pulse decay method was used to test the damping loss factor of the perforated plate. Then, the transfer admittance on both sides of the micro-perforated plate was computed to simulate the properties of the hole. Finally, the damping loss factor and admittance were imported into the boundary element model (BEM) of the micro-perforated plate, in order to compute the transmission loss, and it was compared with that of the experimental test. As shown from the compared result, the sound insulation performance of the micro-perforated plate can be predicted effectively using this method. Based on the verified simulation model, the impact of the hole diameter, plate thickness and perforation rate on sound insulation performance of the perforated plate was studied. However, each structural parameter of the perforated plate can't be optimal through the above analysis. As a result, an optimization design was conducted on it based on the improved genetic algorithm. Finally, the perforated plate which had the optimal structural parameter and performance was obtained. Finally, the optimized perforated plate was applied on the high-speed train, and the experimental results showed that the interior noise in the high-speed train was reduced obviously.
1. Introduction
In the noise control field, the resonance structure of the perforated plate is a common sound absorption structure [1]. Currently, it has been widely used in mufflers and the top plate of the high-speed trains [2]. Researches on sound absorption structures of the perforated plate mainly focused on the theoretical and experimental stages. Ma derived its theoretical formulas and proposed that when the hole diameter is below 1 mm, the sound absorption performance of the micro perforated plate in mid-high frequency bands could be improved significantly [3]. Starting from the experimental test, Liu studied sound absorption properties of the perforated plate in the diffusion field [4], and analyzed the impact factors on the sound absorption of the perforated plate. By means of the transfer matrix method, Lee discussed sound absorption properties of the multilayer perforated plate [5]. However, the mentioned researches primarily focused on theories. When the studied structure is complex, there are some limitations of the theory. As a result, the numerical simulation is very important. In addition, none of the published papers and researches has studied the acoustic radiation efficiency of the perforated plate currently.
The traditional vibro-acoustic method can't be used to test the acoustic radiation efficiency of the perforated plate. As a result, the discrete element method was attempted to test it in this paper. By means of the discrete element method, Li tested the acoustic radiation efficiency of the engine gear cover [6]. And the property of the acoustic radiation efficiency for the perforated plate could be obtained accurately through this method. Under the quite maturely theoretical and experimental circumstances, the time can be saved and costs can be reduced by the numerical simulation. BEM was intended to be used in the paper to conduct the simulation for the sound insulation performance of the perforated plates. Then, its result was compared with that of the experimental test, and its reliability was verified. Furthermore, the impact factors on the sound insulation performance of the perforated plates were analyzed based on the verified simulation technology. However, each structural parameter of the perforated plate can’t be optimal currently through the above analysis. As a result, an optimization design should be conducted.
In general, optimization algorithms for solving global optimization problems can be classified into two types: deterministic algorithms and stochastic algorithms [7-10]. Deterministic algorithms refer to that analytical characteristics of a problem are applied to generate a finite or infinite point sequence which is then converged to a global optimal solution, or the generated point sequence has a converged sub-sequence which can converge to the global optimal solution. Generally speaking, characteristics including convexity, monotony and denseness are usually called as global analytical characteristics. Deterministic algorithms use a lot of analytical characteristics of functions, so the search is pertinent and the convergence is quick. However, in the practical problems, it is very difficult to find global optimal solutions. With expansion of the solved scale and local optimal points, the traditional deterministic optimization algorithms can easily fall into local optimal solutions, and the global optimal solution could hardly be found. Of course, this method with multiple initial points can also be applied to a deterministic algorithm, so it can converge to different local optimal solutions; then, a good solution is found among the local optimal solutions and taken as the global optimal solution. However, this method is obviously defective in that it has high dependence on problems. Selection of initial points and smoothness of a problem play a key role in search for optimal solutions. At present, there is no deterministic global optimization algorithm which is extensively applicable. In general, a deterministic algorithm is designed aiming at a category of problems, where strict assumption conditions are often needed. In order to find global optimal solutions, a category of stochastic algorithms without depending on problem characteristics are generated. Stochastic algorithms generally simulate natural phenomena or social behaviors. They are most typically featured in that the requirements for analytical characteristics of optimization functions are very low, and even lack of a displayed analytical expressions is allowed. In this way, problems such as high dimensions and noise can be solved effectively. Therefore, this paper used the genetic algorithm to optimize the perforated plate. Finally, the perforated plate which had the optimal structural parameter and performance was obtained. Finally, the optimized perforated plate was applied on the high-speed train, and the experimental results showed that the interior noise in the high-speed train was reduced obviously.
2. Experimental test on acoustic radiation efficiency for the perforated plate
One of the main noise sources is the sound radiation from the structural vibration. Through the structural vibration, fluctuations of the flow field around the structure are caused and spread.
The sheet structure is widely used in various fields. However, the vibration is easily caused in the engineering applications due to its low rigidity, thereby radiating noise and becoming one noise source. Therefore, the radiation characteristics of the perforated plate are very important for how to effectively control the plate structures and connections, in order to obtain the desired structure.
Currently, researches on the acoustic radiation characteristics mainly based on the sound intensity method. Namely, the acoustic radiation power of the structure could be obtained by the multiple between the sound intensity on the envelope surfaceand the envelope surface, as shown in Eq. (1):
However, the sound intensity method is very sensitive to the experimental environment, causing experiments to be conducted in the anechoic chamber. In this way, costs are high and the limitations are obvious. Thus, the experimental requirements cannot be met by the sound intensity method in the site test. As there are many holes on the perforated plate, an accurate result cannot be obtained through the traditional method. Therefore, the discrete element method is considered. The acoustic radiation power of a small vibrating piston is shown in Eq. (2). Acoustic radiation power is the square of vibration velocities which are a scalar. For a structure which is separated into multiple piston elements, total acoustic radiation power is not only the superposition of acoustic radiation power of each piston structure, but also contained mutual acoustic radiation power. The thought of the discrete element method had been mature and widely used. Hashimoto [11] computed the acoustic radiation efficiency of thin plates adopting the discrete element method and experimentally verified the reliability of this algorithm. Li [6] used the discrete element method to compute the acoustic radiation efficiency of the diesel engine gear cover. This paper proposed that the discrete element method could be applied to the plane vibration source with any shapes and characteristics. With bulged surfaces, the gear cover can still be approximately considered as a plane part. The method is used to compute acoustic radiation efficiency. The computational result is very close to the result obtained by the traditional method in the analyzed frequency range. The above analysis indicates that it is feasible to use the discrete element method to compute the acoustic radiation efficiency of the perforated plate in this paper.
The sound radiation structure of the piston movement is as follows:
is the average acoustic radiation power, is the radiation impedance, and is the amplitude of the structural vibration velocity. Considering researches on the acoustic radiation impedance, the radiation on the structural surface was tested to obtain such properties like the structural acoustic radiation impedance and acoustic radiation power.
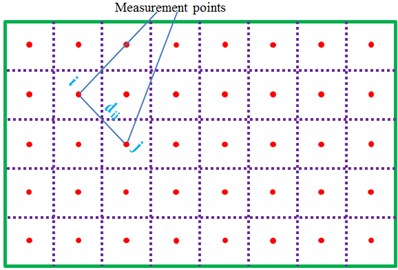
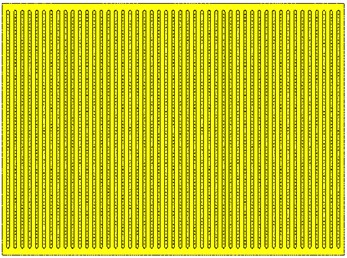
As shown in Fig. 1, the plates were divided into a series of rectangular elements and each element size was depended on the studied frequency range. Each vibration element was deemed as a small vibrating piston. Through solving the acoustic radiation power of each element, the total acoustic radiation power of the structure could be finally obtained.
During applying the discrete element method, the number and size of elements are very important. The radiation impedance of the rectangular element is similar to that of the piston vibration plate. If the number of divided elements is inadequate, the obtained acoustic radiation efficiency will be dominated by self-radiation impedance, which is counterproductive to the tested result. There is the most extreme example. Namely, the element is divided into 1×1, which is equivalent to a single circular piston vibration plate. At this time, acoustic radiation efficiency is totally determined by self-radiation impedance. Obviously, it is not meaningful for studying acoustic radiation. For the appropriate test process, the mutual radiation impedance occupies a dominant position compared with self-radiation impedance. The size of divided elements is less than half of wavelength of object at the critical resonance frequency. Acoustic radiation efficiency tends to be uniform when the analyzed frequency is more than the critical resonance frequency. As a result, the impact of the number of divided elements on the tested result could almost be ignored when the computational frequency of acoustic radiation efficiency is higher than the critical frequency. When the analyzed frequency is below the critical frequency, the more the number of elements is, the more accurate the computational result will be. It is also explained in reference [11] in detail. The length and width of vibration elements should try to keep consistent. In addition, the computational maximum frequency is up to the size of elements, as shown in Eq. (3). The maximum frequency required in the paper is 2500 Hz. Therefore, the required optimal length of elements is 22.6 m. As a result, the perforated plate is divided into 44×56 elements:
wherein, is the highest computational frequency, 2500 Hz; 340 m/s, the required maximum element size is 22.6 mm.
Fig. 1Division diagram of the plate vibration elements
As shown from the published research [11], when the aspect ratio of the element is closer to 1, the experimental result would be more accurate. As shown in the published research, the size of the experimental plate is 1×1 m, and the number of individual elements is set as 20×20. The experimental results were compared with those theoretical results, and they were consistent with each other. Therefore, the experimental results would be accurate. Thus, the perforated plate was divided into 44×56 elements. The test is conducted in an environment which satisfies the required diffuse sound field. The dimension of the incident reverberation chamber is as follows: 5.25 m×4.6 m×4.14 m. The dimension of the transmission reverberation chamber is as follows: 5.3 m×4.3 m×3.5 m. The dimension of the window connecting two chambers is shown below: 1.25 m×1.0 m. The perforated plate is fixed in the window. Sludge is used to seal the gap between windows and perforated plates to prevent sound leakage, as shown in Fig. 2(a).
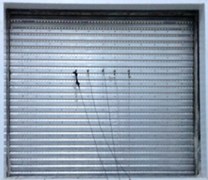
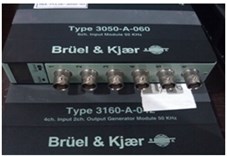
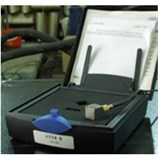
Fig. 2Division and testing process of the perforated plate, a) the transmission side, b) the incident side, c) data collector, d) power amplifier, e) vibration sensor
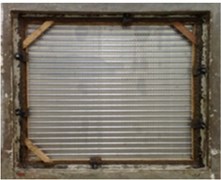
a)
b)
c)
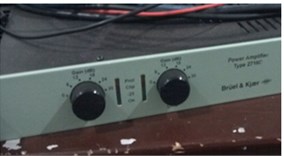
d)
e)
In this way, the experimental test will be more accurate. 5 vibration sensors are arranged on the perforated plate at the side of the incident reverberation chamber in order to obtain the vibration velocity of each discrete element, as shown in Fig. 2(b). The sound excitation sources used for acoustic test mainly include white and pink noises. White noises are the random noise of all frequencies with the same energy. Pink noises are the noise of each one third of frequency range with the same energy. The frequency covers a wide range. This test selects pink noises as the standard signal source. In the test, the sound source of pink noises is connected in the incident reverberation chamber. After the reverberation effect is formed and stable, vibration velocities at each vibration sensor start to be tested synchronously. Each set of data is recorded for 8 s. Each piece of plate is tested three times. Sampling frequency is 65536 Hz. The data acquisition system of the test adopted B&K and power amplifier, as shown in Fig. 2(c) and Fig. 2(d) respectively. The vibration acceleration sensor in the test adopted 4508B piezoelectric accelerator, as shown in Fig. 2(e).
The acoustic radiation power caused by the interaction among elements is also an important part. In order to study the acoustic radiation characteristics of the structure accurately, therefore, the interaction among elements was also considered. The own radiation impedance of the element is as follows:
According to the thought in the paper, the total acoustic radiation power of the complete structure was the superposition of self-radiation acoustic power and mutual acoustic radiation power of elements. According to Eq. (5), the diagonal distance among elements needed to be used in the case of computing the mutual acoustic radiation power. Therefore, vertical or horizontal distance was not being used. In addition, the length and width of elements kept consistent when the elements of structural parts were divided. In this way, the divided element was a square and approximated to a circular piston structure. If the length and width of divided elements were inconsistent, it would be unable to be equivalent to a piston structure. The computational result would be unreliable using the discrete element method. The mutual radiation impedance between the elementand the element is as follows:
wherein, is the density of the air, is the sound speed in the air, and is the areas of the element and the element , respectively. is first-order Bessel function, is the number of waves in the air. is the equivalent radius of the rectangular element. is the imaginary unit. is Struve function, and is the distance between the element and , as shown in Fig. 1.
According to the radiation impedance of the element, the acoustic radiation power of the element could be obtained as follows:
The formula on the right side of Eq. (6) was divided into 2 parts. The first part represented acoustic radiation power caused by the self-radiation impedance of discrete elements. The second part in Eq. (6) represented acoustic radiation power caused by mutual radiation impedance between the element and the element . Reference [6, 7] also described the equation in detail. is the real part. is the normal velocity on element surface And is the complex conjugate. The acoustic radiation power of the plate could be obtained through the summation of acoustic radiation powers in every element.
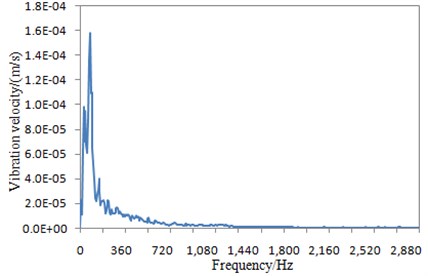
In Eq. (6), it could be seen that the acoustic radiation power of the structure could be obtained easily as long as the normal velocity on the element surface is tested. As only the vibration velocity of the structure is tested rather than the sound intensity or sound pressure, there is no sound leakage. As a result, this method has not only higher accuracy, but broader applicability. Finally, the vibration velocity on the perforated plate surface was obtained from Fig. 2, as shown in Fig. 3. There was an obvious peak in the vibration velocity duo to the resonance between the perforated plate and the excitation load.
Fig. 3Vibration velocities on the perforated plate surface
As the vibration velocity and acoustic radiation power on the structural surface were obtained, it was not difficult to get the structural radiation efficiency as follows:
wherein, is the mean square value of velocities, and is the total area of the plate.
The acoustic radiation efficiency of the perforated plate in Fig. 4 was obtained by Eq. (6) and Eq. (7). The upper limit frequency was set as 2500 Hz in Fig. 4 because of three point reasons as follows: (1) The acoustic radiation efficiency in Fig. 4 was obtained through combining vibration velocity data in Fig. 3 with related computation formulas. The maximum frequency of vibration velocity tested in Fig. 3 was 2880 Hz. Therefore, the upper limit frequency of acoustic radiation efficiency should be lower than 2880 Hz in the computation. Fig. 4 presents acoustic radiation efficiency under one-third octave. Below 2880 Hz, the maximum one-third octave point was 2500 Hz. (2) In the subsequent computation for the transmission loss of the perforated plate, a damping loss factor should be used as an input parameter; the upper limit frequency of the damping loss factor tested in Fig. 6 was 2900 Hz, so the upper limit frequency of the transmission loss should be lower than 2900 Hz; below 2900 Hz, the maximum one-third octave point was 2500 Hz; therefore, the upper limit frequency of the transmission loss was 2500 Hz, and the upper limit frequency of acoustic radiation efficiency in Fig. 4 should be kept consistent with the transmission loss. (3) The perforated plate will be finally applied to the high-speed train. High-frequency noises of the high-speed train mainly refer to the aerodynamic noise, and mid-low frequency noises are the structural vibration noise. The paper mainly studied the structural vibration noise of the perforated plate, and the upper limit frequency 2500 Hz was enough to cover all the mid-low frequency bands. Based on three point reasons, the upper limit frequency in Fig. 4 was finally set as 2500 Hz. It was shown in these formulas that the acoustic radiation power needed by the acoustic radiation efficiency was in the near-field. Therefore, acoustic radiation efficiency computed in this paper was the near-field result. In general, acoustic radiation efficiency referred to the near-field case, it is meaningless to study far-field cases because: far-field acoustic radiation efficiency shall be obtained through testing far-field acoustic radiation power; the far-field acoustic radiation power is seriously affected by experimental environments; acoustic radiation caused by structural vibration attenuated seriously due to air, so real acoustic radiation characteristics of the structure cannot be presented.
Fig. 4Acoustic radiation efficiency of the perforated plate
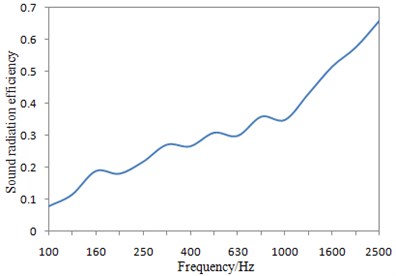
The perforated plate studied in the paper is 1.5 mm thickness, 1250 mm length and 1000 mm width. The cross section has a large size. In addition, the perforated plate has a smooth surface and lacks structures like reinforcing ribs. As a result, the perforated plate has few local and overall modes. On the curve of acoustic radiation efficiency, acoustic radiation efficiency has few peak and valley. The curve is relatively smooth, which is consistent with the actual situation. The curve of the vertical incidence coefficient of the perforated plate studied in reference [12] is also very smooth. The thickness of the perforated plate is only 1.5 mm, resulting in a high coincidence frequency. Acoustic radiation efficiency of a finite structure will approach 1 in high-frequency bands. Researches by Maidanik [13] showed that the acoustic radiation efficiency of the structure was large in high-frequency bands and was basically unchanged, while even small vibration would radiate large acoustic powers. Therefore, even if the vibration velocity of the structure tended to decrease in high-frequency bands, the acoustic power could still increase. Through quantification of frequencies corresponding to acoustic radiation efficiencies, we can find that the structural acoustic radiation efficiency began approaching 1 from a certain frequency. Below the frequency, the acoustic radiation efficiency gradually increased with the increase of the analyzed frequency, wherein the frequency was defined as critical frequency. In engineering design, critical frequency was an important design index. Different design requirements could be satisfied through changing of aspect ratio, rigidity and materials of the structure, so that critical frequency could be utilized or avoided. In addition, coincidence effects will not be generated when the analyzed frequency was less than the critical frequency; when the analyzed frequency was more than the critical frequency, coincidence effects will be generated and plates will have violent vibration, wherein at this moment, free flexural waves in the plates will radiate a lot of sounds externally and thus acoustic radiation ability of the plates will be greatly enhanced and its sound insulation performance will be reduced obviously. Therefore, critical frequency was very important. It was computed by Eq. (8) in general. In the paper, parameters of the perforated plate included: thickness of 1.5 mm, Poisson’s ratio of 0.33, elasticity modulus of 72 GPa, and density of 2700 kg/m3. Therefore, the critical frequency of the perforated plate computed by Eq. (8) was 7960 Hz. The upper-limit frequency computed in Fig. 4 was only 2500 Hz, which was far smaller than the critical frequency. Therefore, it tended to increase gradually with the increase of the analyzed frequency. Additionally, it was shown in the formula that the acoustic radiation efficiency would increase with the decrease of vibration velocity. In Fig. 4, the initial frequency point of acoustic radiation efficiency was 100 Hz. In Fig. 3, the initial frequency point of vibration velocity was 0 Hz. Of course, the vibration velocity within 100-2500 Hz should be extracted to compute acoustic radiation efficiency within 100-2500 Hz. It was shown in Fig. 3 that, within 100-2500 Hz, the vibration velocity gradually decreased with the increased frequency. Therefore, vibration velocities in Fig. 3 and acoustic radiation efficiencies in Fig. 4 had consistent changing trends:
where: is critical frequency of the plate; is the sound propagation speed in air; is the thickness of plate; is the density of the perforated plate; is the Poisson’s ratio; is the elasticity modulus.
3. Numerical computation of transmission loss for the perforated plate
3.1. The finite element model of the perforated plate
The relatively thin perforated plate, with the dimension of 1250×1000×1.5 mm, would be affected by three-dimensional modeling in terms of the mesh quality. Thus, the shell element was applied to divide the plate and then set the thickness of the structure. Compared with the cross-sectional area, the hole size was very small and its treatment in modeling would lead to the decreased mesh quality and difficultly ensured computational accuracy. Therefore, the sealed treatment was conducted on the hole in the mesh division, and the hole was simulated by giving the admittance property. As shown in Fig. 5, there were 167964 triangular elements and 146759 nodes in the finite element model. As shown in Fig. 2(a). The perforated plate was fixed in the window. Therefore, four sides of the finite element model were fixed and constrained to simulate the actual situation. Through experimental test, the damping loss factor and impedance of the perforated plate were obtained and imported into the finite element model to obtain the computational result of the perforated plate.
Fig. 5Finite element model of the perforated plate
3.2. Experimental test on the damping loss factor
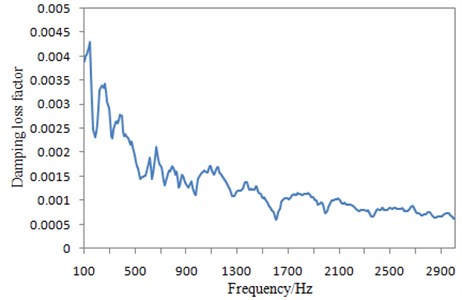
In the acoustic simulation of the perforated plate, the damping loss factor is an essential parameter. In order to obtain the damping loss factor of the perforated plate, the pulse decay method [14, 15] was applied in the experiment. The perforated plate was suspended by a flexible rope to realize the free vibration after applying excitation [16, 17]. Six acceleration sensors were placed at appropriate locations. Then the force hammer was used to produce transient excitation in different locations and the vibration attenuation process of each experimental point was recorded. Sampling time is 10 s. Sampling frequency is 6000 Hz. Finally, in combination with the advanced data processing method, the damping loss factor was identified and obtained, as shown in Fig. 6.
Fig. 6Damping loss factor of the perforated plate
3.3. Solving admittance
As described in the above, the finite element mesh was hard to be divided in the acoustic computation due to many small holes in the perforated plate. If the hole was divided carefully, the number of the mesh will be very huge and the quality will be too poor to be computed. In order to solve the problem of holes, they were simulated among the mesh on both sides of the perforated plate through the defined transfer admittance. The transfer admittance could be solved by the acoustic impedance since it was the reciprocal of the acoustic impedance. The formula of the acoustic impedance was as follows:
is the sound pressure before and after the sound passing the perforated plate, and is the vibration velocity at the small hole. The Mechel formula could be used to compute and obtain the impedance as follows:
wherein, is the angular frequency , is the fluid dynamic viscosity , is the fluid density (kg/m3), is the porosity of the perforated plate, namely the ratio of hole volume to the plate volume, is the thickness of the perforated plate, and is a correction term selected according to different arrangement of the holes. The porosity is as follows:
wherein, is the number of holes, is the volume of holes. is the cross-sectional area of the perforated plate and is the thickness of the perforated plate.
In the practical engineering, the arrangement of holes is mainly divided into the square and hexagonal types. The holes described in the paper were arranged in rectangular. However, Kang studied and found that the arrangement of holes played little impact on the correction thickness [13]. Therefore, the computational formula of the square arrangement could be used to obtain the correction thickness as follows:
is the center distance between two adjacent round holes.
In the numerical simulation, the perforated plate was expressed by defining a transfer admittance matrix as follows:
wherein, the coefficient took the plate thickness impact on areas into consideration, namely, is the ration of upper and lower sectional areas of the perforated plate, which could be 1 in the paper, .
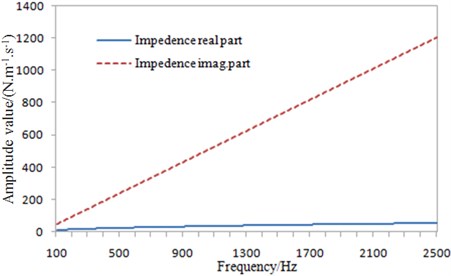
Various parameters were imported into the above equation, in order to obtain the acoustic impedance value at each frequency, as shown in Fig. 7. The reciprocal of the acoustic impedance was taken to obtain the corresponding admittance value.
Fig. 7Impedance of the perforated plate
3.4. The transmission loss of the perforated plate
Due to the smaller hole diameter of the perforated plate and denser elements, the finite element method took longer time. Therefore, the indirect BEM was applied for the numerical computation. As shown in Fig. 8, 12 plane waves were used in the simulation model as the excitation reverberation sound source.
Fig. 8Computational model of the transmission loss for the perforated plate
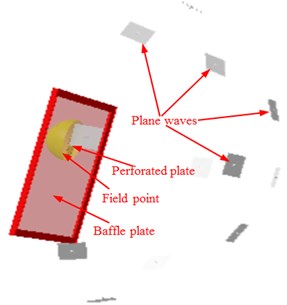
The battle was defined to simulate the rigid wall in the experimental window, and the mesh property of the boundary element on the incident side was defined as the transparent element for receiving acoustic excitation. The boundary element on the transmission side was coupled with the structural mesh, and the hemispherical field point mesh was used for receiving the sound power on that side. The tested damping loss factor and the computational admittance were imported into the acoustic model, in order to compute and obtain the incidence and transmission sound powers on both sides of the perforated plate. The computational result of the finite element model in Fig. 5 was also imported into VIRTUAL.LAB software to compute acoustics. The structural characteristics were mapped into the acoustic meshes to realize coupling between vibrations and acoustics. Finally, the transmission loss of the perforated plate could be obtained.
4. Experimental test on the transmission loss of the perforated plate
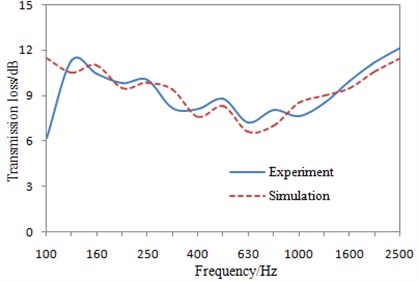
Experiments were necessary for verifying the simulation model of the perforated plate as it was relatively complex. The perforated plate was fixed in the windows among two reverberation chambers, as shown in Fig. 2(a). On one side, five sound pressure sensors were applied to test the incidence and transmission sound pressures, respectively, in order to obtain the transmission loss. The computational transmission loss by BEM was compared with that of the experimental, as shown in Fig. 9.
As can be seen from Fig. 9, the experimental and simulated results of the transmission loss had not only greater difference, but also reverse change trends when the analyzed frequency was below 125 Hz, which was mainly because sound insulation performance within this band was mainly determined by the boundary conditions. As the actual constraint state was complicated, the simulation was hard to be conducted accurately, thus resulting in the greater difference. The change trends and numerical values of the experimental and simulated results were close when the analyzed frequency was over 125 Hz. Generally speaking, sound insulation performance of the perforated plate could be predicted effectively by this method. Additionally, the transmission loss was so smooth because of two reasons. On one hand, Fig. 9 showed the computed transmission loss in 1/3 octave, where results of fixed frequency points were extracted, and the computational results were not equi-band. On the other hand, the perforated plate studied in the paper was 1.5 mm thickness, 1250 mm length and 1000 mm width. The cross section had a large size. In addition, the perforated plate had a smooth surface and lacked structures like reinforcing ribs. As a result, the perforated plate had few local modes. On the curve of the experimental transmission loss, it had few peak and valley. The curve was relatively smooth, which was consistent with the actual situation.
Fig. 9Comparison of the transmission loss between experiment and simulation
5. Impact factors of the transmission loss for the perforated plate
For the perforated plate, its sound insulation performance is primarily depended on the hole diameter, plate thickness and perforation rate. Therefore, these impact factors on sound insulation performance of the perforated plate were necessary to be studied.
5.1. Hole diameter
The thickness and perforation rate of the perforated plate were remained unchanged, namely, 1.5 mm and 1 %, but the hole size was changed. The transmission loss of the perforated plate with different hole sizes was obtained, as shown in Fig. 10.
Fig. 10Impacts of hole size on the transmission loss under 1/3 octave
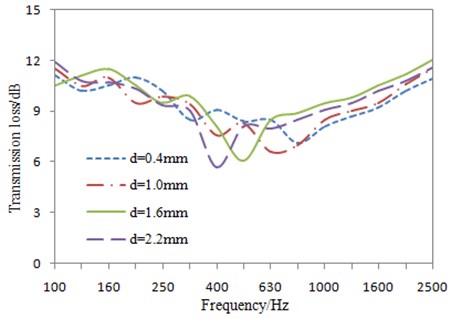
In Fig. 10, with the increased hole size, the sound insulation valley moved towards the low-frequency direction, and the amplitude decreased. When the analyzed frequency was more than that of the sound insulation valley, the transmission loss did not always increase with the increased hole diameter, which was mainly because the absorption characteristics of the perforated plate disappeared gradually when the hole size was more than a certain value.
5.2. Plate thickness
The hole size and perforation rate of the perforated plate were remained unchanged, namely, 1.0 mm and 1 %, but the plate thickness was changed. The transmission loss of the perforated plate with different plate thicknesses was obtained, as shown in Fig. 11.
Fig. 11Impacts of plate thickness on the transmission loss under 1/3 octave
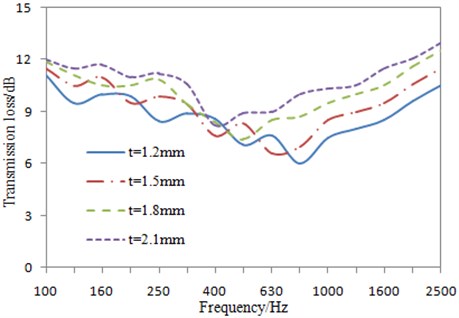
In Fig. 11, with the increased plate thickness, the sound insulation valley moved towards the low-frequency direction, and the amplitude increased. When the analyzed frequency was more than that of the sound insulation valley, the transmission loss increased with the increased plate thickness, which was mainly because the rigidity of the perforated plate could be improved to a certain degree due to the increased thickness, thereby reducing the radiated noise.
5.3. Perforation rate
The hole size and thickness of the perforated plate were remained unchanged, namely, 1.0 mm and 1.5 mm, but the perforation rate was changed. The transmission loss of the perforated plate with different perforation rates was obtained, as shown in Fig. 12.
Fig. 12Impacts of perforation rate on the transmission loss under 1/3 octave
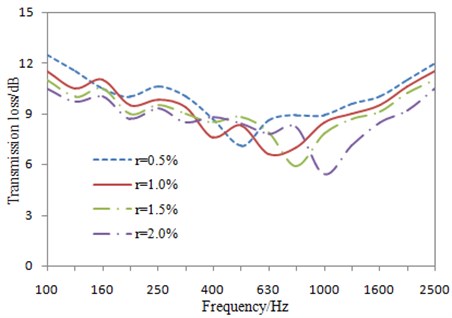
In Fig. 12, with the increased perforation rate, the sound insulation valley moved towards the high-frequency direction, and the amplitude was reduced. When the analyzed frequency was more than that of the sound insulation valley, the transmission loss decreased with the increased perforation rate, which was mainly because the rigidity of the perforated plate could be reduced due to the excessive perforation rate, thereby increasing the radiated noise.
6. Numerical optimization and application of the perforated plate
6.1. Numerical optimization of the perforated plate
As can be seen from the above analysis, the hole diameter, thickness and perforation rate of the perforated plate play an important effect on the transmission loss. However, it is necessary to conduct further researches regarding how to combine these parameters to obtain the optimal transmission loss. In the paper, the genetic algorithm is attempted to conduct the optimization design for the perforated plate:
In Eq. (15), is the total mass of the perforated plate. is the transmission loss of the perforated plate. is the hole diameter of the perforated plate. is the thickness of the perforated plate, and is the perforation rate of the perforated plate. The application of the genetic algorithm [19-23] is featured with the following necessities.
1) Many variables [24] of the perforated plate are constrained in the paper to conduct a multi-objective optimization [25] design. It is well known that the genetic algorithm has been widely used in the multi-objective optimization design. For example, the aerodynamic appearance of a rotor blade was designed by Liu through the genetic algorithm [26]. In addition, he has made an experimental test, the genetic algorithm was verified that in the multi-objective optimization, and it was effective.
2) In the traditional genetic algorithm, there are such disadvantages as low solution accuracy, easy precocity and poor partial optimization capacity. However, the solution for optimization can be reached 90 %. Nevertheless, in such process, it takes lots of time to do iterative computations. Inevitably, the efficiency will be reduced and computational cost will be increased. Based on the analysis for sensitivity, an improved genetic algorithm is proposed in the paper. In the process of iterative computations, the sensitivity is included, so that mutation and evolution can be continued along the dominated direction by the excellent individuals in a population [18, 19]. The effective improvement is found in terms of the searching ability of the algorithm and the increase of the convergence rate as well as computational efficiency is known.
3) With continuous maturity of some commercial software, good parameter transmission interfaces are set for different software. The commercial software can be seamlessly integrated into the ISIGHT software, and parameters can be analyzed into ISIGHT. Design parameters are modified and then a product model can be modified. Through the automatic manner, complicated and repeated work such as continuous modification and checking in traditional design can be reduced, and some tedious and complicated computation amounts can be avoided. With such method, design processes are integrated to a uniform framework; simulation software is operated automatically; and parameter data is modified automatically. Based on such operating principle, ISIGHT achieves digitalization and automation of the optimization design. During optimization with the ISIGHT optimization software, the improved genetic algorithm proposed by the paper is secondarily developed and implanted by ISIGHT. ISIGHT software will modify input parameters of all the integrated software, call solution software to solve them, read response results and finally judge whether the response results are optimal. If the optimal solution is obtained, the optimization program will be stopped, and optimization will be ended, otherwise parameters will be modified, responses will be solved and read again, and the program will be repeated till an ideal target function value is obtained.
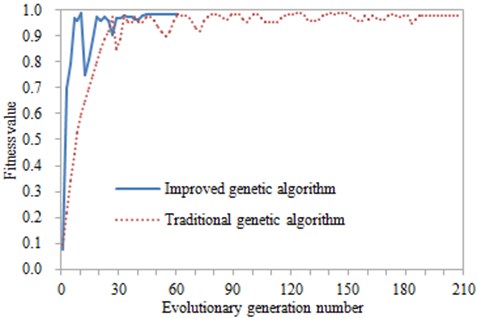
When the genetic algorithm is adopted for the optimization, the initial number of population is set to 45, the crossover rate is 0.95, and the mutation rate is 0.05. As an important parameter in the optimization design process, the fitness reflects the convergence speed of the genetic algorithm. The fitness, shown in Fig. 13, is changed with the evolutionary generation number. It can be seen that the fitness value is gradually stabilized when evaluates to the 60th generation. However, the fitness value in the traditional genetic algorithm is generally stabilized and the result is converged after evolving hundreds of generations. Therefore, it is indicated from this aspect that the improved genetic algorithm has obvious advantages in the multi-objective optimization design process.
Fig. 13Fitness values with the evolutionary generation number
Based on the improved genetic algorithm, the optimal performance and structural parameters of the perforated plate can be obtained finally, and they are compared with the original value as Table 1. It can be seen that the average transmission loss is improved by 1.1 dB, and the total mass is reduced by 1.0 kg, which achieves the requirements for low noises and light weight.
Table 1Comparison between the original value and optimized value
Parameter | Original value | Optimized value | Change percentage |
Hole diameter (mm) | 1.0 | 0.6 | –40.0 % |
Thickness (mm) | 1.5 | 1.3 | –13.3 % |
Perforation rate (%) | 1.0 | 1.5 | 50.0 % |
Average transmission loss (dB) | 10.5 | 11.6 | 10.5 % |
Total mass (kg) | 6.8 | 5.8 | –14.7 % |
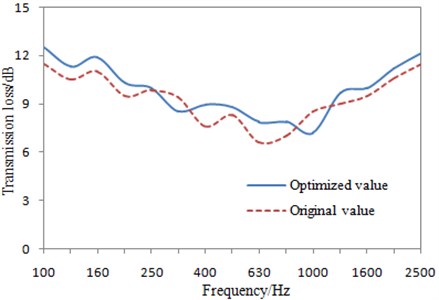
Based on the optimal structural parameters, the perforated plate is remodeled to compute the transmission loss in the frequency domain, which is compared with the original result, as shown in Fig. 14. It can be seen that the transmission loss is improved in the analyzed frequency band, indicating the effectiveness of the optimization design.
Fig. 14Comparison of the transmission loss before and after optimization
6.2. Application and verification of the optimized perforated plate in high-speed trains
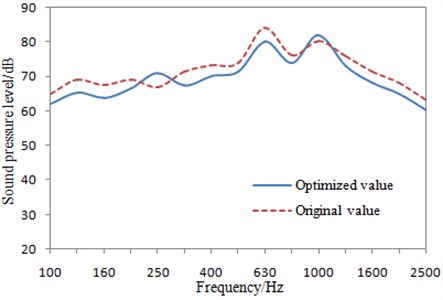
The designed perforated plate was manufactured and applied to the top plate of the high speed train, as shown in Fig. 15. The microphone was fixed by a black tube. Then, the high-speed train is running under the normal speeds. The experiment is conducted to test Sound Pressure Level (SPL) under one-third octave by microphones as shown in Fig. 16, which is compared with the original result as shown in Fig. 17. It can be seen that the optimized perforated plate has reduced by 3 dB in terms of SPL on the top, which plays a significant meaning for the interior noises.
Fig. 15Perforated plate applied on the top of a high-speed train
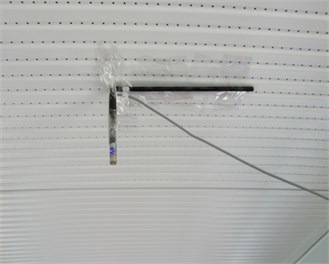
Fig. 16Experimental test on noises in the high-speed train
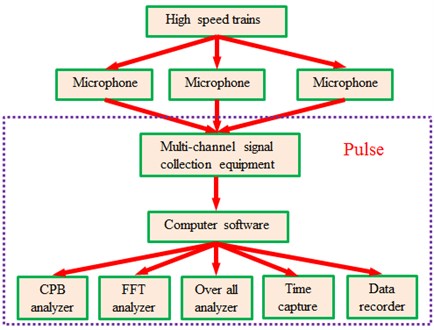
Fig. 17SPLs of the top for a high-speed train before and after optimization
7. Conclusions
1) The deficiencies of the traditional vibro-acoustic method for the radiation efficiency of the perforated plate are avoided, and the discrete element method is applied. As the experimental results are consistent with the theory, it showed that this method is feasible to test the acoustic radiation efficiency of the perforated plate.
2) The pulse decay method is applied to test the damping loss factor of the perforated plate. In addition, the transfer admittance is used to simulate the physical properties of the hole in order to obtain the numerical computation model of the perforated plate accurately.
3) Various physical parameters are imported into the perforated plate BEM, obtaining the computational value of the transmission loss. Then, it was compared with that of the experimental, and the results were consistent with each other. It showed that sound insulation performance of the perforated plate could be predicted by this simulation method effectively.
4) Based on the verified simulation model, the impact of the hole size, plate thickness and perforation rate on sound insulation performance of the perforated plate is analyzed. As indicated from the result, these parameters have some reasonable values rather than that the larger, the better, which provides a foundation for the optimization design of the perforated plate.
5) However, each structural parameter of the perforated plate can't be optimal currently. As a result, the optimization design was conducted based on the improved genetic algorithm. Finally, the perforated plate which had the optimal structural parameter and performance was obtained. Finally, the optimized perforated plate was applied on the high-speed train, and the experimental results showed that the interior noise of the high-speed train was reduced obviously.
References
-
Sheng S. W. Acoustic properties of perforated panels closely pasted with an absorptive thin layer. Technical Acoustics, Vol. 22, Issue 1, 2003, p. 52-54.
-
Wang Z. X., Qiao W. Y., Li W. L. Application of micro-porous to reducing exhaust noise of APU on MA60 aircraft. Journal of Aerospace Power, Vol. 18, Issue 3, 2003, p. 331-335.
-
Ma D. Q. General theory and design of micro perforated panel absorbers. Acta Acustica, Vol. 22, Issue 5, 1997, p. 385-393.
-
Liu K. Experimental investigation on sound absorption characteristics of micro perforated panel in diffuse fields. The Chinese Journal of Acoustics, Vol. 25, Issue 3, 2000, p. 211-218.
-
Lee D. H., Kwon Y. P. Estimation of the absorption performance of multiple layer perforated panel systems by transfer matrix method. Journal of Sound and Vibration, Vol. 278, Issue 4, 2004, p. 847-860.
-
Li M., Shu G. Q., Liang X. Y. Experimental research on radiation efficiency of the gear-cover of 4100QB diesel engine. Transactions of the Chinese Society of Agricultural Engineering, Vol. 26, Issue 12, 2011, p. 148-152.
-
Yang K., Yang J. Performance analysis of DF cooperative diversity system with OSTBC over spatially correlated Nakagami-m fading channels. IEEE Transactions on Vehicular Technology, Vol. 63, Issue 3, 2014, p. 1270-1281.
-
Wei W., Song H., Li W., et al. Gradient-driven parking navigation using a continuous information potential field based on wireless sensor network. Information Sciences, Vol. 408, 2017, p. 100-114.
-
Ding G., Tan Z. Indoor fingerprinting localization and tracking system using particle swarm optimization and Kalman filter. IEICE Transactions on Communications, Vol. 98, Issue 3, 2015, p. 502-514.
-
Wei W., Song H., Wang H., et al. Research and simulation of queue management algorithms in ad hoc network under DDoS attack. IEEE Access, 2017, https://doi.org/10.1109/ACCESS.2017.2681684.
-
Hashimoto N. Measurement of sound radiation efficiency by the discrete calculation method. Applied Acoustics, Vol. 62, Issue 4, 2001, p. 429-446.
-
Wang Z. F., Hu Y. M. Research on the transmission characteristics of underwater perforated-panel structure. ACTA Acoustic, Vol. 33, Issue 2, 2008, p. 184-190.
-
Maidanik G. Radiation efficiency of panels. The Journal of the Acoustical Society of America, Vol. 35, Issue 1, 1963, p. 115-115.
-
Bolduc M., Atalla N. Measurement of SEA damping loss factor for complex structures. The Journal of the Acoustical Society of America, 2008, Vol. 123, 5, p. 3060-3065.
-
Zhang H. L., Kong X. R., Liu Y. Test identification of damping loss factor in a wider frequency range. Journal of Vibration and Shock, Vol. 32, Issue 12, 2013, p. 179-184.
-
Chen X. R., Hao Z. Y., Yang C. Experimental study on damping performance of magnesium alloy AZ31. Journal of Zhejiang University (Engineering Science), Vol. 44, Issue 1, 2010, p. 19-22.
-
Kang Z. X., Ji Z. L. The acoustic thickness correction of perforated plate. The Chinese Journal of Acoustics, Vol. 33, Issue 4, 2009, p. 327-333.
-
Ruan J. H., Wang X. P. Optimizing the intermodal transportation of emergency medical supplies using balanced fuzzy clustering. International Journal of Production Research, Vol. 54, Issue 14, 2016, p. 4368-4386.
-
Du J., Xiao P. Design of isotropic orthogonal transform algorithm-based multicarrier systems with blind channel estimation. IET Communications, Vol. 6, Issue 16, 2012, p. 2695-2704.
-
Hu H. G. New constructions of codebooks nearly meeting the Welch bound with equality. IEEE Transactions on Information Theory, Vol. 60, Issue 2, 2014, p. 1348-1355.
-
Shi Q. J., Wu J. S., Chen Q. C., et al. Optimum linear block precoding for multi-point cooperative transmission with per-antenna power constraints. IEEE Transactions on Wireless Communications, Vol. 11, Issue 9, 2012, p. 3158-3169.
-
Xiao P., Wu J. S., Cowan C. F. N. MIMO detection schemes with interference and noise estimation enhancement. IEEE Transactions on Communications, Vol. 59, Issue 1, 2011, p. 26-32.
-
Luo Q. L., Fang W. Reliable broadband wireless communication for high speed trains using baseband cloud. EURASIP Journal on Wireless Communications and Networking, Vol. 2012, 2012, p. 1-12.
-
Wei W., Fan X., Song H., et al. Imperfect information dynamic stackelberg game based resource allocation using hidden Markov for cloud computing. IEEE Transactions on Services Computing, 2016, https://doi.org/10.1109/TSC.2016.2528246.
-
Liu Z. F., Zhou Z. K., Deng Z. C. Optimal design on 20 kW constant-pitch wind turbine blades. Transactions of the Chinese Society of Agricultural Machinery, Vol. 42, Issue 5, 2011, p. 121-124.
About this article

This work was financially supported by the National Natural Science Foundation Guidance Project of Liaoning Province (No. 201602650), and the Scientific Research Project of Department of Education of Liaoning Province (No. L2015469), and the Open Foundation Project of Provincial Level Key Laboratory of Shenyang Ligong University (No. 4771004kfs26).
