Abstract
Transmission loss of a glass window was measured in this paper by means of sound pressure method and sound intensity method. Test results of two methods were consistent with each other, which could avoid some errors in experiment effectively. As a result, the verification of the subsequent acoustic simulation was thus guaranteed. Then, damping loss factor of the glass window was measured by pulse decay method and imported into an AML model to calculate transmission loss of simulation. The simulation result was consistent with the experimental one by comparison, which showed that AML method was feasible to predict transmission loss of the glass window. Then, influence factors on sound insulation performance for the glass window were analyzed from multiple aspects. Then, the laminated mid-hollow glass window filled with Argon which had better sound insulation performance was obtained. It was a new type glass window currently. However, each structural parameter of the new type glass window can’t be optimal currently. As a result, optimization design was conducted on it based on genetic algorithm. Finally, the new type glass window which had the optimal structural parameter and performance was obtained. This research can also provide certain guidance for design of the other type glass window.
1. Introduction
With improvement of the living level, people have paid more and more attention to noise and vibration. Glass windows were widely used in industries such as construction and transportation. The glass window had a worse sound insulation performance when it was compared with the main structure which was used to install the glass window. Therefore, sound insulation performance of the entire structure always depended on the glass window. Design of a low noise glass window will be very important.
Most researches about sound insulation performance of glass window were conducted separately based on experiment, theory or simulation. Wu conducted theoretical research of transmission loss for the single-layer glass window [1]. He found that transmission loss around low frequency would show an unstable vibration. Moreover, transmission loss would decrease to less than 10 dB in some special frequencies. In order to increase transmission loss under low frequencies, glass layers could be added. Yue proposed that structural type of a glass window would influence sound insulation performance of a passenger train to a certain extent, and he then verified the conclusion by experiment [2]. Buratti evaluated sound insulation performance of a wooden window by means of the artificial neural network [3]. Langer analyzed sound insulation performance of glass window by coupling boundary element method and finite element method [4].
However, the mentioned researches were not enough comprehensive, and all of them studied sound insulation performance of single-layer or double-layer glass window from a single perspective such as experiment, theory or simulation. The laminated mid-hollow glass window was not researched systematically, and optimization analysis of glass window was rarely researched. As a result, the paper systematically researched sound insulation performance of glass window by combining experiment with simulation and also comprehensively analyzed the influence factors. Finally, the laminated mid-hollow glass window with filling Argon which had the optimal transmission loss was proposed and optimized. It could provide certain guidance for design of the low noise glass window.
2. Experiment of sound insulation performance for the glass window
Fig. 1(a) showed one-third octave band of sound pressure level for one point in a sound production room. It was shown in the figure that a good reverberation effect could be formed in the room in 100 Hz-1600 Hz, which could satisfy the requirement for the difference value of 6 dB. Fig. 1(b) showed one-third octave band of work noise and background noise for one point in a reception room. It was shown in the figure that work noise in the reception room greatly exceeded the background noise, which satisfies the requirement for difference value of 15 dB. Therefore, the background noises need not to be amended. In addition, the environmental temperature and relative humidity of the reception room during experiment were 22 °C and 66 %, respectively.
Fig. 1Experiment environment of transmission loss
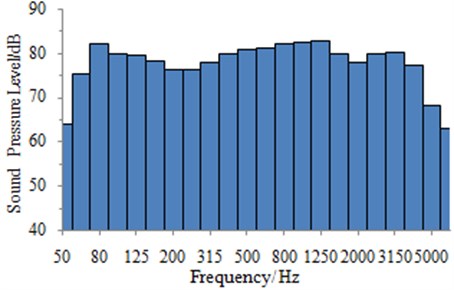
a) Uniformity of sound production room
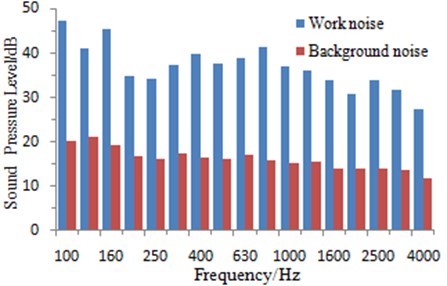
b) Comparison between work noise and background noise in the reception room
Transmission loss was defined as the ratio between an incidence sound power and a transmission sound power . Then, the ratio was taken as logarithm multiplied by 10 [5]:
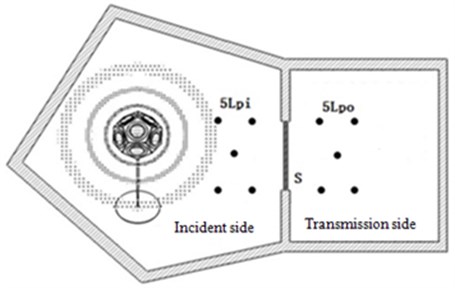
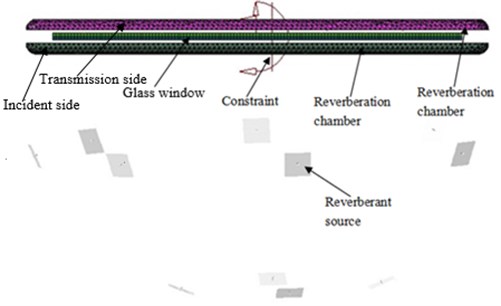
As shown in Fig. 2, the glass window to be tested was fixed on window between two reverberation chambers. Window clearance was filled with oil sludge. In order to avoid errors in experiment, transmission loss was measured by means of sound pressure method and sound intensity method, respectively. In this way, the feasibility verification of the subsequent simulation method was guaranteed to a certain extent.
Fig. 2Experiment of transmission loss
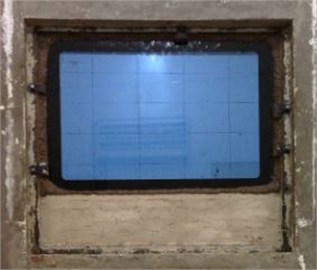
a) Reverberation chamber in the incidence side
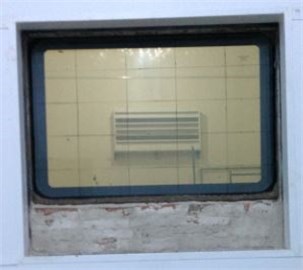
b) Reverberation chamber in the transmission side
2.1. Sound pressure method
where was the mean value of sound pressure level in the incidence side reverberation chamber. was the mean value of sound pressure level in the transmission side reverberation chamber. was the single-side surface area of the wooden component to be tested. was sound absorption of the transmission side reverberation chamber.
According to ISO354 [6], the sound absorption can be calculated by Sabine formula:
where was volume of reverberation chamber. was reverberation time.
Fig. 3The test schematic diagram of sound pressure method
According to size of the reverberation chamber, four microphones were arranged symmetrically for the tested specimen, respectively. In order to observe uniformity of the diffuse sound field, another microphone was added in the center of four microphones, as shown in Fig. 3. During experiment, a pink noise source was installed in the incidence side reverberation chamber. Sound pressure levels at each microphone were measured synchronously after forming a stable reverberation effect. Each set of data was recorded for 8 s and measured for 3 times with sampling frequency of 65536 Hz. Finally, the average sound pressure level of five points was taken as the incidence and transmission sound pressure levels.
Reverberation time was then measured. Positions of microphones in the transmission side were kept unchanged, and the same pink noise source was then installed. During experiment, the pink noise of 3 s was given at first. When the sound source stopped to generate sound, decay course of sound pressure level was immediately measured. Each set of data was recorded for 8 s and measured for 3 times with sampling frequency of 65536 Hz. Reverberation time was substituted into Eq. (3) to obtain the sound absorption.
The incidence and transmission sound pressure levels and the sound absorption obtained in experiment were substituted into Eq. (2) to obtain transmission loss of the wooden component.
2.2. Sound intensity method
In order to verify accuracy of sound pressure method, experiment was also conducted by sound intensity method. The average sound pressure level of five points was measured in the incidence side, and test course was similar to sound pressure method. A sound intensity probe was used to scan the radiation face of specimen in the near sound field to obtain the radiation sound intensity in the transmission side. Calculation formula of transmission loss with the sound intensity method was as follows:
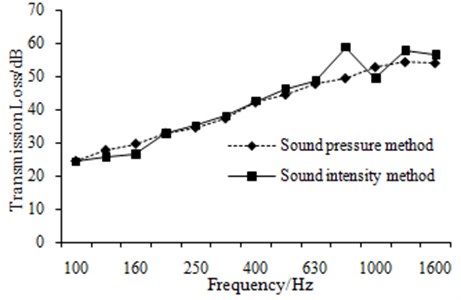
Transmission loss obtained by two test methods was compared in Fig. 4.
It was shown in Fig. 4 that results obtained by different test methods had a very good consistency. This indicated that no error existed during experiment, and the experimental results were reliable and could be used to verify the subsequent acoustic simulation.
Fig. 4Comparison of transmission loss with two methods
3. Simulation of sound insulation performance for the glass window
Damping loss factor was measured to simulate the real condition accurately, and then it was imported into simulation model to calculate transmission loss.
3.1. Test of damping loss factor
Damping loss factor was defined as the ratio between the energy loss caused by the system damping characteristic and the total system storage energy. It was made of three independent loss factors as follows [7]:
where was a structure loss factor which was caused by the inner friction of the system material. was a loss factor formed by sound radiation damping of system vibration. was a loss factor which was caused by the connection damping of system boundary.
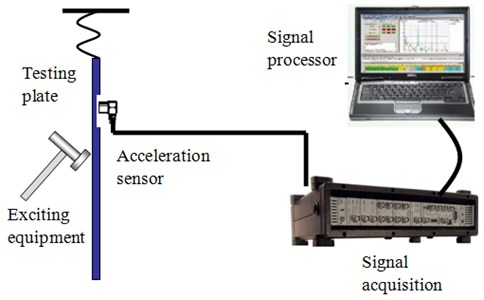
In the experiment, Pulse decay method [8, 9] was selected to measure damping loss factor of specimen, and the schematic diagram of test was shown in Fig. 4. The rectangular thin plate would have a bent vibration when it was applied a horizontal force, and the vibration equation could be written as follows [10, 11]:
where was a special solution under the given excitation force. was angular frequency of simple harmonic vibration under mode. Phase angle and coefficient were determined by the initial conditions of the thin plate. was a corresponding decay factor.
A vibration acceleration sensor was used to measure vibration information of the thin plate. As for a given vibration mode, the acceleration signal showed a exponential decay, while was slope of decay curve envelope line.
In the post-processed, the acceleration signal was conducted FFT transformation to obtain angular frequency of each simple harmonic vibration. Butterworth band-pass filter was used to separate corresponding free damping vibration under each simple harmonic vibration mode as follows:
The new signal was obtained by conducting some transformations as follows:
Fig. 5Schematic diagram of test devices for damping loss factor
Finally, polynomial fitting was conducted to time domain curve of the new signal. And the corresponding decay factor was confirmed by slope of the fitting curve. Further, damping loss factor of specimen was obtained as shown in Eq. (9):
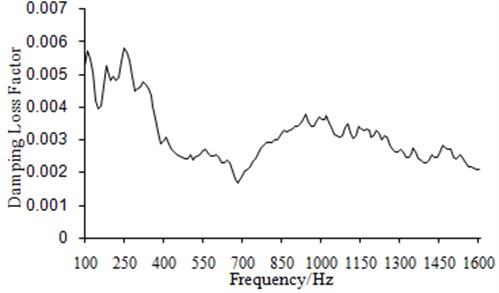
In the experiment, six test points and thirty hammering points were selected, respectively. Vibration decay at each test point was recorded for 10 s each time. Recording was conducted for 3 times in total, and sampling frequency was 16384 Hz. Test devices were shown in Fig. 5, and damping loss factor of the glass window was shown in Fig. 6.
Fig. 6Damping loss factor of the glass window
3.2. Establishment of simulation model
As can be seen from Fig. 7, AML method was applied to calculate sound insulation performance of the glass window. On both sides of the glass window, convex sound cavities were established to simulate the reverberation chambers in the experiments. The tetrahedral element mesh was used in both convex sound cavities, while the hexahedral element mesh was adopted by the glass window. In this model, there were 153,201 elements and 148,953 nodes. Then, the glass window was applied a certain constraint boundary conditions to simulate the experimental situation. 1 Pa sound source is applied on one side of two convex sound cavities of the glass window, which is defined as the incident side. And the other side is defined as the transmission side.
Fig. 7AML model of sound insulation performance for glass windows
Then, the surfaces are extracted close to the glass windows of the incident side and the transmission side and mapped onto the corresponding surfaces of glass windows, in order to achieve coupling between the glass window structure and sound cavity. The sound insulation performance of the glass window itself was mainly researched in this paper to conduct its optimization analysis. When the sound insulation performance was improved and the sound source at the incident side remained unchanged, the radiated noise at the transmission side will be reduced regardless of in the near field or far field. Therefore, the near-field and far-field radiation noises of the glass window were not researched separately.
Transmission loss of simulation calculation was compared with the experimental one as shown in Fig. 8.
It was shown in Fig. 8 that simulation result was consistent with that of sound pressure method in the whole frequency band. The maximum differential value did not exceed 3 dB. With sound intensity method, transmission loss of the glass window had a large fluctuation in the frequency band of 800 Hz-1000 Hz. This might be caused by that the sound intensity probe was moved back and forth during experiment, as a result, the probe got in contact with the glass window and caused experiment error. Finally, the experimental result differed much from simulation one. As a whole, it was feasible to predict sound insulation performance of the glass window by structural-acoustic coupling method.
Fig. 8Comparison of transmission loss between simulation and experiment

4. Analysis on influence factors of sound insulation performance
4.1. Change of thickness for the external glass
Total thickness of glass on both sides was kept unchanged, and three combinations which were 3 mm+7 mm, 4 mm+6 mm, and 5 mm+5 mm were selected to research sound insulation performance of the glass window. The side with larger thickness was defined as the incidence side, while the other side with smaller thickness was defined as the transmission side. Comparison of transmission loss curves was shown in Fig. 9.
Fig. 9Curves of transmission loss under different glass-layer thicknesses
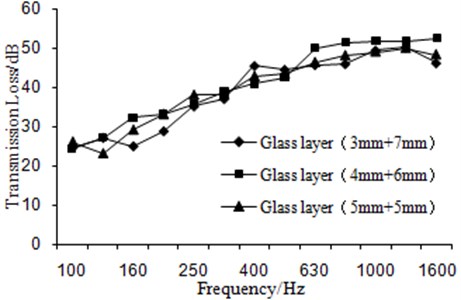
It was shown in Fig. 9 that transmission loss of the glass window had a great change, under different combinations. Transmission loss tended to decrease when the frequency exceeds 1250 Hz for 3 mm+7 mm and 5 mm+5 mm, while 4 mm+6 mm still tended to increase. Then, the total transmission loss of the glass window under three combinations was calculated, and the corresponding results were 31.9 dB, 32.3 dB and 32.8 dB, respectively. This showed that the combination of 4 mm+6 mm had the optimal sound insulation performance. In addition, two layers of glass were designed to be different thickness to avoid the mutual transmission loss trough. In this way, sound insulation performance of the whole structure could be improved. As a result, double-layer hollow glass with different thicknesses was generally adopted when we designed the low noise glass window.
4.2. Change of thickness for air layer
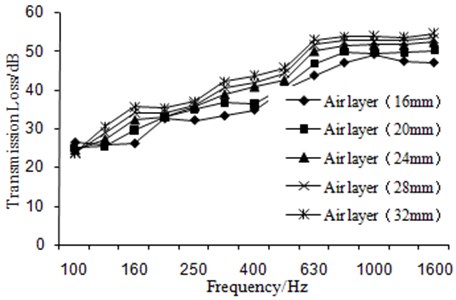
By changing the air layer thickness from 16 mm to 32 mm and setting step length as 4 mm, curves of transmission loss under each parameter were obtained as shown in Fig. 10.
It was shown in Fig. 10 that transmission loss gradually increased with increase of the air layer thickness. This was mainly because that thickness increase will decay sound energy during transmission to a greater extent. As a result, the transmission sound energy would decrease, and then transmission loss would increase. However, when the thickness increased to a certain extent, the improvement effect was not very obvious. Hence, in order to improve sound insulation performance greatly. The most proper air layer thickness should be selected for the glass window according to the actual situations.
Fig. 10Transmission loss under the different air layer thickness
4.3. Change of property for the filled gas
Air layer was changed into Helium and Argon to obtain curve of transmission loss as shown in Fig. 11.
It was shown in Fig. 11 that transmission loss of Helium was slightly lower than that of air in some frequency bands, while transmission loss of Argon was obviously higher than that of air. This was because that air was mainly constituted of Nitrogen and Oxygen. Their atoms were relatively smaller than those of Argon. As a result, when sound passed by those gases, Argon could reflect sound better to reduce transmission sound and then obviously increase sound insulation performance. In addition, Argon was also a common gas in air. Hence, sound insulation performance of the whole glass window could be improved further by filling Argon.
4.4. Change of structural type for the external glass
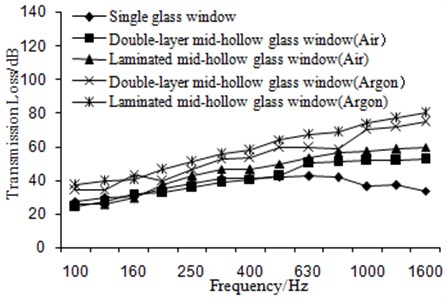
In the mentioned analysis, the external glass of glass window was composed of the single layer glass as shown in Fig. 12(b). Hence, it was necessary to replace the external glass by the laminated glass to research its sound insulation performance, as shown in Fig. 12(c).
Fig. 11Transmission loss under the different filled gases
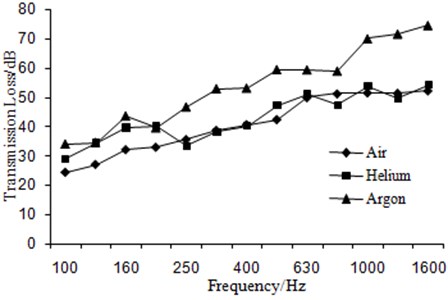
Fig. 12Several glass windows with different structures
a) Only glass window
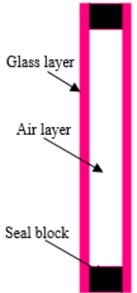
b) Double-layer mid-hollow glass window (air)
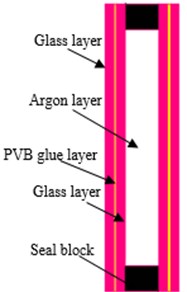
c) Laminated mid-hollow glass window (argon)
The laminated glass was consisted of the single layer glass and a PVB glue layer. PVB was used to adhere the single layer glass, and its elastic modulus was not a constant value in frequency domain. Changes of its amplitude and phase angle were shown in Fig. 13.
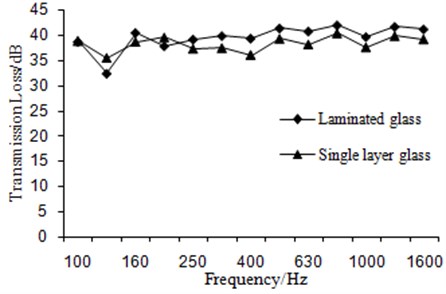
The elastic modulus of PVB glue was then imported into AML model to calculate transmission loss of the laminated glass. And the result was compared with that of the single layer glass with the same thickness, as shown in Fig. 14.
It was shown in Fig. 14 that the sound insulation performance of the laminated glass was obviously better than that of the single layer glass in the whole analysis frequency band. This was mainly because that the PVB glue layer in the middle could decay vibration and block sound transmission very well. As a result, the sound insulation performance could be improved. Hence, it was necessary to replace the external glass of the glass window by the laminated glass.
The total thickness of the laminated glass and PVB layer was unchanged. By changing thicknesses of glass on both sides, transmission loss under different operation conditions were obtained as shown in Fig. 15.
It was shown in Fig. 15 that the laminated had a better sound insulation performance when the glass thickness glass on both sides was 3 mm and 2 mm, respectively. This was mainly because that the mutual sound insulation trough could be effectively avoided under different glass thickness, as a result, curve of transmission loss became gentler. However, the sound insulation performance became worse for the combination of 4 mm+1 mm, because the glass layer of 1mm was relatively too thin and coupling might easily take place. Therefore, radiation noise would be more serious to make sound insulation performance become worse.
Fig. 13Change of PVB elastic modulus
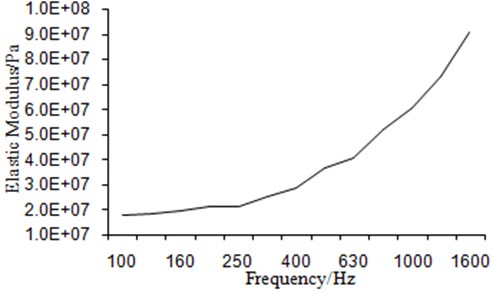
a) Amplitude of PVB elastic modulus
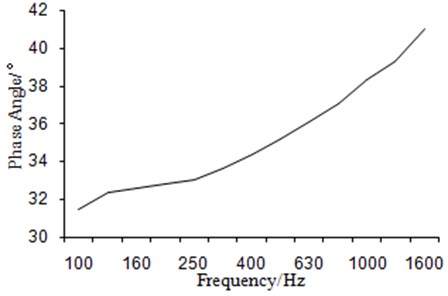
b) Phase angle of PVB elastic modulus
Fig. 14Comparison of transmission loss for two types of glass
The external glass of the double-layer hollow glass window in the previous analysis was replaced by the laminated glass with combination of 3 mm+1 mm+2 mm. Its transmission loss was calculated and compared with the previous results, as shown in Fig. 16.
It was shown in Fig. 16 that sound insulation performance of the laminated mid-hollow glass window filled with Argon was better than that of other structures. Hence, it was feasible to manufacture such glass window to improve sound insulation performance greatly in actual application.
Fig. 15Comparison of transmission loss for the laminated glass under the different glass thicknesses
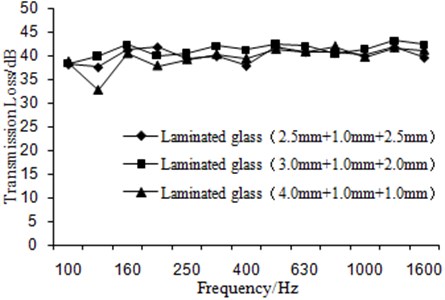
Fig. 16Comparison of transmission loss for the different hollow glass window
5. Optimization of sound insulation performance
According to the above analysis, the laminated mid-hollow glass window filled with Argon had the best sound insulation performance in many kinds of glass windows. However, it was only the initial research for the new type glass window in the above analysis. In order to make the new type glass window realize the optimal sound insulation performance, it was very necessary to research the combination of each structural parameter. As a result, optimization design was then conducted on the new type glass window:
In Eq. (10), was thickness of glass layer, was thickness of PVB glue layer, and was thickness of thickness of the other glass layer. was the total mass of the glass window, and was the average sound insulation performance. During optimization design, the maximum average sound insulation performance and the minimum mass were the optimization objectives. The filled Argon had a better stability and was obtained easily. As a result, the filled gas can be determined. Finally, thickness of the glass layer, PVB glue layer and the filled gas was set as the constraint variables.
Genetic algorithm was used in the paper for optimization design of the glass window. Its necessity can be explained from the following aspects.
1) Multiple constraint variables were considered in the paper, and then the multi-objective optimization design was carried out to the glass window. An absolute optimal solution could hardly be found for the multi-objective optimization problem. In general, multiple Pareto optimal solutions were obtained and form an assembly. In addition, evolutionary operations were carried out to the whole group by genetic algorithm, and an assembly of individuals was processed. Because of such similarity, genetic algorithm became an effective method to obtain Pareto optimal solution of a multi-objective problem. Genetic algorithm was widely used in the corresponding field. For example, the genetic algorithm was used by Liu to redesign aerodynamic appearance of a rotor blade, and experiments were conducted to verify the optimized structure [12]. As a result, effectiveness of genetic algorithm in multi-objective optimization of was verified. Genetic algorithm was also used by Crossley to research the multi-objective optimization design problem with the minimum mass and required power.
2) Some defects existed in the traditional genetic algorithm, such as easy precocity, poor partial optimization capacity, and low solution accuracy. The solved result can quickly reach about 90 % of the optimal solution. However, in order to reach the optimal solution, a lot of time was always needed for the iterative computations, which will undoubtedly increase the computational cost and reduce efficiency. The paper put forward an improved genetic algorithm based on sensitivity analysis. Sensitivity amendment steps were added during the iterative computations of genetic algorithm. In this way, the excellent individuals in a population can continue mutation and evolution along the assigned direction. Searching ability of the algorithm was effectively improved, and convergence rate as well as calculation efficiency was increased.
Based on the genetic algorithm, optimization design was conducted to the new type glass window based on the improved genetic algorithm, and the detailed process is shown as follows.
1) Encoding chromosomes: the total weight and sound insulation performance of the new type glass window were encoded into a binary string with a constant length based on the improved genetic algorithm, namely a chromosome. The different search points in the search space were constituted by the different combinations of these strings.
2) Generating the initial population: size of the initial population was set to be 40.
3) Calculating fitness value: selection of fitness value will directly influence convergence rate of the improved genetic algorithm and the possibility to find the optimal solution. Fitness value was generally a positive number. As for the problem about maximization, fitness value was always the objective function. On the contrary, as for the problem about minimization, fitness value was the negative number of the objective function.
4) Selection: individuals of which fitness value was stable during evolution were selected.
5) Crossover: the partial chromosomes among the selected 40 individuals were exchanged at a certain probability. In this way, 40 new individuals of sub-generation were generated. The crossover probability was set to be 0.92.
6) Mutation: 40 selected individuals were mutated at a given probability to generate a new population. The mutation probability was 0.05 in this paper.
7) Sensitivity analysis: sensitivity analysis was carried out to the mutated individuals. If the sensitivity requirement was satisfied, the new individuals could be generated. Otherwise, step 6 would be re-started. Mutation operators which did not meet requirements could be rapidly eliminated by adding sensitivity analysis in the improved genetic algorithm. Therefore, the calculation frequency was increased.
8) Judgment: whether the new population could meet constraint conditions was judged, in this way, the optimal results can be found. If the new population did not meet constraint conditions, the step was stopped. Otherwise, step 3 will be started again.
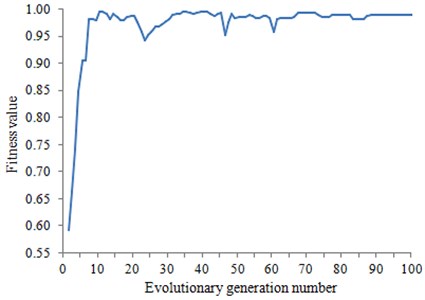
Fitness was taken as an evaluation index for convergence of genetic algorithm. The change curve of fitness with the evolutionary generation number during optimization was shown in Fig. 17. According to this figure, the fitness has tended to be stabilized when the evolution developed to the 100th generation. As a result, the calculation results were convergent.
Fig. 17Change curve of fitness with the evolutionary generation number
Finally, the optimal performance and structural parameter of the new type glass window can be obtained by means of genetic algorithm. And they were then compared with the original values, as shown in Table 1. It was shown in Table 1 that sound insulation performance has improved 2.7 dB and the total mass has reduced 3.9 kg after optimization design. In other words, it indicated that the optimized glass window has realized low noise and lightweight.
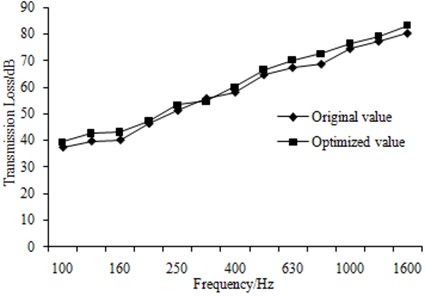
In order to research influence which was from optimization design on sound insulation performance in the whole frequency band further, simulation model of sound insulation performance was built by using the optimized structural parameter. And then, sound insulation performance was compared with the original value, as shown in Fig. 18.
Table 1Comparison of structural parameter and performance before and after optimization
Parameter | Original value | Optimized value |
Thickness of glass layer (mm) | 3.0 | 2.6 |
Thickness of PVB glue layer (mm) | 1.0 | 1.1 |
Thickness of glass layer (mm) | 2.0 | 2.2 |
Thickness of the filled gas (mm) | 24.0 | 22.7 |
Average sound insulation performance (dB) | 58.5 | 61.2 |
Total mass (kg) | 102 | 98.1 |
It can be seen from Fig. 18 that sound insulation performance in the whole frequency band was obviously improved after optimization. In addition, sound insulation performance of the optimized was smoother than that of the original. It was mainly because that the optimal combination of structural parameter was can be obtained by means of genetic algorithm. As a result, the coupled vibration between each layer was effectively avoided.
Fig. 18Comparison of sound insulation performance before and after optimization
6. Application of the new type glass window in the high-speed train
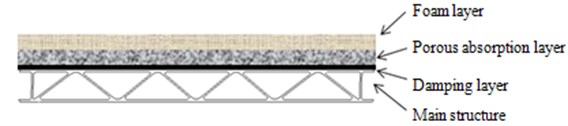
As shown in Fig. 19, the main structure of the high-speed train will be covered some other structures. Damping layer was applied on the surface of the main structure, and then through the porous absorption layer, it was finally connected with foam layer. Therefore, the sound insulation performance regarding the main structure of the high-speed train was more superior. However, as many glass windows are installed in each compartment of the high-speed train, the interior noise will be directly affected by the sound insulation performance of glass windows.
Fig. 19The covering layer structure of the main structure
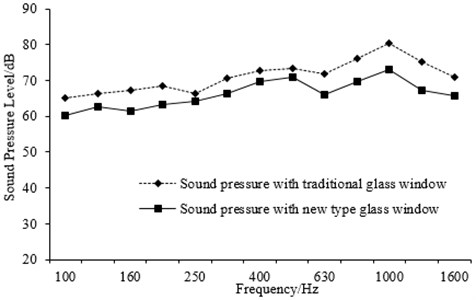
The structure shown in Fig. 12(b) is usually applied in the glass window of the high-speed train. As seen from the paper, its sound insulation performance was significantly lower than the new type structure in Fig. 12(c). Thus, the interior noise was tested again after replacing the traditional glass window with the new one in the high-speed train, as shown in Fig. 20. When the wind speed was less than 2 km/h, the noises in the high-speed train were tested. Pulse software which was made by B&K Company was used to test noise of the high-speed train. MPA 201 microphone was adopted to obtain the original signals, as shown in Fig. 21(a). Multi-channel collection equipment was used to obtain signals of microphone, as shown in Fig. 21(b). Finally, the experimental results were compared with the original results in Fig. 22. As can be seen from Fig. 22, the interior noise of the high-speed train was significantly improved within the entire band after applying the new type glass windows.
Fig. 20Testing point of the interior noise in the high-speed train
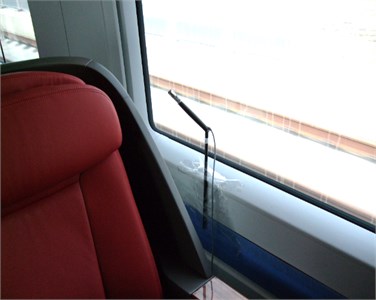
Fig. 21Experimental equipment
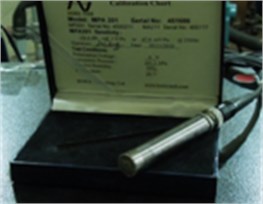
a) MPA201 microphone
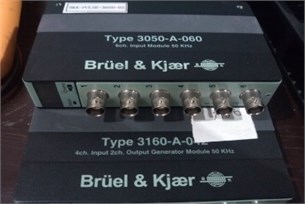
b) Signal collection equipment
Fig. 22Comparison of the interior noise in one third octave before and after using the new glass window
7. Conclusions
1) Transmission loss of a glass window was measured in this paper by means of sound pressure method and sound intensity method. Test results of two methods were consistent with each other, which could avoid some errors in experiment effectively. As a result, the verification of the subsequent acoustic simulation was thus guaranteed.
2) Damping loss factor of the glass window was measured by pulse decay method and imported into an AML model to calculate transmission loss of simulation. The simulation result was consistent with the experiment one by comparison, which showed that AML method was feasible to predict transmission loss of the glass window.
3) Influence factors on sound insulation performance for the glass window were analyzed from multiple aspects. Then, the laminated mid-hollow glass window filled with Argon which had better sound insulation performance was obtained. It was a new type glass window currently.
4) However, each structural parameter of the new type glass window can't be optimal currently. As a result, optimization design was conducted on it based on genetic algorithm. Finally, the new type glass window which had the optimal structural parameter and performance was obtained. This research can also provide certain guidance for design of the other type glass window.
5) Finally, the optimized glass window was applied on the high-speed train, and the experimental results showed that the interior noise of the high-speed train was improved obviously.
References
-
Wu Y., Zhang X. Analysis of sound transmission loss of single window. Journal of Vibration and Shock, Vol. 24, Issue 6, 2005, p. 102-105, (in Chinese).
-
Yue Y., Liu J. Effect of structure type of window glass on railway passenger cars on sound insulation. Rolling Stock, Vol. 33, Issue 10, 2000, p. 18-20.
-
Buratti C., Barelli L., Moretti E. Application of artificial neural network to predict thermal transmittance of wooden windows. Applied Energy, Vol. 98, 2012, p. 425-432.
-
Langer S., Antes H. Analyses of sound transmission through windows by coupled finite and boundary element methods. Acta Acustica United with Acustica, Vol. 89, Issue 1, 2003, p. 78-85.
-
Du G., Zhu Z., Gong X. Basics Acoustic. The Press of Nanjing University, 2001.
-
Acoustics – Measurement of Sound Absorption in a Reverberation Room. ISO 354:2003, 2003.
-
Chen X. Research on Analysis and Control of Car Interior Noise Based on SEA Method. The Institute of Automotive Engineering, Jilin University, 2008, (in Chinese).
-
Bolduc M., Atalla N. Measurement of SEA damping loss factor for complex structures. The Journal of the Acoustical Society of America, Vol. 123, Issue 5, 2008, p. 3060-3060.
-
Zhang H., Kong X., Liu Y., et al. Test identification of damping loss factor in a wider frequency range. Journal of Vibration and Shock, Vol. 32, Issue 12, 2013, p. 179-184, (in Chinese).
-
Zhao Y., Sheng S. Measurement of attenuation factors for damped vibration of thin-shell structures. Journal of Tongji University, Vol. 30, Issue 7, 2002, p. 900-903, (in Chinese).
-
Morse P. Theoretical Acoustics. Princeton University Press, 1986.
-
Liu G. Q. The Shape Design of the Rotor Blade for Helicopter Based on Genetic Algorithm. Nanjing University of Aeronautics and Astronautics, Nanjing, 2011.
About this article

This work was financially supported by the Open Foundation Project of Provincial Level Key Laboratory of Shenyang Ligong University (No. 4771004kfs26).
