Abstract
Based on back-propagation (BP) artificial neural network (ANN) technique, interior sound quality evaluation model of heavy commercial vehicles(HCV) was designed in this paper. According to the standard named GB/T18697-2002, firstly, the interior noises of five different types of HCV under different working conditions were measured and collected. Secondly, the subjective evaluation of sound quality was estimated by jury tests following the magnitude estimation. Meanwhile, seven objective psycho-acoustical parameters of these samples were calculated. Using the objective and subjective evaluation results, furthermore, the sound quality prediction model of HCV was developed based on BP ANN. Thirdly, this model was proved by some verification tests. The results suggest that the proposed model has ability of high precision and good generalization. And lastly, the sound quality prediction model of HCV could be used to determine the impact weight of measuring objective evaluation parameters contributing to the results of subjective evaluation. The results played a significant guiding role in both HCV and other areas for sound quality evaluation and analysis.
1. Introduction
Commercial vehicle market maintained a sustained and rapid growth in the past decade. Customers are not only expecting commercial vehicles to be reliable, economical and powerful, but also to sound comfortable [1, 2]. Noise, Vibration and Harshness (NVH) characteristics are becoming one of the key attributes in today’s competitive commercial vehicle markets [3, 4]. The sound quality (SQ), a direct impact on consumers’ purchasing desire and competitiveness of the automobile manufacturers, is an important part of the NVH performance. Evaluation of the sound quality inside vehicles has become a very important task for the acoustic engineers since more than 20 years [5]. SQ engineers are currently focusing their attention on developing prediction model to evaluate the SQ as part of the NVH testing procedure.
At the present time, most of the sound quality evaluation model was a linear model [6-8]. That was simply the relationship between subjective evaluation and objective psycho-acoustical evaluation parameters were built by the linear regression method, and the interior sound quality evaluation model of vehicle was set up [9]. However, the subjective evaluation process of ear to sound is influenced by many complex factors, which leads to the influence above the objective psycho-acoustical evaluation parameters to subjective feeling is nonlinear [10]. It usually could not reach the ideal accuracy. Artificial neural network (ANN) is a kind of method widely used in vehicle engineering [11-14]. Using artificial neural network method to simulate the evaluation model through linear approximation process of subjective evaluation, sound quality evaluation model can be established [15-17]. It has nonlinear relationship between the objective psycho-acoustical evaluation parameters and subjective evaluation, and many excellent properties such as a neural network self-learning, adaptive end good fault tolerance, etc. [18]. These merits are what other existing linear model does not have.
Using BP ANN technique, a sound quality evaluation model of heavy commercial vehicles (HCV) interior noise was designed in this paper. The interior noises of five types of HCV in different speed were measured and saved. Annoyance scores of subjective feeling were obtained by subjective evaluation experiment for interior noises. Meanwhile, seven psycho-acoustical objective parameters of noises were calculated. Then based on above results, sound quality evaluation prediction analysis model of vehicle interior noise was established using the BP ANN. Finally, the weight algorithm of the neural network between the input and output was proposed to determine the impact weight calculating objective evaluation parameters contributing to the results of subjective evaluation. This analysis played a significant guiding role in both HCV and other areas for sound quality evaluation and analysis. It also can provide the basis for improving and enhancing the electric vehicle sound quality.
2. Vehicle interior sound measurements
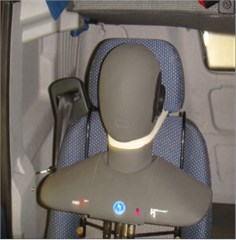
Five different types of HCV were taken as the test vehicles. The test vehicles investigated in this study are shown in Table l, all test vehicles were powered by diesel engines. The interior sounds of the test vehicles were recorded with a binaural head system made by Head Acoustics Company in Germany. The real binaural sound signals were recorded by binaural headsets which were placed on front passenger seat, as shown in Fig. 1. Following the measurement method for vehicle interior noise in the standard GB/T18697-2002 [19], the experimental conditions were elaborately arranged and the sound samples were recorded every 10 km/h from 40 km/h to 90 km/h at a constant speed. It acquired 76 interior sound samples altogether. The length of each sample was 30 seconds, according to international general sample length, and was 5 seconds after editing.
Table 1Test-vehicle identification
Sub. Vehicle ID | Manufacturer ID | Model year | Engine type |
Vehicle 1 | Manufacturer A | 2013 | Inline six-cylinder engine |
Vehicle 2 | Manufacturer B | 2009 | Inline six-cylinder engine |
Vehicle 3 | Manufacturer C | 2010 | Inline six-cylinder engine |
Vehicle 4 | Manufacturer D | 2011 | Inline six-cylinder engine |
Vehicle 5 | Manufacturer E | 2012 | V-type eight-cylinder engine |
Fig. 1Artificial head position
3. Objective evaluation
In objective evaluation of vehicle noises, the A-weighted sound pressure level (SPL) has been usually considered before. However, it has been found that the A-weighted SPL sometimes does not agree with the passenger's subjective feeling of the sound. Thus, the psycho-acoustical parameters in common use, such as loudness, sharpness and roughness, need to be calculated for more accurate evaluation of the sounds on vehicle NVH performance study [20-23]. According to a large number of previous research results [24-26], based on the characteristics and applicability of psycho-acoustical parameters, this paper chose loudness, sharpness, roughness, fluctuation strength (FS), tonality, articulation index (AI) and A-weighted sound pressure level (SPL(A)) as the description of objective parameters of the sound quality of vehicle interior noise. The psycho-acoustical parameters result of part of samples are shown in Table 2.
Table 2Scores and psycho-acoustical parameters of the samples
No. | Loudness (sone) | Sharpness (acum) | Roughness (asper) | FS (vacil) | AI (%) | Tonality (tu) | SPL(A) dB(A) | Score |
1 | 15.7 | 1.15 | 1.25 | 0.0531 | 80.2 | 0.0311 | 62.3 | 7.86 |
2 | 40.7 | 2.07 | 2.98 | 0.0509 | 32.3 | 0.0267 | 74.4 | 5.75 |
3 | 16.8 | 1.19 | 1.26 | 0.0443 | 81.7 | 0.0265 | 62.8 | 7.59 |
4 | 25.7 | 1.25 | 1.92 | 0.0563 | 63.5 | 0.0243 | 68.3 | 6.92 |
5 | 14.7 | 1.05 | 0.939 | 0.0482 | 87.8 | 0.0333 | 62 | 8.01 |
… | … | … | … | … | … | … | … | … |
75 | 16.1 | 1.18 | 1.3 | 0.0458 | 78.5 | 0.0254 | 62.9 | 7.52 |
76 | 17.3 | 1.36 | 0.985 | 0.0180 | 80.4 | 0.0177 | 62.3 | 7.46 |
4. Subjective evaluation by jury test
In order to establish a relationship between objective psycho-acoustical parameters and subjective evaluation results, a jury test of the samples for subjective evaluation was conducted in this paper. The Jury test was performed in a special sound quality evaluation laboratory. The playback system to play back the samples with high fidelity by special monitoring headphone of the Head Acoustics Company was used for subjective evaluation. The jury was composed by 40 participants (30 males and 10 females) between 24 and 50 years of age. Considering their physical, mental conditions and hearing experience of vehicle noise, they were recruited from the drivers, acoustic experts, engineers and students who were engaged in NVH for many years [27].
In order to avoid affecting judgments of evaluators for samples by their experience and subjective assume, the samples of the jury were sorted randomly so that evaluators did not know which vehicle type and speed the sample belongs to. The sound quality subjective evaluation has two methods mainly: magnitude estimation method and paired comparison method [28]. This jury text used the former for subjective evaluation. According to the international standards, the subjective score was evaluated for point 1 to point 10 in this paper, as shown in Table 3.
Table 3Subjective evaluation metric of sound quality
Score | Evaluation |
10 | Excellent |
9 | Very good |
8 | Good |
7 | Satisfactory |
6 | Acceptable |
5 | Unsatisfactory |
4 | Poor |
3 | Very poor |
2 | Bad |
1 | Very bad |
Evaluators would be interfered by random factors, it can’t ensure that everyone's evaluation results are correct. The correlation coefficients between each evaluator need to be calculated to inspect data. Using SPSS statistical software to analyze the results of all evaluators, the correlation coefficients between each other were calculated, as shown in Table 4. According to the calculated results listed in Table 4, it can be seen that the correlation coefficients of No. 2, No. 4, No. 20, No. 26, No. 29 and No. 39 were relatively low and others were above 0.75, so the results of them should be removed.
After eliminating six low correlation coefficient of the evaluation results, in order to guarantee the reliability of evaluation results, the rest of the evaluation results can be classified according to their own characteristics by clustering analysis. Clustering analysis is a kind of multivariate statistical analysis method. In this paper the evaluation results of evaluators were regarded as observed quantity, and the -means clustering method was applied to classify the results of evaluators. The clustering analysis result has been shown in Table 5.
Table 4Calculated correlation coefficients of the evaluators
No. | 1 | 2 | 3 | 4 | 5 | 6 | 7 | 8 |
Correlations | 0.786 | 0.719 | 0.843 | 0.731 | 0.827 | 0.839 | 0.821 | 0.781 |
No. | 9 | 10 | 11 | 12 | 13 | 14 | 15 | 16 |
Correlations | 0.753 | 0.862 | 0.804 | 0.838 | 0.783 | 0.843 | 0.802 | 0.865 |
No. | 17 | 18 | 19 | 20 | 21 | 22 | 23 | 24 |
Correlations | 0.779 | 0.788 | 0.845 | 0.716 | 0.842 | 0.782 | 0.850 | 0.779 |
No. | 25 | 26 | 27 | 28 | 29 | 30 | 31 | 32 |
Correlations | 0.752 | 0.723 | 0.787 | 0.764 | 0.742 | 0.791 | 0.814 | 0.852 |
No. | 33 | 34 | 35 | 36 | 37 | 38 | 39 | 40 |
Correlations | 0.793 | 0.782 | 0.805 | 0.842 | 0.851 | 0.817 | 0.725 | 0.826 |
Table 5Clustering analysis results
Cluster | Valid | Missing | |
1 | 2 | 34 | 0 |
28 | 6 | ||
Evaluators can be divided into two categories, 28 cases of category 1 and 6 cases of category 2, total 34 cases were valid without missing case. Excluding the evaluation results of category 2, 28 cases of category 1 serve as finally score results. The results of 28 evaluators who belong to category 1 would be averaged to get the subjective evaluation score of each sample. The score of subjective evaluation has been shown in Table 2.
5. BP ANN prediction model
Most of the sound quality evaluation models are based on the theory of multiple linear regression [29, 30]. The linear approximation may inevitably result in some errors, due to the complex nonlinear relationship between the psycho-acoustical parameters and the human perception of auditory. Thus, it is necessary to develop substitution methods for mapping the objective evaluation parameters to the subjective sensations in the sound quality evaluation (SQE) engineering.
Fuzzy inference system is also a kind of input-output mapping, through synthetic algorithm, it can also realize nonlinear mapping. Fuzzy inference system and ANN are respectively imitating the partial function of human brain. They lay particular stress on different function: Fuzzy inference systems mainly imitate the logical thinking of human brain, it has a strong ability of structural knowledge representation; ANN can imitate the function of neurons in the brain, it has strong self-learning ability and direct data processing capacity. The adaptive ability of Fuzzy inference system is poor. Fuzzy inference systems lack the ability of adapting to the environment changes and the function of learning with lower accuracy than ANN when the environmental changes. So in this paper, due to the complex nonlinear relationship of the psycho-acoustical parameters and subjective scores of sounds, we used ANN model to predict subjective sound quality evaluation. ANN technique is a tool to identify the correlation between objective psycho-acoustical parameters and the subjective evaluation of interior noise.
BP ANN is a multi-layer feed forward network and its error is back propagation. It is a mature and most widely used artificial neural network. In addition, BP neural network has been employed in the development of vehicle noise. We use the ANN technique to make a connection between the psycho-acoustical parameters and the subjective evaluation of interior noise in this paper.
5.1. The establishment of the BP ANN
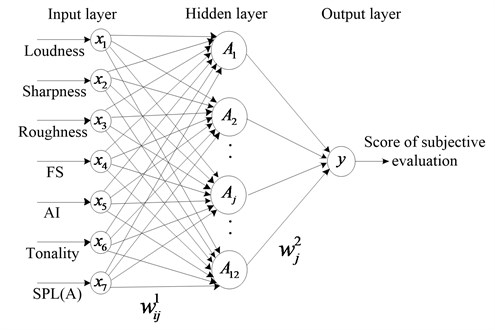
A three-layer BP network can theoretically approximate any nonlinear function, and transform function of the neurons typically takes in (0, 1) continuous values of sigmoid function [31]. In this paper, a three-layer BP neural network was built which involving input layer, hidden layer and output layer. The input layer included seven neurons: loudness, sharpness, roughness, FS, tonality, AI and SPL(A). Output layer had only one output which indicates scores of the subjective evaluation results of vehicle interior sound quality. The node number of hidden layer is related to the precision of the BP network and the learning efficiency, so it needs to determine according to the total minimum error of samples. The node number of the hidden layer could be inferred from the following empirical formula:
denotes the node number in the hidden layer; is the number of input nodes; is the number of output nodes; is a constant, normally, 1-10. From Eq. (1), one may obtain equals to 3-12. To find an optimal HLN, we carried out a set of training tests by assuming values from 3 to 12 and fixed training epochs 1000. The test results suggest that, when 12, the trained network reached a minimum average error of 0.000997. Thus, we finally set equals to 12. According to empirical formula combined with the actual error, the node number of hidden layer is set to 12 in the end. So topology structure of BP neural network was 7-12-1 as shown in Fig. 2.
Fig. 2Topology structure of BP neural network
Thus, the outputs of the neurons in the hidden layer can be expressed as:
where is the output of the th neuron of hidden layer, is the weights of connections between the th neuron in the input layer and th neuron in the hidden layer, is the input of the th neuron of input layer. is the threshold value between the input layer and the hidden layer, is the activation function of the hidden layer, and it is sigmoid function. Among various sigmoid functions, the Log-sigmoid function was applied as activation function of Network hidden layer:
Then is written by:
The only output of the output layer is given by:
where is the only output, is the weights of connections between the th neuron in the hidden layer and neuron in the output layer, is the threshold value between the hidden layer and the output layer. is the activation function of the output layer, and it is usually a linear function. The Pure line function was applied as activation function of Network output layer [32]:
The output is actually the value of sound quality evaluation (SQE). According to Eq. (4) and Eq. (6), sound quality evaluation model can be described as:
The weight (, ) and threshold (, ) are called the network parameters .The main work in this model was to find the optimal values of the network parameters and it was possible to compute the values of Network parameters iteratively in the process of the network training.
5.2. The training of BP neural network
We selected 1-68 samples in table 1 as the training samples and the rest 69-76 samples as test samples which were provisionally put aside for verifying the sound quality prediction model. In the paper, the BP training Network was built using the newff function in Neural Network Toolbox of MatlabR2010a, Traingdm function was applied as the training function.
Setting specific training parameters of Network is essential to affect the performance of the Network. Before training the network, weights and thresholds of the network must be initialized, and we adjusted the learning rate and accuracy control target parameters, etc. This paper made the random numbers in (–1, 1) as initial weight of the network, the adaptive learning rate was 0.3, the additional momentum factor was 0.5, the times of training was 5000, and set the goal of precision of the Network after training was 0.0005.
5.3. The results of prediction model
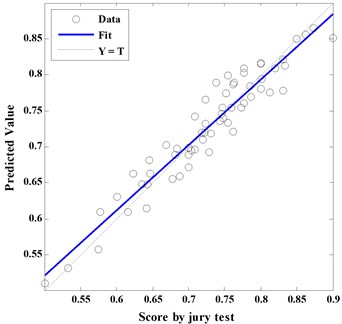
After the prediction from the trained network model, weights and thresholds of the Network must be saved. Error curve was got as shown in Fig. 3, it can be seen that training error accuracy reached 0.00057188 after 5000 times. It had fast convergence speed and good prediction precision. The correlation between predicted value of model and subjective evaluation score has been shown in Fig. 4, the correlation coefficient was 0.95588. It shows that prediction evaluation model has a strong correlation and an ability of mapping from the objective parameters to the subjective evaluation results.
Fig. 3Training error curve of the network model. (Best training performance is 0.00057188 at epoch 5000)
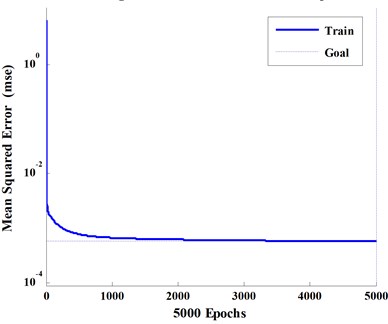
Fig. 4Correlation between prediction model and subjective evaluation R= 0.95588
Put 69-76 samples in Table 2 into the BP neural network model to obtain the predicted value. The predicted values of model were compared with scores in subjective evaluation, and calculated the prediction error percentage as shown in Table 6. It can be seen the prediction results of BP ANN prediction model is accurate, for all the forecast error were less than 6 %, the max error of 5.58 %. From these analysis results, it is concluded that the BP neural network prediction model has good generalization ability, and can forecast effectively subjective score of sound quality of HCV in uniform working conditions without subjective evaluation by jury test.
Table 6Model test results
No. | 69 | 70 | 71 | 72 | 73 | 74 | 75 | 76 |
Jury score | 7.77 | 7.62 | 7.00 | 6.35 | 5.77 | 8.34 | 7.52 | 7.46 |
Prediction value | 8.03 | 7.86 | 6.99 | 6.47 | 6.09 | 8.13 | 7.74 | 7.459 |
Error (%) | 3.35 | 3.20 | 0.16 | 1.94 | 5.58 | 2.52 | 2.90 | 0.01 |
Table 7Linking weight and threshold
1 | 0.0019 | –0.8010 | 0.0508 | 1.0097 | 0.6339 | 0.9800 | 0.6731 | –0.2986 | –0.2475 |
2 | –0.2341 | 0.2071 | 0.2034 | –0.7786 | –0.6108 | 0.9317 | 0.6933 | 0.0326 | –0.1141 |
3 | –0.0689 | –0.0981 | –0.8315 | 0.9548 | –0.2864 | –0.7438 | –0.5144 | –0.3701 | 0.2681 |
… | … | … | … | … | … | … | … | … | … |
11 | 0.4451 | 0.7439 | –0.2906 | 0.6704 | 0.8334 | –0.7769 | 0.2497 | 0.0631 | 0.1762 |
12 | –0.8341 | 0.3173 | 0.8104 | –0.0404 | –0.1791 | –0.0794 | –0.1072 | –0.4506 | 0.4621 |
0.8511 | |||||||||
Table 7 illustrates the weight (, ) and threshold (, ) were fixed by training network. Thus, the weight and threshold represent the internal connection properties of prediction model in Eq. (7). The weights are coefficients between the artificial neurons, which are analogous to synapse strengths between the axons and dendrites in real biological neurons. Therefore, each weight decides what proportion of the incoming signal will be transmitted into the neuron’s body [33].
The neural net weight matrix can be used to assess the relative importance of the various input variables on the output variables. Garson proposed an equation based on the partitioning of connection weights [34]:
where is the weight coefficient of the th input variable on the output variable, and are the numbers of input and hidden neurons, respectively, are connection weights, the superscripts ‘’, ‘’ and ‘’ refer to input, hidden and output layers, respectively, and subscripts ‘’, ‘’ and ‘’ refer to input, hidden and output neurons, respectively, and the results of subjective evaluation. The relative weight coefficient of objective evaluation parameters as calculated by Eq. (8) is shown in Table 8. It can be seen the main objective parameters (loudness and roughness) have strong effects on the subjective evaluation. However, the loudness with a weight coefficient of 36.4 % appeared to be the most influential parameter in the results of subjective evaluation. It illustrates the interior noise of HCV with high loudness could be subjectively perceived as annoying and unpleasant.
Table 8The relative weight coefficient of objective evaluation parameters
Objective evaluation parameters | Weight coefficient (%) |
Loudness | 36.4 |
Sharpness | 13.4 |
Roughness | 33.2 |
FS | 1.7 |
AI | 7.5 |
Tonality | 3.3 |
SPL(A) | 4.5 |
6. Conclusions
In this paper, interior sound quality evaluation model of HCV was successfully predicted by applying a three-layer BP ANN. The correlation coefficient between predicted value of model and subjective evaluation score was 0.95588. It shows that prediction evaluation model has a strong correlation and an ability of mapping from the objective parameters to the subjective evaluation results. Validated by the experiments, the results of BP ANN prediction model were accurate, for all the forecast errors were less than 6 %, the max error of 5.58 %. It is concluded that the BP neural network prediction model has good generalization ability, and can forecast effectively subjective score of sound quality of HCV without subjective evaluation by jury test.
It also could be used to determine the weights of objective evaluation parameters contributing to the results of subjective evaluation. The main objective parameters (loudness and roughness) had considerable effects on the subjective evaluation, and the loudness with a weight coefficient of 36.4 % appeared to be the most influential parameter in the subjective evaluation. It illustrates the interior noise of HCV with high loudness could be subjectively perceived as annoying and unpleasant. The BP ANN prediction model can forecast the subjective score of interior sound quality of HCV only by substituting objective parameters of interior noise into the model. In comparison with the time-consuming process of subjective evaluation by jury test, the BP ANN prediction model is highly accurate, effective, objective and repetitive, and it would become not only a means to evaluate the sound quality of HCV, but also a reference for the improvement of sound quality.
References
-
Martins Rogério, Pinto Márcio Gonçalves, Mendonça Carlos Magno, Morai André Ribeiro Pass-by noise analysis in a commercial vehicle homologation. SAE Technical Papers, 2003-01-3652, 2003.
-
Thivant M., Bouvet P., Cloix A., Blairon N., Braguy C., Peyroux C. Boundary element energy method for the acoustic prediction of external and interior vehicle noise application on a truck. SAE Technical Papers, 2010-01-1406, 2010.
-
Donavan Paul R. The influence of truck tire type and pavement on the emission of noise from trucks under highway operating conditions. SAE Technical Papers, 2007-01-2255, 2007.
-
Middleton Andrew H. Benefits of noise testing in the truck and bus transmission industry. SAE Technical Papers, 2000-01-3516, 2000.
-
von Gosler Joring, van Niekerk Johannes L. Sound quality metrics to assess road noise in light commercial vehicle. R&D Journal, Vol. 24, 2008, p. 1-3.
-
Bisping R. Car interior sound quality: experimental analysis by synthesis. Acustica, Vol. 83, 1997, p. 813-818.
-
Nakasaki R., Ogata T., Hasegawa H., Ozeki Y., Ondal M., Kasuga M. Sound quality evaluation of air-conditioning sounds in a vehicle using psychoacoustic parameters. The Journal of the Acoustical Society of America, Vol. 123, 2008, p. 3807-3812.
-
Lee H. H., Kim H. W., Lee S. K. Sound quality evaluation for the axle gear noise in the vehicle. The Journal of the Acoustical Society of America, Vol. 123, 2008, p. 2021-2026.
-
Shin Sung-Hwan, Ih Jeong-Guon, Hashimoto Takeo, Hatano Shigeko Sound quality evaluation of the booming sensation for passenger cars. Applied Acoustics, Vol. 70, 2009, p. 309-320.
-
Lee S.-K., Chae H.-C. The application of artificial neural networks to the characterization of interior noise booming in passenger cars. Proceedings of the Institution of Mechanical Engineers, Part D: Journal of Automobile Engineering, Vol. 218, 2004, p. 33-42.
-
Lee S.-K., Kim B.-S., Park D.-C. Objective evaluation of the rumbling sound in passenger cars based on an artificial neural network. Proceedings of the Institution of Mechanical Engineers, Part D: Journal of Automobile Engineering, Vol. 219, 2005, p. 457-69.
-
Yu L., Kang J. Modeling subjective evaluation of soundscape quality in urban open spaces: An artificial neural network approach. Journal of the Acoustical Society of America, Vol. 126, 2009, p. 1163-1174.
-
Wang Y. S., Lee C. M., Kim D. G., Xu Y. Sound quality prediction for nonstationary vehicle interior noise based on wavelet pre-processing neural network model. Journal of Sound and Vibration, Vol. 299, 2007, p. 933-947.
-
Lee S. K., Kim T. G., Lee U. Sound quality evaluation based on artificial neural network. Lecture Notes in Computer Science, Vol. 4221, 2006, p. 545-554.
-
Laux P.C. Using Artificial Neural Networks to Model the Human Annoyance to Sound. Ph.D. Thesis, School of Mechanical Engineering, Purdue University, Lafayette, Indiana, 1998.
-
Wang Y. S., Lee C. M. Evaluation of nonstationary vehicle passing loudness based on an antinoise wavelet pre-processing neural network model. International Journal of Wavelets, Multiresolution and Information Processing, Vol. 7, 2009, p. 459-480.
-
Wang Y. S., Shen G. Q., Xing Y. F. A sound quality model for objective synthesis evaluation of vehicle interior noise based on artificial neural network. Mechanical Systems and Signal Processing, Vol. 45, 2014, p. 255-266.
-
Xin Wen MATLAB Neural Network: Simulation and Application. 3rd Ed., Science Press, Beijing, 2003.
-
GB/T 18697-2002. Acoustics – Method for Measuring Vehicle Interior Noise. 2002.
-
Kreiman J., Gerratt B. R. Modeling overall voice quality with a small set of acoustic parameters. Journal of the Acoustical Society of America, Vol. 129, 2011, p. 2529.
-
Sato S., You J., Jeon J. Y. Sound quality characteristics of refrigerator noise in real living environments with relation to psychoacoustical and autocorrelation function parameters. Journal of the Acoustical Society of America, Vol. 122, 2007, p. 314-325.
-
Fastl H. The psychoacoustics of sound-quality evaluation. Acustica, Vol. 83, 1997, p. 754-764.
-
French R. M. Using guitars to teach vibrations and acoustics. Article 4: psychoacoustics and sound quality. Experimental Techniques, Vol. 29, Issue 2, 2005, p. 47-48.
-
Coen T., Jans N., Van de Ponseele P., Goethals I., De Baerdemaeker J., De Moor B., Leuven K. U. Modelling the relationship between human perception and sound quality parameters using LS-SVMs. Proceedings of International Conference on Noise and Vibration Engineering, Vols. 1-8, 2005, p. 3749-3763.
-
Leite R. P., Paul S., Gerges S. N. Y. A sound quality-based investigation of the HVAC system noise of an automobile model. Applied Acoustics, Vol. 70, Issue 4, 2009, p. 636-645.
-
Lee J. K., Park Y. W., Chai J. B. Study on the optimal design of a vehicle intake system using the booming noise and the sound quality evaluation index. International Journal of Automotive Technology, Vol. 7, Issue 1, 2006, p. 43-49.
-
Cho G., Casali J. G., Yi E. Effect of fabric sound and touch on human subjective sensation. Fibers Polymers, Vol. 2, Issue 4, 2001, p. 196-202.
-
Brandl Franz K., Biermayer Werner A new tool for the onboard objective assessment of vehicle interior noise quality. SAE Technical Papers, 1999-01-1695, 1999.
-
Cho S., Yi E., Cho G. Psychological and physiological responses to the rustling sounds of Korean traditional silk fabrics. Fibers Polymers, Vol. 7, Issue 4, 2006, p. 450-456.
-
Haderlein T., Bocklet T., Maier A., Noth E., Knipfer C., Stelzle F. Objective vs. subjective evaluation of speakers with and without complete dentures. Lecture Notes in Computer Science, Vol. 5729, 2009, p. 170-177.
-
Neural Network Theory and MATLAB 7 Realization, 2nd. R&D Center of Feisi IT Products, Electronics Industry Press, Beijing, 2005.
-
Hamed M. M., Khalafallah M. G., Hassanien E. A. Prediction of waste water treatment plant performance using artificial neural networks. Environmental Modelling and Software, Vol. 19, 2004, p. 919-928.
-
Despange F., Massart D. L. Neural networks in multivariate calibration. Analyst, Vol. 123, 1998, p. 157-178.
-
Garson G. D. Interpreting neural-network connection weights. AI Expert, Vol. 6, Issue 7, 1991, p. 47-51.
About this article

This work was supported the Science and Technology Development Project of Jilin Province of China (Grant No. 20100361) and the Tackling-key Project of Jilin Department of Science and Technology (Grant No. 20130206031GX).
Yinhan Gao designed experiments and supervised experiments. Kun Qian designed prediction model and wrote the manuscript. Jie Liang put forward the evaluation methods and guided jury test. Qiang Liu carried out experiments and processed sound data. Jian Zhao analyzed experimental results and wrote programs.
