Abstract
The experimental system of exterior performances for centrifugal pumps is built in this paper to verify the reliability of the numerical simulation. Then, the pressure fluctuation inside centrifugal pumps is computed numerically. The computational results indicate that higher peaks of pressure fluctuation are mainly at the rotation frequency, blade frequency and double blade frequency. Comparing the computational results between the coupled and uncoupled boundary element methods, the influence of the coupling on the distribution of sound pressure level cannot be ignored. Finally, the coupling acoustic boundary element method is adopted to compute the sound field of centrifugal pumps, and its result is also verified by experiment. The pressure fluctuation of the volute plays a greater influence on the sound pressure at the outlet of centrifugal pumps. The sound pressure has shown peaks in both the blade frequency and double blade frequency. It thus indicates that interferences between the impeller and tongue are the main reasons for the flow-induced noise of centrifugal pumps.
1. Introduction
As an important energy conversion and fluid transporting equipment, centrifugal pumps have been widely used in various industries [1]. With the increasingly stringent environmental standards, the vibration and noise caused by centrifugal pumps have attracted more and more attentions of researchers. For centrifugal pumps, the flow-induced noise has played an increasingly important role in the assessment of its noise level. It not only spreads in the system through the inlet and outlet pipes, but also leads to the structural radiation noise through the coupling effect. Therefore, it has become the key factor of design for the low noise system [2].
Currently, researches on the flow-induced noise of centrifugal pumps mainly focus on the numerical simulation and experiment. Chu [3] has obtained the basic information of the flow field in a centrifugal pump by means of Particle Displacement Velocimetry (PDV) technology. The results show that the pressure fluctuation and outfield radiation noise are mainly caused by the interaction between the rotating blade and volute as well as the non-uniform flow of the impeller outlet. By means of experiments, the speed of centrifugal pumps, the pressure and other physical quantities are measured by Dong [4], and the influence of geometrical change on the flow field and noise inside centrifugal pumps was thus analyzed. In recent years, the rapid development of CFD technology has provided a convenient and fast technical means for researchers and designers of centrifugal pumps. Kato [5, 6] has obtained the flow noise caused by the turbulence by means of the large eddy simulation method. Langthjem [7, 8] has reached that the unsteady fluctuating pressure on the blade surface is the main cause of noise by using Discrete Vortex Method (DVM). By means of the large eddy simulation method, Huang [8] has conducted the numerical simulation of three-dimensional structure for centrifugal pumps.
Only noise caused by the hydrodynamic is considered in all of the above methods, while the radiation noise produced from the structurally mechanical vibration is not taken into account well. When the noise produced inside the impeller and volute radiates externally, the vibration of the volute structure must be caused. Therefore, the coupling effect between the structure and the sound field can’t be ignored. Firstly, the experimental system of the exterior performances for centrifugal pumps is built in this paper, so as to verify the reliability of the numerical simulation. Then, based on the coupled acoustic boundary element method, the radiated sound field of the centrifugal pump structure is solved on the basis of the computation of the flow field, and the influence of the coupling on the sound field distribution is analyzed.
2. Numerical model
Main design sizes and performance parameters of centrifugal pumps researched in this paper are shown as Table 1.
Table 1Main design sizes and performance parameters of centrifugal pumps
Parameters | Value | Unit |
Diameter of centrifugal pump inlet | 100 | mm |
Diameter of centrifugal pump outlet | 90 | mm |
Diameter of the impeller outlet | 150 | mm |
Height of the impeller outlet | 28 | mm |
Number of blade | 6 | [–] |
Design flow rate | 100 | [m3/h] |
Design head | 20.5 | m |
Rotational speed | 2900 | rpm |
Blade frequency | 300 | Hz |
Rotation frequency | 50 | Hz |
Table 2Information of meshes and nodes
Components | Number of meshes | Number of nodes | Mesh quality |
Impeller | 665894 | 118369 | 0.35 |
Volute | 713258 | 125684 | 0.6 |
Inlet boundary | 125860 | 45361 | 0.45 |
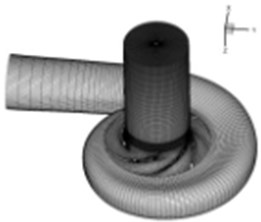
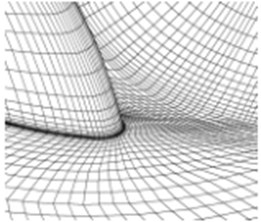
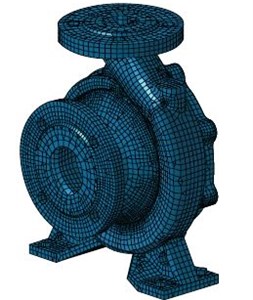
The computational domain of centrifugal pumps is mainly consisted of the impeller and volute. By means of the professional mesh generator ICEM CFD, the computational domain of centrifugal pumps is divided into a lot of meshes. Considering the flow complexity inside the impeller, the impeller was divided into the structural mesh, and the wall of the impeller blade is refined, as shown in Fig. 1(b). For the volute, the unstructured mesh is used in this paper for its division, and the tongue is given the local refinement. In actual computation, centrifugal pumps need to be extended appropriately in the inlet direction, in order to give a proper uniform inlet boundary condition. Eventually, the obtained mesh model of the entire computational domain of centrifugal pump mesh model is shown in Fig. 1(a), and the mesh and nodes of each component are shown in Table 2.
3. Numerical computation and experimental verification
3.1. Basic theory and solving strategy
As the fluid in centrifugal pumps is water in this paper and its temperature change is neglected [9, 10], the fluid can be computed as an incompressible and thermal insulation fluid. During the computation, the energy equation can be negligible. The control and momentum equations can be expressed as follows [11]:
wherein, is the fluid density, and are the speed and pressure, respectively. is the time, and are the dynamic viscosity and source term, respectively.
Fig. 1Mesh model of the computational domain for centrifugal pumps
a) Mesh model of centrifugal pumps
b) Local mesh of the impeller blade wall
The finite volume method is used to conduct the discreteness of Eq. (1), and the fully implicit multi-mesh coupled solution technology is also applied to solve it. Wherein, the discreteness of the time term adopts the second-order implicit scheme, the diffusion term and pressure term are dispersed by the central difference scheme, and the second-order upwind scheme is used for the convection term. In order to fully capture the pressure fluctuation changes on the upstream and downstream of the impeller, the physical time step of the unsteadily computation is set as 1/10 of an angle rotated by the impeller. Therefore, the unsteadily computation physical step is 0.00035 s. In a physical time step, the absolute residuals of the equation variable are controlled less than 10-4, and then the next time step is computed. Before the unsteady computation, the steady computation is made firstly, and then the result of the steady computation is taken as the initial conditions of the unsteady computation. Finally, the unsteady computation is conducted.
3.2. Computation of boundary conditions
The inlet is set the pressure boundary condition, the outlet is set the boundary condition of the mass flow, the rotary area is set the rotation speed of 2900 r/min, and others adopt the defaulted solid wall boundary condition. Due to the limited computing resources, the rated operating conditions are adopted in this paper for analysis and computation.
3.3. Arrangement of the computational monitoring points
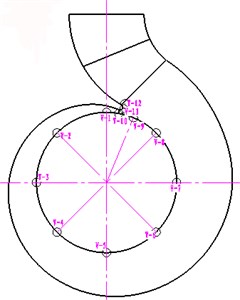
In order to specifically analyze the influence of the dynamic and static interference on the upstream and downstream of the impeller, the monitoring points are arranged at the front and back cover as well as the middle position near the operation face of the impeller blade and its reverse face in this paper (PF is the monitoring point near the front cover, PM is the monitoring point in the middle position, and PB is the monitoring point near the back cover). Meanwhile, the relevant monitoring points are arranged at the dynamic and static interface in the peripheral direction of the volute. In addition, three monitoring points are also placed at the tongue, as shown in Fig. 2.
3.4. Experimental verification
To verify the accuracy of the numerical computation, the experimental system of the exterior performances for centrifugal pumps is built. It is composed by the water circulation system and data collection system. The necessary environment for the operation of centrifugal pumps is provided by the water circulation system. By means of the sensor, the data collection system transfers various physical signals existed in the operation of the centrifugal pump under different conditions into the corresponding electrical signals. And after a series of processes, they are converted into the directly identified data. The experimental system is shown in Fig. 3.
Fig. 2Monitoring points of the pressure fluctuation inside the impeller and the interface of the dynamic and static volutes
a)
b)
Fig. 3Experimental system of the external performances for centrifugal pumps
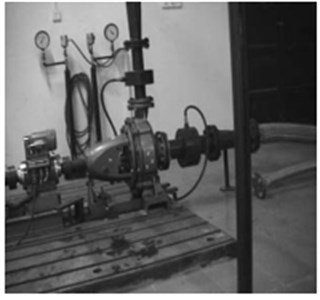
Fig. 4Comparison of the exterior performances between experiment and simulation
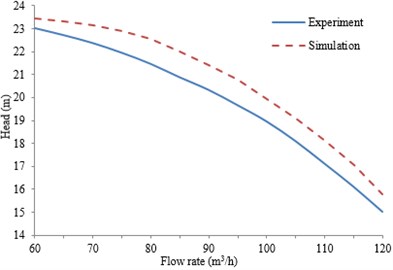
a) Head change curve with flow rate
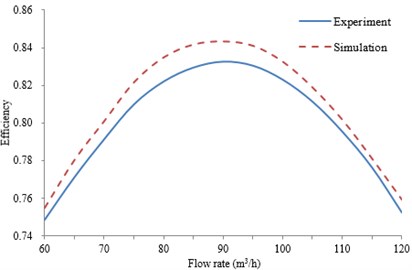
b) Efficiency change curve with flow rate
The discharge valve is adjusted step by step according the flow rate increasing from 60 m3/h to 120 m3/h, which is the high pressure safety injection process. When the pump operated at 60 m3/h stably, the discharge valve is adjusted with a uniform rate to increase the flow rate and it will be stopped until the flow rate increased to 120 m3/h approximately. The variable flow rate during the adjustment process is measured. The computed exterior performances (head and efficiency ) of centrifugal pumps are compared with the experimental values, as shown in Fig. 4. As can be seen from Fig. 4, the maximum error of the computational head is 4.8 %, and the maximum error of the computational efficiency is 4.3 %. They are within the acceptable difference between the experimental and simulated results because of the mechanical losses, and overall good agreement between the simulation results and the experimental results can be observed. So the numerical simulation method can be considered reliable in this paper, which can be used for the subsequent researches.
4. Pressure fluctuation analysis inside centrifugal pumps
4.1. Pressure fluctuation analysis inside the impeller
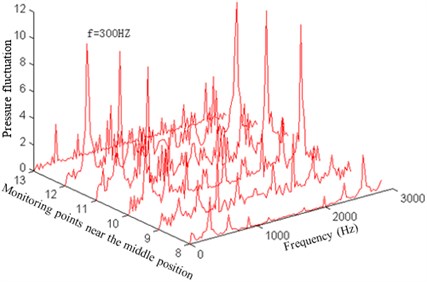
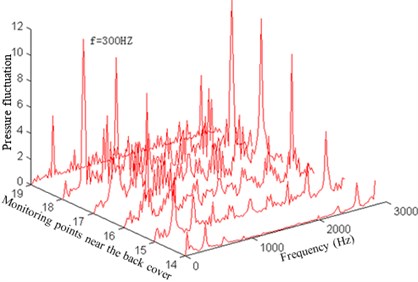
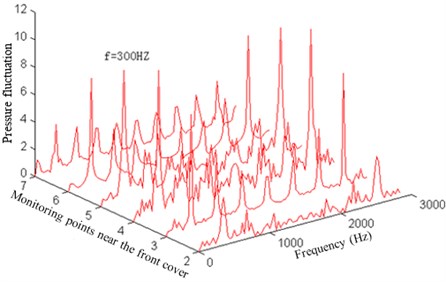
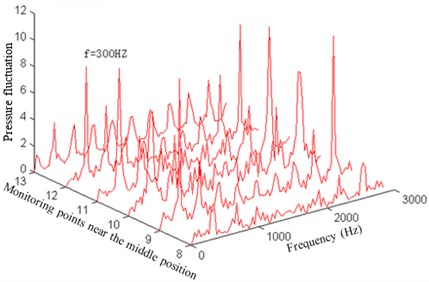
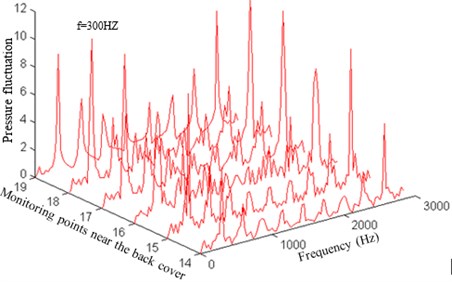
To research the pressure fluctuation inside the impeller, the pressure fluctuations of 36 monitoring points arranged inside the impeller are computed and collected. Data within 0.2-0.24 s is conducted FFT analysis, so as to obtain the pressure fluctuation amplitude changes of each monitoring point with the frequency, as shown in Fig. 5 and Fig. 7.
Fig. 5Pressure fluctuation near the operation face of the impeller
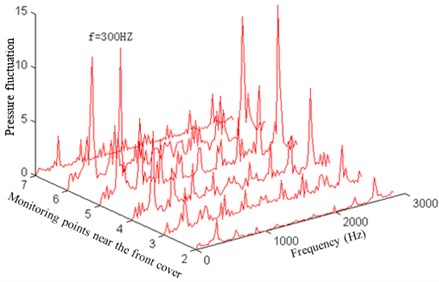
a) Pressure fluctuation near the front cover of the operation face
b) Pressure fluctuation near the middle position of the operation face
c) Pressure fluctuation near the back cover of the operation face
As shown in Fig. 6(a), (b) and (c), the flow velocity distribution of passage 5 and 6 in the centrifugal pump is calculated under 0.7, 1.0, and 1.3 flow rate. As can be seen from the figures, the flow velocity is significantly increased at the impellers with the increase of flow rate, which is also consistent with the actual situation. It can be clearly seen the flow trajectories and velocity distribution in the centrifugal pump from the 3D geometry in Fig. 6(d).
Fig. 6Flow velocity distribution in the centrifugal pump
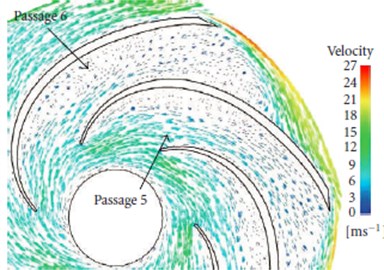
a) 0.7
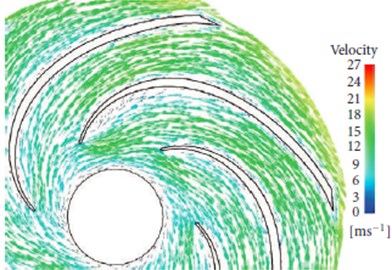
b) 1.0
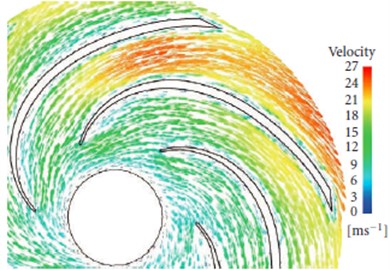
c) 1.3
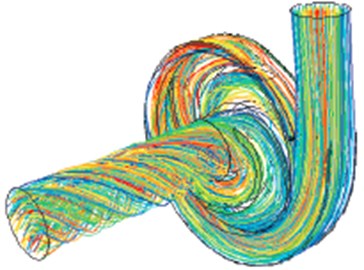
d) 3 D distribution
Fig. 7Pressure fluctuation amplitude of the main frequency on the operation face spreads from the inlet to the outlet inside the impeller flow channel
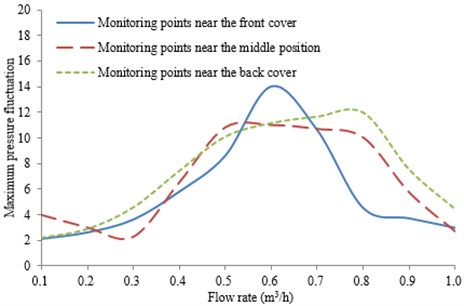
As can be seen from Fig. 5, the pressure fluctuation peaks of the impeller operation face which is close to the front cover and middle position as well as back cover are mainly in the rotation frequency, blade frequency, double blade frequency, triple blade frequency and quadruple blade frequency. But in the impeller outlet, some low-frequency components (1/2 rotation frequency) and high-frequency components increase, making the pressure fluctuation complicated and main frequency weakened. This result is mainly caused by the mutual interference of fluids between the impeller and volute.
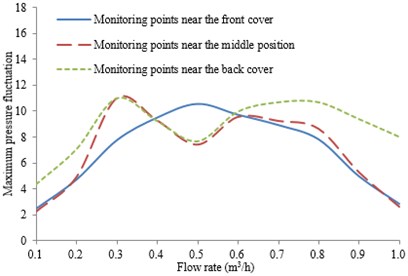
As can be seen from Fig. 7, the pressure fluctuation amplitude at the main frequency increases firstly and then decreases from the impeller inlet to the outlet at the impeller operation face. The larger amplitude is appeared at 0.45 to 0.80 times of the blade length.
As can be seen from Fig. 8, the pressure fluctuation peaks on the reverse face of the impeller are similarly to those of the operation face.
Fig. 8Pressure fluctuation near the reverse face of the impeller
a) Pressure fluctuation near the front cover of the reverse face
b) Pressure fluctuation near the middle position of the reverse face
c) Pressure fluctuation near the back cover of the reverse face
In addition, it can be seen from Fig. 9 that the pressure fluctuation amplitude at the main frequency increases firstly and then decreases near the front cover. In the middle position and back cover, its amplitude increases and then decreases. However, it increases and decreases again in the outlet. In terms of the pressure fluctuation spreading law at the main frequency inside the impeller flow channel, the pressure fluctuation near the operation face is greater than that near the reverse face. On the operation face, the maximum pressure fluctuation amplitude is in the front cover of the impeller flow channel, while on the reserve face, it occurs in the middle position of the impeller inlet.
Fig. 9Pressure fluctuation amplitude of the main frequency on the reverse face spreads from the inlet to the outlet inside the impeller flow channel
4.2. Pressure fluctuation analysis inside the volute
The pressure fluctuation inside the impeller flow channel is analyzed in detail as the above. However, the volute is one of the main components in a centrifugal pump. Therefore, the pressure fluctuation distribution inside the volute is also necessary to be researched. The pressure fluctuation of the monitoring points in Fig. 2 is also extracted as Fig. 10.
Fig. 10Pressure fluctuation in the peripheral direction of the volute
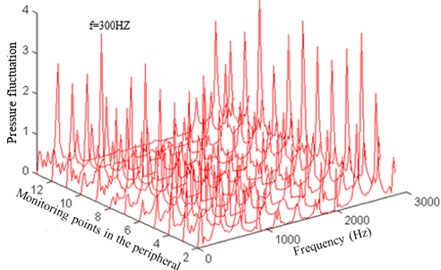
Fig. 11Pressure fluctuation amplitude of the main frequency in the peripheral direction of the volute spreads along with the helix direction
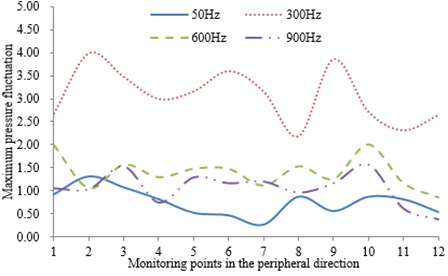
As can be seen from Fig. 10, the higher pressure fluctuation peaks in the peripheral direction of the volute mainly appears in the rotation frequency, blade frequency, double blade frequency and triple blade frequency.
In addition, as can be seen from Fig. 11, the pressure fluctuation amplitude which is change from large to small are located at 300 Hz, 600 Hz, 900 Hz and 50 Hz. Wherein, the greater pressure fluctuation amplitudes at each frequency are mainly in 1, 9, 10 points which are close to the tongue. But compared to the pressure fluctuation inside the impeller, the pressure fluctuation amplitude in the peripheral direction of the volute is smaller. This is mainly due to the quite stable expulsion effect of the volute spiral changes on the liquid and small pressure fluctuation.
5. Computation of sound field
5.1. Computation of the structural modal
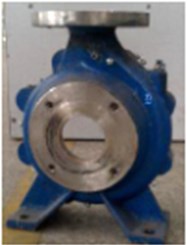
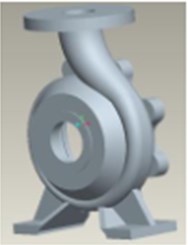
Centrifugal pumps are a rather complex structure obtained by casting and machining, as shown in Fig. 12(a). The finite element model is prepared for the interaction between the fluid and structure, and the local characteristics and stress condition of the structure are not necessary to be considered. Therefore, during building the model, the hole, boss, chamfering and other detailed structures are ignored and only some important structures are considered, as shown in Fig. 12(b).
Fig. 12Entity and simplified model of the volute
a) Entity
b) Simplified model
The material used in the simulation is steel, with the properties elastic module 211 GPa, the density 7850 kg/m3, the Poisson ratio 0.29. The excitation force is set as the boundary condition. The constraints are imposed as follows: the nodes of the foundation bolt hole are completed fixed, with . The displacement of nodes on the bearing holes is . on the inlet flanges, on the outlet flanges. The boundary set is shown in Fig. 14. The precision and scale of the computation are directly affected by the quantity of the mesh, as shown in Table 3.
Table 3The computational result of the natural frequency
Order | Size of meshes | |||
20 mm | 15 mm | 10 mm | 7 mm | |
1 | 611 | 605 | 602 | 599 |
2 | 877 | 871 | 860 | 857 |
3 | 1278 | 1268 | 1261 | 1257 |
4 | 1391 | 1387 | 1379 | 1375 |
5 | 1801 | 1794 | 1757 | 1748 |
6 | 2793 | 2782 | 2775 | 2772 |
7 | 3000 | 2989 | 2981 | 2976 |
As can be seen from Table 3, with the decrease of the mesh density, the number of meshes and node is also decreased gradually, and the natural frequency is reduced too. When the mesh size is less than 10 mm, the maximum relative error of the natural frequency is less than 1 %. Therefore, the modal result computed at the mesh size of 10 mm is adopted for the subsequent analysis.
5.2. Sound field on the surface of the centrifugal pump
The vibration source of the flow-induced noise in the centrifugal pump is mainly the pressure pulsation which is generated from the static and dynamic interference within the pump. As such pulsation acts on the volute and the internal surface of pump cover, the excitation force is generated and transferred to the outer surface through the pump cover structure, and then the vibration on the outer surface of the pump cover is caused, which will generate coupling with the air, thus making noise.
The calculation process of this coupling is shown in Fig. 13. 1) The internally unsteady flow is solved by means of large eddy simulation, in order to obtain the time domain fluctuation of pressures on interface between structure and fluid. 2) The vibration displacement response of the pump cover structure is simulated under the excitation of pressure fluctuation. 3) The natural modes of the cover structure are solved. 4) The vibration displacement on the outer surface of the cover structure is taken as the boundary condition, and FEM/BEM coupling method is applied to solve the flow-induced noise based on the structural modes.
Fig. 13Calculation process of coupling for the centrifugal pump
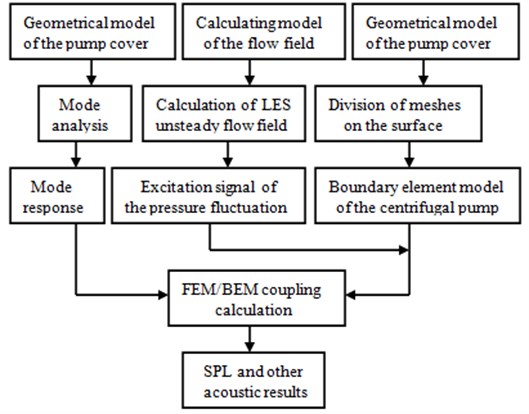
Fig. 14Finite element mesh
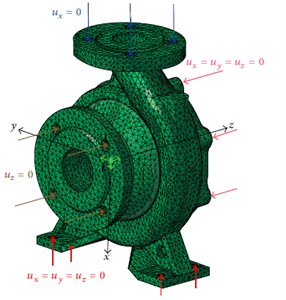
Fig. 15Mesh on the surface
The outer surface of the structure was extracted and meshed as the acoustic model used in the BEM calculation, as shown in Fig. 15. The acoustical mesh consists of 14706 elements and 13757 nodes. As the maximum valid frequency of the model investigated in the study was 4366 Hz. According to the reference [12]. The normal velocity distribution on the outer surface nodes of the structure was transferred to the surface nodes of the acoustic model, which was set as the boundary condition of the volute acoustic simulation.
Table 4The computational results of sound pressure level for the volute
Frequency | 0.7 | 1.3 | |||||
Uncoupling | Coupling | Uncoupling | Coupling | Uncoupling | Coupling | ||
280 Hz | Max | 128.5 | 129.1 | 118.5 | 117.9 | 115.3 | 115.1 |
Min | 113.6 | 113.9 | 104.2 | 103.7 | 100.1 | 99.5 | |
600 Hz | Max | 123.7 | 123.2 | 113.7 | 113.4 | 109.2 | 108.7 |
Min | 105.3 | 95.3 | 92.6 | 83.1 | 92.5 | 81.9 | |
855 Hz | Max | 119.2 | 118.9 | 108.3 | 108.1 | 105.4 | 105.1 |
Min | 104.2 | 103.6 | 96.5 | 96.8 | 91.8 | 92.1 | |
The sound field is computed by using the boundary element method. Assuming the acoustic waves at the inlet and outlet are plane waves, and the property at the inlet and outlet is set as the sound absorption. If the coupling is considered, the structural modal result is required to be imported. And the modal damping of the volute is set as 0.01. When the mapping between the acoustic boundary element mesh and structural finite element mesh is only completed, the coupling response solution can be conducted. The computational result from the coupled and uncoupled acoustic boundary element is shown in Table 4, and the corresponding distribution of the sound pressure level (SPL) is shown as Fig. 16.
Fig. 16SPL distribution of the volute at 300 Hz
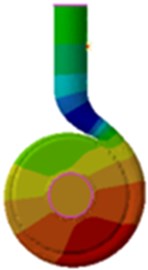
a) Uncoupling
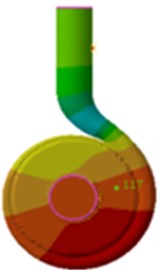
b) Coupling
From Fig. 16 and Table 4, it is found that SPL distribution is similar in both situations, and the maximum values are all appeared in the inlet and outlet. The position of the minimum value is also close to the inlet and outlet, and the dipole characteristic of the sound field distribution remains unchanged. In both conditions, SPL decreases along with the increase of the flow rate. According to Table 4, the maximum SPL differs little under both conditions, while the minimum values differs much, reaching up to 10.6 dB. At double blade frequency, the influence of the acoustic coupling on the distribution of the sound field is most obvious. The minimum values of each condition differed about 10 dB because the first-order natural frequency of the centrifugal pump volute is about 602 Hz, which is close to double blade frequency. According to the above analysis, the acoustic coupling can’t be neglected to solve the flow- induced noise of centrifugal pumps.
The coupled boundary element method is applied to compute the sound field distribution of the sound source term for the volute pressure fluctuation. The outlet (26, 225, 0) is set to calculate SPL. The flow-induced noise of centrifugal pumps is very complicated, so it is necessary to verify the reliability by means of experiment. The measurement of the far-field noises in the centrifugal pump is always interfered by the motor noises, pipe noises and background noises, thus causing some difficulties to obtain the accurate results. In order to verify the reliability of the numerical results, the internal noises of the centrifugal pump are tested and the corresponding signal is measured by a hydrophone. The hydrophone type is ST70. The hydrophone is installed in the pipe wall horizontally. And the sensor probe is in the flush status with the wall surface around the measurement point, which measures the flow noise within the pipe directly. The hydrophone is arranged in the outlet location of the centrifugal pump. The experimental equipment is shown in Fig. 3. The test results are then compared with the numerical results, as shown in Fig. 17. It can be seen that the experimental result is close to the numerical result no matter in peaks or other frequencies. Therefore, the numerical simulation model is reliable and can be used for the subsequent analysis.
Based on the verified model, the inlet (33, 0, 212) is also set to calculate SPL and compared with that of the inlet, as shown in Fig. 18.
Fig. 17Comparison of noises at the outlet between experiment and simulation
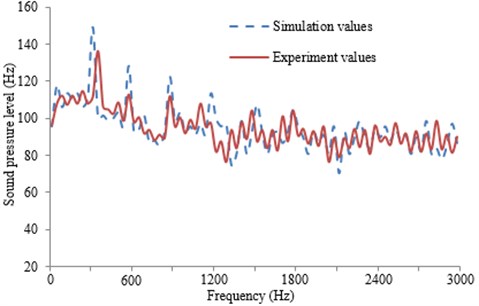
Fig. 18Response curve of the SPL frequency domain
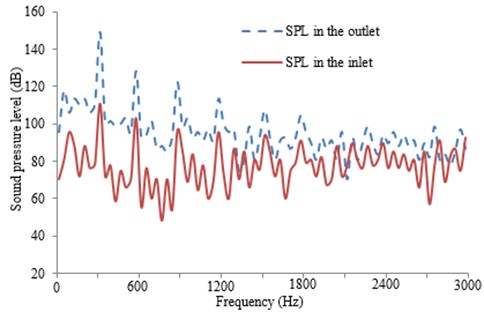
As can be seen from Fig. 18, during computing the sound field, the computational result is a broadband when the pressure fluctuation of the volute is regarded as the dipole source. At low frequency, SPL at the outlet is obvious larger than that of the inlet , indicating that the influence of the volute is larger on the sound field when it is compared with that of the inlet. There are peaks at the blade frequency and double blade frequency, indicating that the interference between the blade and tongue is the main reason for the flow-induced noise of centrifugal pumps.
5.3. Radiation noises at the far-field for the centrifugal pump
In the above analysis, only noise on the surface of the internal structure for the volute is researched. The radiation noise of the centrifugal pump is also very important and should be researched.
BEM method is applied to calculate the radiation noise at the far acoustical field of the centrifugal pump. The propagation medium is air, which density is 1.225 kg/m3, and the corresponding propagation speed is 340 m/s. A spherical field-point mesh is created at 1.5 m away from the geometric center of the centrifugal pump, in order to observe the sound pressure distribution. The radiation sound pressure of the centrifugal pump cover under different impeller outlet width is shown as Fig. 19. It can be seen from the figure that with the increase of the impeller outlet width , the radiation sound pressure of the centrifugal pump is increased significantly. Therefore, the radiation noise at the far acoustical field is relatively small when the impeller outlet width is 8 mm.
Fig. 19The radiation noises of the centrifugal pump cover
a) 8 mm
b) 10 mm
c)12 mm
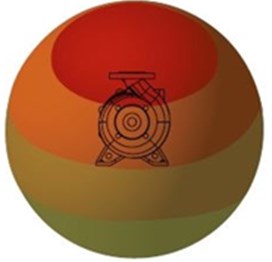
d)14 mm
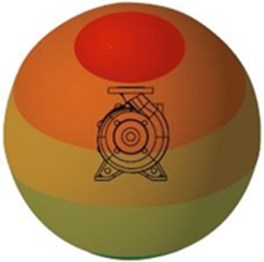
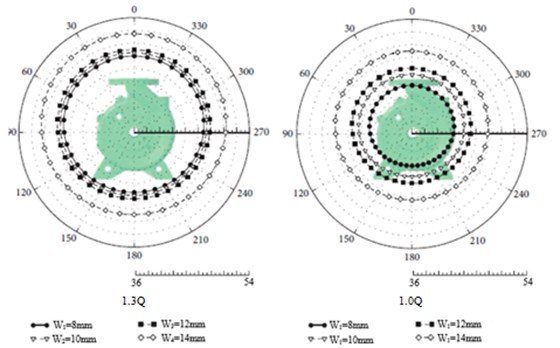
There is an obvious direction in the propagation of sound. There are different directions for different points which are relative to the sound source position. As a result, their noise spectrums are also different. To obtain the circumferential distribution of the centrifugal pump SPL, 36 monitoring points which are 1500 mm away from the impeller center are set up on the external surface of the pump cover, and the angle is 10° between the adjacent points. Finally, the radiation noise of the centrifugal pump at the far acoustical field under different conditions is obtained, as shown in Fig. 20.
As can be seen from Fig. 20, SPL is not significantly changed when the impeller outlet width is increased from 8 mm to 12 mm, while SPL has an obvious change when the width is increased from 12 mm to 14 mm. Therefore, the increase range of SPL is also increasing gradually under all conditions with the increase of the impeller outlet width. On one hand, the increases of the impeller outlet width are conducive to eliminating swirls of the secondary flow on the volute section, but reflux will be caused by the excessive impeller outlet width. As a result, the static and dynamic interference between the impeller and volute will be strengthened. On the other hand, there is an obvious impact of the impeller outlet width on the jet flow wake of the impeller outlet, and the area of the wake is also enlarged with the increasing outlet width [13]. Therefore, with the increase of the impeller outlet width, the pressure fluctuation generated by the static and dynamic interference within the pump is strengthened, and the fluid excitation and vibration noise will be also strengthened. Therefore, the impeller outlet width must be designed well. Otherwise, greater radiation noise will be generated in the far field.
Fig. 20Directivity distribution of the radiation noises for the centrifugal pump
6. Conclusions
1) The experimental system of the exterior performances for centrifugal pumps is built in this paper, so as to verify the reliability of the numerical simulation. The result shows that the accuracy of the numerical simulation is relatively high, which could be used to compute centrifugal pumps in the subsequent analysis.
2) The pressure fluctuation inside centrifugal pumps is computed numerically. It is found from the result that the greater pressure fluctuation peaks are mainly appeared at the rotation frequency, blade frequency, double blade frequency, triple blade frequency and quadruple blade frequency.
3) By means of both the coupled and uncoupled acoustic boundary element methods, the radiated sound field of the dipole source for centrifugal pump impeller is computed. Consequently, the influence of the acoustic coupling on the distribution of sound pressure level cannot be ignored, and the acoustic coupling makes the distribution of sound pressure be uniform in the frequency domain. The influence of the acoustic coupling is greater in the frequencies with structural mode.
4) The coupled acoustic boundary element method is applied to compute the radiation sound pressure of centrifugal pumps. It is indicated from the result that the pressure fluctuation of the volute plays a greater influence on the sound pressure at the outlet of centrifugal pumps. The sound pressure has shown peaks in both the blade frequency and double blade frequency. It thus indicates that interferences between the impeller and tongue are the main reasons for the flow-induced noise of centrifugal pumps.
5) Radiation noises at the far-field for the centrifugal pump are also calculated based on BEM, and the impeller outlet width plays a greater influence on radiation noises at the far-field of centrifugal pumps.
References
-
Make A. B. Practical design against pump pulsations, precede of the twenty-second. International Pump Symposium, 2005, p. 136-177.
-
Zhu L. Study on rotor-stator interaction of a centrifugal pump based on LES an experiments of the pressure fluctuation. Jiangsu University, Vol. 8, 2011.
-
Liu W. L. Numerical calculation of different tongue-angles interference effect on unsteady flow in a centrifugal pump. Power Station Auxiliary Equipment, Vol. 35, Issue 2, 2014, p. 39-43.
-
Shao C. L., Gu B. Q. Numerical simulation of unsteady pressure field in centrifugal pumps. Transactions of the Chinese Society of Agricultural, Vol. 25, Issue 1, 2009, p. 75-80.
-
Tian H., Guo T. Numerical simulation of unsteady flow in a centrifugal pump. Transactions of the Chinese Society of Agricultural, Vol. 40, Issue 8, 2009, p. 92-95.
-
Wang J., Feng T. Experimental research on the relationship between the flow-induced noise and the hydraulic parameters in centrifugal pump. Fluid Machinery, Vol. 35, Issue 5, 2007, p. 8-11.
-
Hu F. F., Chen T., Wu D. Z. Experiment study of cavitation induced vibration and noise of guide vane mixed flow pump. Journal of Drainage and Irrigation Machinery Engineering, Vol. 31, Issue 12, 2013, p. 1021-1023.
-
Wang Y., Dai C. Analysis on pressure fluctuation of unsteady flow in a centrifugal pump. Transactions of the Chinese Society of Agricultural, Vol. 41, Issue 3, 2010, p. 91-95.
-
Dou W., Liu Z. S. The investigation of the effect of volute tongue on hydrodynamic forces for high speed centrifugal pump. Journal of Vibration Engineering, Vol. 25, Issue 6, 2012, p. 705-713.
-
Ji B., Luo X. W. Analysis on characteristics of two-stage rotor-stator interaction and pressure fluctuation propagation in Francis turbine under partial load. Journal of Hydroelectric Engineering, Vol. 33, Issue 1, 2014, p. 191-196.
-
Gary D. Impeller related to reduce hydraulically generated vibration. Proceedings of the 22nd International Pump Symposium, 2005, p. 10-15.
-
Marburg S. Six boundary elements per wavelength: is that enough? Journal of Computational Acoustics, Vol. 10, Issue 1, 2002, p. 25-51.
-
Liu H. L., Wang Y., Yuan S. Q. Effects of impeller outlet width on the vibration and noise from centrifugal pumps induced by flow. Journal of Huazhong University of Science and Technology, Vol. 40, Issue 1, 2012, p. 123-127.
About this article

This work is supported by the National Science and Technology Major Project of China (2016ZX05064).
