Abstract
In order to study the pressure pulsation characteristics of a centrifugal pump with a guide vane, a pump with specific speed 190 was chosen as the research object. The numerical simulation was carried out using the standard - turbulence model. The pressure pulsation characteristic was researched at a set monitoring point. The reliability of the numerical simulation was verified with experiment results. The pressure pulsation characteristic curves of each calculation domain were obtained by dimensionless data processing. The results elucidate that the rotor/stator interaction at the outlet of the impeller is the main source for the pressure pulsation. With increasing distance, the pressure pulsation gradually decreases; the pressure pulsation amplitude of the pressure surface is larger than the suction surface; the pressure pulsation in the flow channel of the guide vane remains the same; the pressure fluctuation near the outlet of the annular volute chamber is larger, and the pressure pulsation near the upstream of the flow channel is quite complicated. The pressure pulsation at the annular volute and axial symmetry is the same.
1. Introduction
The rotor/stator interaction in centrifugal pumps and the inhomogeneous flow of impeller are the main sources of pressure pulsation. Due to the minimum clearance between the stator position and the rotor exit, the rotor/stator interaction is most intense in the region [1]. Pulsating pressure would induce vibration and noise as it acts on impeller, guide vane and volute casing, and even cause resonance of pump unit. It is necessary to research the pressure fluctuations in centrifugal pumps to improve its stability. Currently, there are two methods to study the pressure pulsation in centrifugal pumps. One is experimental research, that is, the data are collected by selecting the monitor points, and then the analysis is carried out. The other method is the numerical simulation study with CFD. Scholars have performed a wide range of research to study pressure pulsation [2-5].
In 1986, Adkins [6] proposed a theoretical model of predicting radial force by studying the theories and experimentations of the interaction between the volute and the impeller. It was determined that the force acting on the shroud has a large impact on the unstable flow. The parameters of the impeller, the guide vane and the clearance between the impeller and volute have an important impact on the pressure pulsation and radial force. Parrondo [7] studied the relationship between the volute-impeller interaction and pressure pulsation. The results show that pressure pulsation has a great influence on pump noise. Barrio, Solis, Gonzalez [8-10] also studied the clearance between the volute tongue and the impeller. The results show that the clearance between the volute tongue and the impeller has a great influence on the pressure pulsation. Zhu [11] performed a pulsation study by changing the shape of the volute and found the optimal shape of the volute tongue. Majidi [12] investigated the internal flow field of the centrifugal pump by a numerical simulation method and found that the pressure pulsation at the impeller outlet and in the volute interior are larger. Yang and other scholars [13-16] studied the effect of the volute structure on the pressure pulsation and the radial force of centrifugal pumps. The results show that the pressure pulsation in the design condition is smaller than that in the off-design conditions and the radial force of the impeller varies with time.
Currently, most of unsteady study of centrifugal pump focus on the spiral volute. In this paper, an unsteady numerical calculation of a guide vane centrifugal pump (specific speed 190) was carried out, and the variation of the pressure pulsation in the pump was analyzed.
2. Research object and experimental tests
2.1. Research object
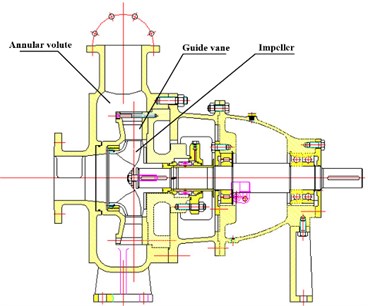
The design parameters of the model pump are: design flow 270 m3/h, design head 15 m, design efficiency 75 %, speed 1450 r/min, specific speed 190, Blade number of impeller 5, Blade number of guide vane 6. The main flow parts include the suction chamber, the impeller, the guide vane and the annular volute and so on. The structure of model pump is shown in Fig. 1.
Fig. 1Model pump structure
2.2. Experimental tests
Performance experiments of the model pump were performed in a test platform schematized in Fig. 2(a). The model pump was driven by a variable speed electric AC motor controlled by a frequency converter. The shaft torque and rotational speed were monitored by a torque and speed sensor with errors under ±0.10 %. Static pressure values were measured at the inlet and outlet of the pump with pressure gauge, and the uncertainty was within ±0.10 %. The flow rate was measured by a magnetic flow meter with the uncertainty less than ±0.14 %. The measurement accuracy of pump efficiency was quantified as ±0.30 %. Scheme and physical map of the test rig are shown in Fig. 2.
Fig. 2Scheme and physical map of the test rig
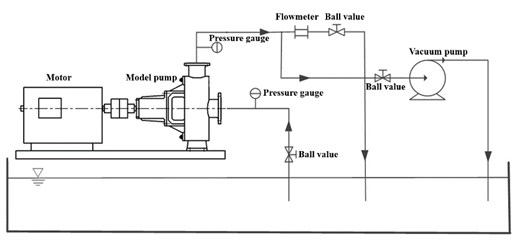
a) Scheme of the test rig
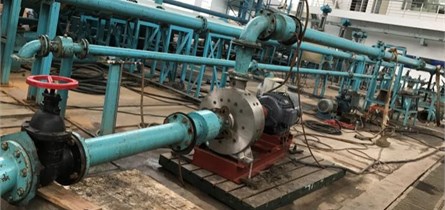
b) Physical map of the test rig
3. Numerical simulation
3.1. Calculation domain, mesh generation and mesh sensitivity analysis
Calculation domain of the model pump was built by Pro/E, as observed in Fig. 3. In order to make the inlet and outlet flow more stable and closer to the actual flow, the import extension and export extension were added. ICEM was chosen for the hexahedral mesh generation, as shown in Fig. 4. In order to select the appropriate number of meshes, a mesh sensitivity analysis was carried out. Five sets of meshes were used to perform the pump head and efficiency numerical simulation to analyze the influence of the mesh numbers under the same CFX-process condition. Table 1 summarizes the total number of grids, and the calculation values of head and efficiency.
Fig. 3Calculation domain of model pump
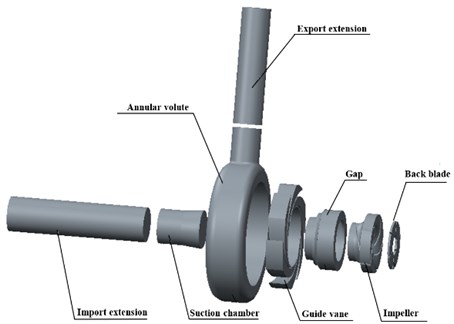
Fig. 4Mesh divisions of calculation domain
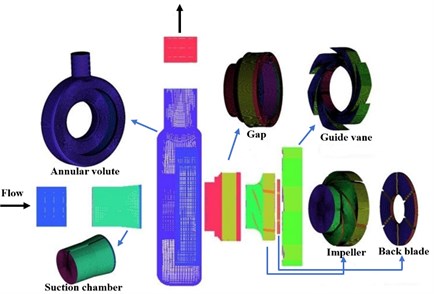
Table 1Mesh sensitivity analysis
Number | Total mesh numbers | Head (m) | Efficiency (%) |
1 | 15241854 | 16.05 | 72.98 |
2 | 48210231 | 16.08 | 73.06 |
3 | 50143163 | 16.10 | 73.18 |
4 | 52473702 | 16.11 | 73.22 |
5 | 61016470 | 16.11 | 73.23 |
The same topological structure of computational domain was employed for the research model. Five schemes of grids were gained at the same premise of mesh quantity. The numbers of grids for five cases were 15241854, 48210231, 50143163, 52473702, 61016470, respectively.
The value of head was for the qualitative dimensions of mesh independent check, and the computational head value of five cases were 16.05 m, 16.08 m, 16.10 m, 16.11 m, 16.11 m, respectively. The head value was gradual increase with the number of girds increasing. Apparent, the head value of case 4 and case 5 were almost the same. It indicates that it has little impact on numerical results to further increase the number of grids of case 4. Taking the computer resources in account and keeping the cost under control, the girds numbers of case 4 were chosen to calculate the computational domain.
3.2. Boundary condition setting
The numerical simulation was carried out by ANSYS CFX. The computational domain contains the inlet extension, the suction chamber, the impeller, the back blade, the clearance, the guide vane, the volute and the outlet extension. The calculation was based on the whole flow field. Specially, the impeller and the back blade were set as the rotating field and the speed was 1450 r/min. Three static-dynamic interfaces were set between the impeller and the clearance, the back blade and the clearance, and the impeller and the suction chamber. The rest of the interfaces were defined as static interfaces. The inlet pressure was set as the total pressure of 1 atm, and the outlet was set to the calculated mass flow rate. The walls were set to the no-slip condition.
3.3. Applicability analysis of turbulence model
In numerical simulation, the turbulence model is used to make the calculated equations closed. The frequently-used turbulence models in engineering include standard - model, - model and other turbulence models derived from the two. Any turbulence model cannot be applied to all calculations, so choosing the appropriate turbulence model has an important effect on the accuracy of calculation results. In order to analyze the suitability of turbulence model, the standard -, SST - model and RNG - model is selected. Comparison results of head and efficiency with the test values are summarized in Table 2.
Table 2Comparison results of turbulence models
Model | Calculation | Experiment | Deviation | |||
Head (m) | Efficiency (%) | Head (m) | Efficiency (%) | Head (%) | Efficiency (%) | |
Standard - | 16.11 | 73.22 | 15.03 | 71.47 | 6.7 | 2.4 |
SST | 16.56 | 77.68 | 15.03 | 71.47 | 9.2 | 8.7 |
- | 16.28 | 74.46 | 15.03 | 71.47 | 7.7 | 4.2 |
RNG - | 16.43 | 73..83 | 15.03 | 71.47 | 8.5 | 3.3 |
It can be seen from Table 2, the variation of the head and efficiency of the four turbulence models is larger under the design conditions. Compared with the various turbulence models, the deviation of head and efficiency with standard - model were smaller, respectively 6.7 % and 2.4 %. The maximum deviation value of head and efficiency were by using the SST model, 9.2 % and 8.7 %, respectively. Therefore, the standard - model was superior to other models for the model pump calculation and was employed for the subsequent simulation.
3.4. Numerical simulation reliability verification
In order to verify the reliability of the numerical simulation, the results of the numerical simulation at the nominal speed were compared with the experimental results, as shown in Fig. 5.
Fig. 5Test curves of the model pump performance
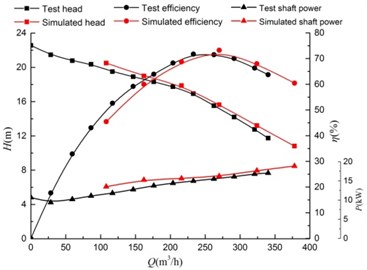
It can be seen that, with the rise of the flow rate the efficiency increases first and then decreases. The peak value of the simulation efficiency is 73.22 % while the experimental efficiency peaked at 71.47 %. The former is 1.75 % higher than the later. The head deviation between the simulation value and experimental one is 3.8 %. Due to the head and efficiency deviation between the numerical simulation and the experiment is small, this numerical simulation is suitable for the subsequent study.
3.5. Setting the monitoring points for the pressure pulsation
The pressure pulsation monitoring points in the calculation domains were set to analyze the pressure pulsation characteristics of the guide vane centrifugal pump under various conditions. Three monitoring points were set in the suction chamber and their position is shown in Fig. 6(a). Twelve equidistant monitoring points, six on the pressure surface and six on the suction surface, were set in the impeller, as shown in Fig. 6(b). Eighteen monitoring points were set in the guide vane, as shown in Fig. 6(c). Three monitoring points were arranged on each of the six channels. Thirty-six monitoring points were set on the annular volute. There were ten monitoring points in the front pump chamber and twenty-two monitoring points around the circumference of the annular volute. Eleven monitoring points were set on each side and four monitoring points were set on the outlet, their positions are shown in Fig. 6(d).
Fig. 6Distribution of pressure pulsation monitoring points
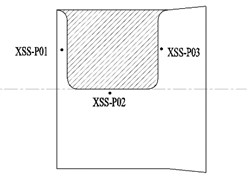
a) Monitoring points in the suction chamber
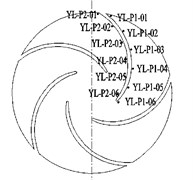
b) Monitoring points on the impeller
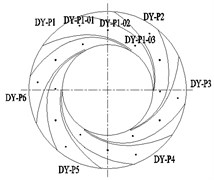
c) Monitoring points on the guide vane
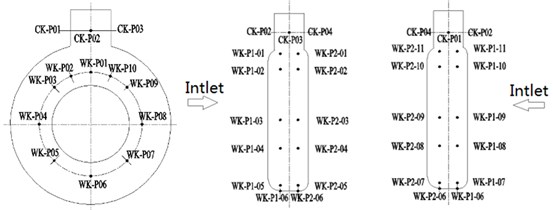
d) Monitor points in the annular volute
4. Results analysis
The calculation result of static pressure value on each monitoring point was obtained at each time step. In order to accurately compare the pressure of each monitoring point, the pressure coefficient is introduced:
where p is the static pressure of the monitoring point. is the average static pressure for a rotation period of impeller and u is the circumferential velocity of the impeller.
4.1. Pressure fluctuation analysis in suction chamber
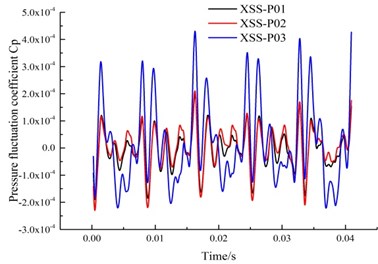
The pressure fluctuation characteristic of the three monitoring points in the suction chamber are shown in Fig. 7.
Fig. 7(a) is the time domain diagram of the monitoring points in the suction chamber. Point P03 has five big peaks and five small peaks, which corresponds to the five impeller blades. It can be seen that the fluctuation amplitude of the pressure pulsation at the monitoring point closest to the impeller is the largest. The fluctuation curve of the monitoring point P02 has 5 distinct troughs, 5 big peaks and 5 small peaks, but the pressure pulsation coefficient is smaller than P01. This shows that the farther away from the impeller, the smaller the fluctuation frequency as expected. In addition, the influence of the baffles on the pressure fluctuation is not obvious, and the influence of the impeller is dominant.
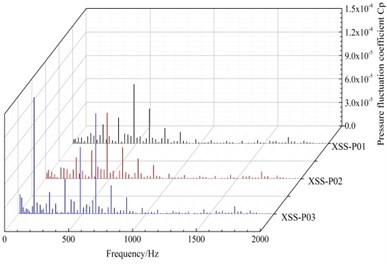
Fig. 7(b) shows the frequency domain characteristics of the pressure fluctuations at three points. Fast Fourier transform (FFT) processing is applied to display the unsteady pressure feature in frequency domain. The pressure fluctuation coefficient at monitoring point P03 near the impeller is highest, and monitoring point P01 is lowest, as can be observed in Fig. 7(b). The amplitude of the pressure pulsation coefficient at monitoring point P03 is 3 times more than monitoring point P01. It indicates that the closer to the impeller, the greater the pressure pulsation as the amplitude is higher. The dominant frequency of monitoring points P01 and P02 is 20 times the shaft frequency (4 times the impeller blade frequency). The dominant frequency of monitoring point P03 is 5 times the shaft frequency (1 times the impeller blade frequency). The smaller frequency is 20 times the shaft frequency (4 times the impeller frequency), the farther away from the impeller, the smaller and the more lag there is in the pressure fluctuations from the impeller.
Fig. 7Time domain and frequency domain diagrams of the pressure fluctuation in the suction chamber
a) Time domain diagram
b) Frequency domain diagram
4.2. Pressure fluctuation analysis of the impeller
Fig. 8 shows the distribution of the pressure pulsation time domain at twelve monitoring points on the suction surface and pressure surface of the rotating blade. As can be observed from Fig. 8, six wave peaks and wave troughs are formed as the impeller rotates in a circle, which corresponds to the 6 guide blades. This shows that the rotor-stator interaction between the impeller and the guide vane is the main cause of the pressure pulsation. From the inlet to the outlet of the impeller, the pressure pulsation coefficient fluctuation becomes increasingly intense. When the impeller rotates into the low pressure area, a wave trough is formed and a wave peak is formed when impeller rotates into the high pressure area. The amplitude of the pressure fluctuation coefficient near the impeller inlet is small, and the static pressure distribution is relatively stable. Near the impeller outlet, due to the acceleration of the impeller rotation and the rotor-stator interaction between the impeller and guide vanes, the distribution of static pressure at the outlet is uneven, so the pressure fluctuation is larger.
Fig. 8Time domain diagram of the impeller pressure fluctuation
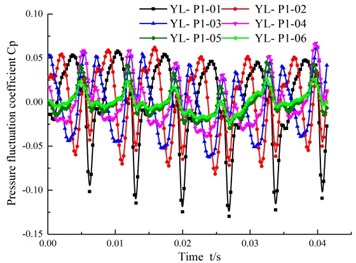
a) Pressure surface
b) Suction surface
Fig. 8 shows that the pressure fluctuation of the monitoring points on the pressure surface is obviously stronger than that of the suction surface, and that the static pressure distribution is more disordered because it the points continually move into the high pressure and the low pressure zone. Six monitoring points on the pressure surface of the blade enter the high pressure zone and the low pressure area alternately, so the wave peak and trough also appears alternately. The time sequence that the wave peak appears is P01 > P02 > P03 > P04 > P05 > P06. The sequence of the wave peak value of pressure fluctuation is P01 > P02 > P03 > P04 > P05 > P06, which shows that the pressure fluctuation signal is generated in the impeller outlet. Monitoring points on the suction surface of the bald enter the area of high and low pressure area in the same way, so their descending pressure order is also P01 > P02 > P03 > P04 > P05 > P06, the same as the pressure surface. The amplitude of pressure fluctuation shows an obvious decreasing trend from the outlet to the inlet. The peak values of the fluctuation and the fluctuation degree on the suction surface are smaller than that of the pressure surface.
Fig. 9Frequency domain diagram of the impeller pressure fluctuation
a) Pressure surface
b) Suction surface
Fig. 9 is the frequency domain diagram of the pressure fluctuation of both the impeller pressure surface and the suction surface. Notice that the pressure fluctuation at each monitoring point on the impeller working face and the corresponding monitoring point on the back are similar. The amplitude of pressure fluctuation increases successively from the impeller inlet to the outlet. The main frequency of the frequency spectrum on the face and back is 145 Hz, and the secondary frequency is 290 Hz.
4.3. Pressure fluctuation analysis of the guide vane
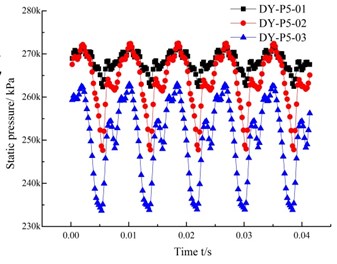
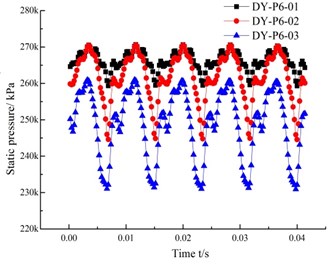
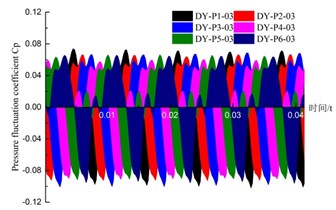
Fig. 10 shows a static pressure distribution diagram of the monitoring points in the 6 flow channels of the guide vane. Comparing the 6 channels of the guide vanes shows that the distribution of static pressure in the 6 flow channels is similar. The static pressure at monitoring point P01 near the guide vane outlet is the biggest, but the fluctuation frequency is low. The static pressure value at monitoring point P03 nearer the interior of the guide vane is smaller, and the fluctuation frequency is the highest, it is 3 times of the fluctuation frequency at the monitoring point of the vane outlet. The fluctuation curves in each flow channel exhibit periodic variation, there are 5 wave peaks and valleys, which shows that the rotor/stator interaction of the impeller and the guide vane plays a dominant role, so the frequency of pressure fluctuation at the inlet of the guide vanes is large, and also affected by the impeller outlet. Due to the diversion of the annular volute chamber, the outlet pressure of the guide vanes is not changed much and the flow tends to be stable.
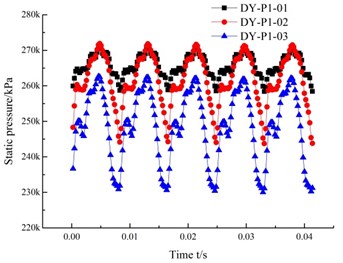
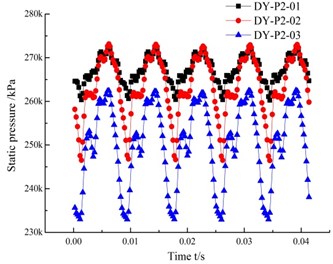
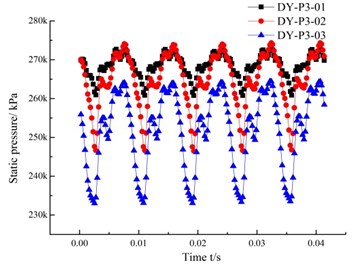
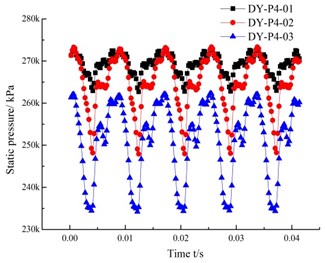
In order to further investigate the fluctuation of the same monitoring position in the different flow channels, the time domain and frequency domain of all the monitoring points P01-P03 in different guide vanes are analyzed. This is shown in Fig. 11 and Fig. 12. Fig. 11 shows that the monitor points in the 6 channels of the guide vane appear successively as wave peaks and troughs, and that the peaks and troughs are changing continuously. The fluctuation frequency is also uniform in a rotating period of the impeller, since the monitoring points in each different flow channel alternately go into the low pressure zone and the high pressure zone. The monitoring points near the inlet of the guide vane stay in the high or low pressure area for a longer time. The duration of its wave peaks and troughs is longer. However, the closer to the outlet, the sharper the wave peaks and troughs appear.
Fig. 10Time domain graph of the pressure fluctuation in each channel of the guide vanes
a) Flow channel 1
b) Flow channel 2
c) Flow channel 3
d) Flow channel 4
e) Flow channel 5
f) Flow channel 6
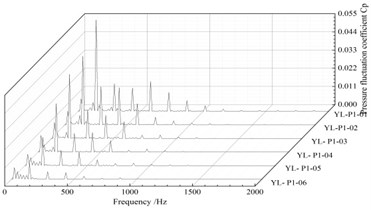
Fig. 12 shows the frequency distribution diagram at the monitoring points in the different channels of the guide vanes. As can be seen from Fig. 12, the amplitude of the pressure pulsation coefficient changes little, and the main frequency is 120 Hz, and the secondary frequency is 240 Hz. This is 1 time and 2 times of the impeller frequency respectively.
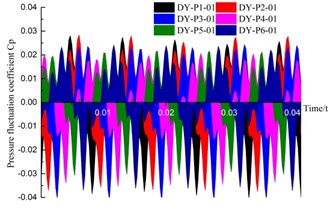
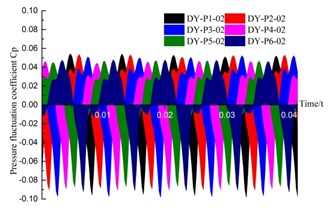
The pressure fluctuation coefficient at the monitoring points at position1 (DY-01) near the outlet of guide vane is the lowest, and the pressure fluctuation coefficient near the inlet of guide vane is the highest, which is 3.2 times that of the outlet. The amplitude of pressure fluctuation in the inlet of the guide vane is larger, which is related to the rotor/stator interaction of the impeller and the guide vane. In addition, the amplitude of the monitoring points near the outlet of the guide vane in different flow channel are slightly different, while the amplitude of the pressure fluctuation coefficient at the other two monitor position is basically the same. This is because the monitoring points near the outlet of the guide vane are in contact with the annular volute, and the diversion of the annular volute chamber has a certain influence on the pressure fluctuation. This causes the pressure pulsation coefficient at the monitoring point in channel 1 (DY-P1) near the outlet of the annular volute chamber to be bigger.
Fig. 11The pressure fluctuation time domain graph at each monitoring point in the guide vane
a) Monitoring points position1
b) Monitoring points position 2
c) Monitoring points position 3
Fig. 12Frequency diagram of the pressure fluctuation at each monitor point in the guide vane
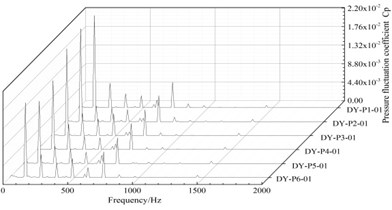
a) Monitoring points DY-01
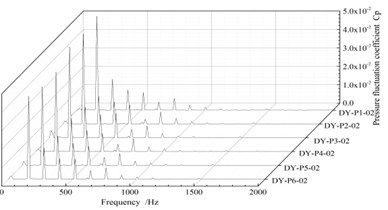
b) Monitoring points DY-02
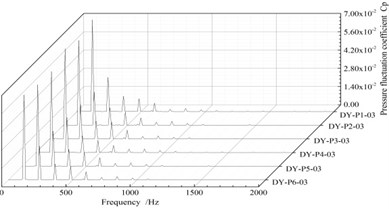
c) Monitoring points DY-03
4.4. Pressure fluctuation analysis of the volute
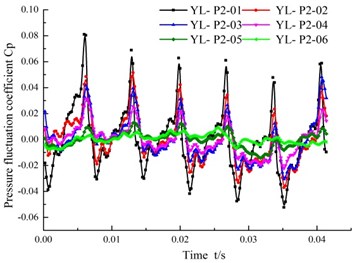
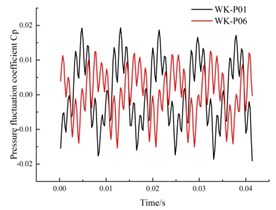
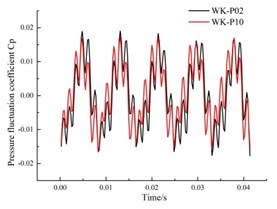
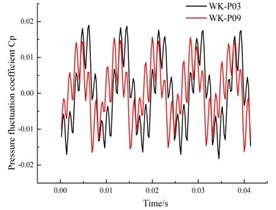
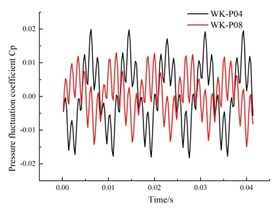
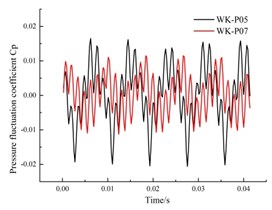
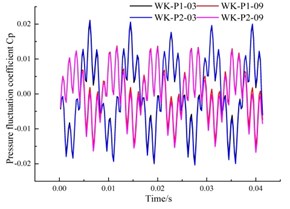
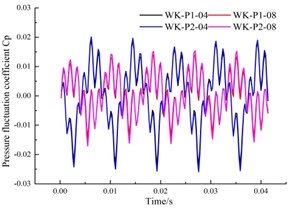
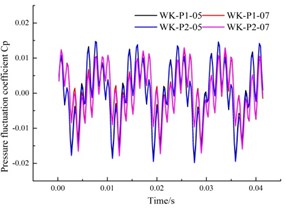
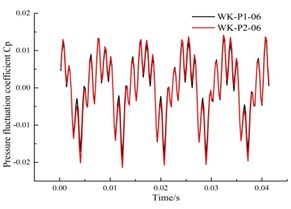
The pressure fluctuation time domain and frequency domain at the monitoring points WK-P01 to WK-P10 in the front pump chamber of the annular volute are shown in Fig. 13 and Fig. 14. The pressure pulsation coefficient curve at the 10 monitoring points in the front pump chamber is similar in shape, but staggered in time, as shown in Fig. 13. There are 5 large wave peaks and troughs during the rotation of the impeller, which matches the number of blades. When the impeller rotates, the blades sweep over the monitoring points, and they alternate between the high pressure zone and the low pressure area. Furthermore, on both sides of the wave peaks and troughs at the monitoring points there appears a number of side peaks of varying amplitude. This is caused by the rotor/stator interaction. The pressure fluctuation generated by the rotating impeller after the rotor/stator interaction with the guide vane, creates most of the pressure fluctuations propagating downstream, but there is still a part of a wave of anti-propagation, which is superimposed on the upstream pressure fluctuation, generating side peaks.
Fig. 13(a) shows the peak value of the pressure fluctuation coefficient at the monitoring point P01 near the outlet of the annular volute is greater than that at the monitoring point P06 at the bottom of the annular volute. The flow near the outlet of the annular volute diffuser is more complicated than that at the bottom of the impeller, so the pressure fluctuation is greater. From Fig. 13(d) and Fig. 13(e) can be seen that, the pressure pulsation amplitude at the monitoring points P04 and P05, located on the right side is larger than that at the symmetrical point. This is because from the inlet direction, guide blades move in a counter clockwise direction, so the flow in the downstream channel of the guide vane is uniform. But the upstream flow will create backflow, and so on. Therefore, the pressure fluctuation is more complex, and fluctuation is also more intense.
Fig. 13Time domain diagram of the pressure fluctuation in the annular volute
a) Monitoring point P01, P06
b) Monitoring point P02, P10
c) Monitoring point P03, P09
d) Monitoring point P04, P08
e) Monitoring point P05, P07
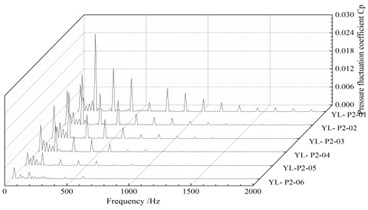
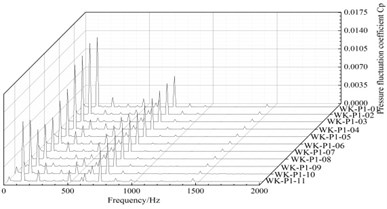
The frequency distribution of the pressure pulsation coefficients at 10 monitoring points on the front pump chamber of the annular volute is shown in Fig. 14. It shows that the pressure pulsation frequency at each monitoring point is 120 Hz, which is the frequency of the blades passing by. The secondary frequency is 725 Hz, which is 30 times the axis frequency. 30 is the minimum common number of the number of impeller blades and vanes blades. Therefore, the pressure fluctuation at each monitor point of the front pump chamber is mainly affected by the impeller rotation and the rotor/stator interaction. The pressure pulsation coefficient at the monitoring point P01 on the outlet diffusion section of the annular volute is the largest, and the pressure fluctuation at the monitoring points P02 and P03 in the outlet of the vane channel upstream is larger.
Fig. 14Frequency domain diagram of the pressure fluctuation in the annular volute chamber
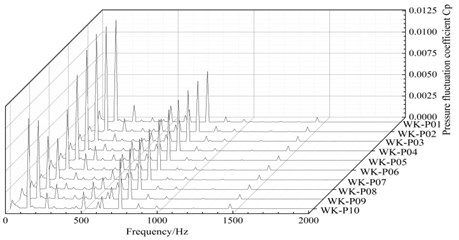
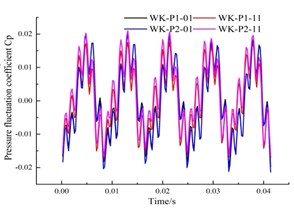
Fig. 15 shows a comparative analysis of the monitoring points in the circumferential part of the annular volute. The curve of changing pressure pulsation coefficient at each monitoring point behaves like that at the monitoring point of the front pump chamber, which is composed of 5 large wave peaks, troughs and some small lateral peaks. It shows that although the location of the sensor in the annulus is different, the fluctuation is basically the same.
Fig. 15Time domain of the pressure fluctuation around a circumferential section of the annular volute
a) Monitoring point P01, P11
b) Monitoring point P02, P10
c) Monitoring point P03, P09
d) Monitoring point P04, P08
e) Monitoring point P05, P07
f) Monitoring point P06
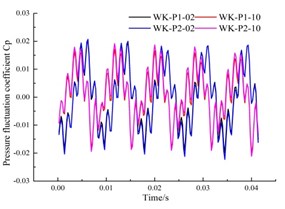
It can be found From Fig. 15 that, both sides of the annular volute chamber have a symmetric structure, the pressure fluctuation is consistent, and the pressure fluctuation curves basically coincides. The two symmetrical points are offset in time, and alternate peaks and troughs appear depending on the time they entered into the low and high pressure zones. In addition, the pressure fluctuation coefficients at the upstream monitoring points P03 and P04 are larger than that their symmetrical measurement point, which is the same as that of the monitoring points in the previously in the pump chamber.
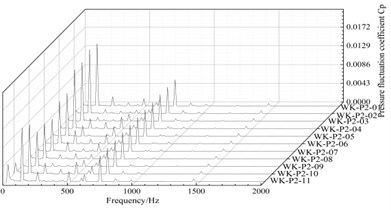
The frequency domain graph of the pressure pulsation in the circumferential portion of the annular volute is shown in Fig. 16. The frequency fluctuation of the pressure pulsation at each monitoring point is basically the same. The main frequency is 120 Hz (1 times the blade frequency), and the secondary frequency is 725 Hz (30 times the axis frequency). Therefore, the pressure fluctuation of the circumferential monitoring point is mainly affected by the rotor/stator interaction between the impeller and the guide vane. The closer upstream, the larger the amplitude of the pressure pulsation frequency domain is at the monitoring point, and the closer to the outlet diffusion section, the greater the amplitude is. The fluid-flow of these two parts is disordered relatively, and the fluctuation is influenced by the superposition of many factors, as a result, the pulsation is larger.
Fig. 16Frequency domain diagrams of the pressure fluctuation in the circumferential part of the annular volute
a) Monitoring points position1
b) Monitoring points position 2
4.5. Pressure fluctuation analysis at outlet
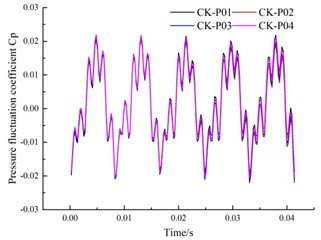
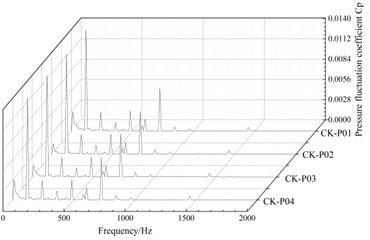
The time and frequency domain distributions of the pressure fluctuation in the outlet diffuser are shown in Fig. 17. As can be seen from Fig. 17, the time domain of the pressure fluctuation at the 4 monitoring points basically coincide with each other. The variation in pressure and amplitude of the frequency domain diagram are consistent.
Fig. 17Time domain and frequency domain diagrams of the pressure fluctuation at the outlet
a) Time domain diagram
b) Frequency domain diagram
It can be seen from Fig. 17(a) that the pressure fluctuation at the outlet monitoring point has roughly 5 wave peaks and troughs. In Fig. 17(b), the main frequency at the 4 monitoring points is 120 Hz (1 times the blade frequency), and the secondary frequency is 725 Hz (30 times the axis frequency, which is the common multiple of vanes and impeller blades), so the pressure fluctuation at the outlet of the annular volute is mainly affected by the rotation of the impeller and rotor/stator interaction between the impeller and the guide vanes.
5. Conclusion
In order to study the pressure pulsation characteristics of the centrifugal pump with guide vanes, an unsteady numerical calculation based on the standard - turbulence model is carried out on a 190 centrifugal pump. The main conclusions are as follows:
1) The effect of the suction partition on the pressure pulsation is not obvious, while the impact of the impeller prevails.
2) The pressure pulsation signals are generated at the impeller outlet and are gradually weakened as it passes to the impeller inlet. The impulse peak and fluctuation intensity of the suction surface of the impeller are less than the pressure surface.
3) The pressure pulsations of the same position in the different flow channels of the guide vanes are the same. They enter the high pressure zone and the low pressure zone alternately, and the closer the monitoring points are to the inlet, the more violent the fluctuation.
4) The pressure pulsation of the monitoring points near the outlet of the spiral volute is more intense, and the pressure pulsation at the upstream points is quite complicated.
5) The pressure pulsations are the same in monitor points which are symmetrical according to the spiral volute center line.
References
-
Guo S., Maruta Y. Experimental investigations on pressure fluctuations and vibration of the impeller in a centrifugal pump with vaned diffusers. JSME International Journal, Vol. 48, Issue 1, 2005, p. 136-143.
-
Shi W. D., Zhang L., Chen B., et al. Influence of gap on pressure pulsation and radial force of centrifugal pumps. Journal of Drainage and Irrigation Machinery Engineering, Vol. 30, Issue 3, 2012, p. 260-264.
-
Ke Q., Liu X. B., Zeng Y. Z. The Influence of pressure pulsation and radial force on centrifugal pumps of different length splitter blades. China Rural Water and Hydropower, Vol. 2007, Issue 3, 2016, p. 135-138.
-
Liu Y., Liang R. D., Jiang Y, et al. Pressure fluctuation near volute tongue and analysis of radial force characteristics of single and double volute pumps. Journal of Lanzhou University of Technology, Vol. 40, Issue 4, 2014, p. 51-55.
-
Su X. J., Shi Y. S., Ying Z. L., et al. Influence of different solids concentration on pressure fluctuation and radial force of solid-liquid two-phase flow centrifugal pump. Science and Wealth, Vol. 9, Issue 8, 2015, p. 1-3.
-
Adkins D. R., Brennen C. E. Analyses of hydrodynamic radial forces on centrifugal pump impellers. Journal of Fluids Engineering, Vol. 110, Issue 1, 1986, p. 20-28.
-
Parrondo J., José G, Pérez G, et al. The effect of the operating point on the pressure fluctuations at the blade passage frequency in the volute of a centrifugal pump. Journal of Fluids Engineering, Vol. 124, Issue 3, 2002, p. 784-790.
-
Barrio R., Parrondo J., Blanco E. Numerical analysis of the unsteady flow in the near-tongue region in a volute-type centrifugal pump for different operating points. Computers and Fluids, Vol. 39, Issue 5, 2010, p. 859-870.
-
Solis M., Bakir F., Khelladi S. Pressure fluctuations reduction in centrifugal pumps: influence of impeller geometry and radial gap. ASME 2009 Fluids Engineering Division Summer Meeting, 2009, p. 253-265.
-
Gonzalez J., Parrondo J., Santolaria C., et al. Steady and unsteady radial forces for a centrifugal pump with impeller to tongue gap variation. Journal of Fluids Engineering, Vol. 128, Issue 3, 2006, p. 454-462.
-
Zhu L., Yuan S. Q., Yuan J. P., et al. Numerical simulation on pressure fluctuations and radial hydraulic force in centrifugal pump with step-tongue. Transactions of the Chinese Society for Agricultural Machinery, Vol. 41, Issue 1, 2010, p. 21-26.
-
Majidi K. Numerical study of unsteady flow in a centrifugal pump. Journal of Turbomachinery, Vol. 127, Issue 2, 2004, p. 805-814.
-
Yang M., Min S. M., Wang F. J. Numerical simulation of pressure fluctuation and radial force in a double volute pump. Transactions of the Chinese Society for Agricultural Machinery, Vol. 40, Issue 11, 2009, p. 83-88.
-
Zhao W. G., He M. Y., Qi C. X., et al. Research on the effect of wear-ring clearances to the axial and radial force of a centrifugal pump. IOP Conference Series: Materials Science and Engineering, 2013, p. 668-672.
-
Zhou L., Shi W., Li W., et al. Numerical and experimental study of axial force and hydraulic performance in a deep-well centrifugal pump with different impeller rear shroud radius. Journal of Fluids Engineering, Vol. 135, Issue 10, 2013, p. 749-760.
-
Cheng X. R., Li R. N., Gao Y., et al. Numerical research on the effects of impeller pump-out vanes on axial force in a solid-liquid screw centrifugal pump. IOP Conference Series: Materials Science and Engineering, 2013, p. 257-260.
Cited by
About this article

The authors would like to thank the support given by the National Natural Science Foundation of China (51239005), Jiangsu Industry University Research Cooperation Innovation Fund forward joint research Project (BY2015064-10), Priority Academic Program Development of Jiangsu Higher Education Institutions (PAPD), Open Subject of Key Laboratory of Fluid and Power Machinery, Ministry of Education, Xihua University (szjj2016-068) and Jiangsu Top Six Talent Summit Project (GDZB-017).
