Abstract
The investigation of the clocking effect mainly concentrates on turbines and compressors, but seldom in centrifugal pumps. In this paper, using numerical simulation and experiment, the influence of the clocking effect on the hydraulic performance of centrifugal pump with guide vane is studied. Numerical simulations with SST - turbulence model were applied to obtain the inner flow field of the test pump. The numerical simulations coincide with the test result, which indicates the accurate of the utilized numerical approach. The results show the clocking positions have an important effect on hydraulic performance of the centrifugal pump with guide vane. The pump demonstrates the higher efficiency and head as the tongue locate between two guide vanes. The hydraulic performance of the volute is a major factor impacting the performance of the centrifugal pump with different clocking positions. However, the clocking position has almost no effect on the performances of the impeller and diffuser. When the guide vane is close to the volute tongue, flow field of volute is more non-uniform, and the energy loss in volute appears to be larger. The results and the method of this paper can provide theoretical reference for the design and installation of guide vane in centrifugal pump.
1. Introduction
The guide vane is a significant flow passage component for rotating machinery and can be applied in turbines, compressors and pumps. The guide vane used in the multistage centrifugal pump can convert kinetic energy to pressure energy and reduce the radial force of the impeller in a single-stage centrifugal pump. However, the clocking positions which altering the relative circumferential located between stator rows or rotor rows is a common phenomenon and has a significant influence on the performance of the rotating machine.
The clocking effect is first discovered by Huber et al. [1] in a 2.5 stage turbine, and the results showed that the performance of turbine could be improved by appropriately adjusting the circumferential position of the wake flow from the first stage stator. Subsequently, they carried out the experiment to study the influence of the circumferential positions between the two stator rows in turbine and obtained a similar conclusion. Thereafter many researchers had adopted both numerical simulation and experiment methods to further study the clocking effect in the turbines and compressors. For example, Hathaway et al. [2], Doney et al. [3], Arnone et al. [4] conducted numerical simulation and experiment on the clocking effect in compressors. They pointed out that the impacting of the stator clocking position on the efficiency could be up to 0.3 %-0.7 %. Städing et al. [5] experimentally investigated the clocking effect on the aerodynamic performance of a 3 stages compressor, and the results indicated that the aerodynamic efficiency under the design condition and low load condition was maximum when the wake flow in the upstream passed through the middle passage of downstream stator, however, it reached minimum while the wake flow from the upstream was closed to the ledge edge of the downstream stator. Cizmas et al. [6] carried out the numerical simulation to study the effect of the clocking position on unsteady pressure of the blade surfaces and obtained the changing rules on the pressure fluctuation and unsteady force of the blade surfaces under the different clocking positions. Haldeman et al. [7] adopted experimental method to explore the impact of the clocking position on the steady and unsteady aerodynamic force in a 1.5 stage compressor, and they pointed out that the time-averaged aerodynamic force changed least under the different clocking positions. The impact of the clocking effect on the inner flow field in the axil compressor has been widely investigated based on the numerical simulation and experimental method [8-16], and the stator clocking effect has a significant impact on the boundary layer, kinetic energy and pressure fluctuation in the downstream region.
Although a large amount of research on the clocking effect has been done in aerodynamic turbo machines, little attention has been devoted to the clocking effect in the centrifugal pump and is mainly focused on the pressure pulsation and the transient radial force [17-19]. Therefore, more research must be done on centrifugal pumps with guide vane. In this paper, the impact of the clocking positions on the hydraulic performance of the centrifugal pumps with guide vane has been studied by adopting both numerical simulation and experiment. And the investigation focuses on the analysis on influencing laws of clocking effect for the hydraulic performance and internal flow field under the different flow conditions and explores the causes of the above analysis. The results can provide theoretical reference for the design and installation of guide vane in centrifugal pump.
2. Geometric models and experiments
2.1. Design parameters
The single-stage centrifugal pump with guide vane was selected to investigate the impact of the clocking positions on the performance. The main geometric characteristics are shown in Table 1. The characteristic parameters include the flow rate and the head . The flow rate is 40 m3/h and the head is 60 m with the rotational speed 2900 rpm. The specific speed was 52.
Table 1Main geometric characteristics
Description | Parameter | Value | Unit |
Impeller | Outlet diameter | 223 | mm |
Outlet blade height | 8 | mm | |
Blade number | 6 | ||
Diffuser | Inlet diameter | 228 | mm |
Outlet diameter | 283 | mm | |
Vane number | 5 | ||
Volute | Base diameter | 284 | mm |
Inlet width | 19 | mm |
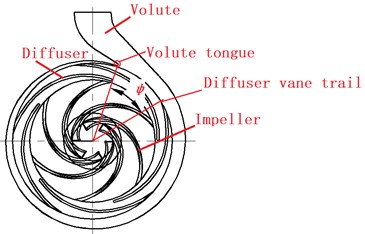
The geometric model and the installation locations of the guide vane are shown in Fig. 1. The diffuser is rotated 12° in turn in an anticlockwise sense to change the positions between the guide vane and volute tongue, and the corresponding installation locations of the diffuser are shown in Table 2.
Fig. 1The geometric model
a)
b)
Table 2Different schemes of numerical simulation
Description | Plan 1 | Plan 2 | Plan 3 | Plan 4 | Plan 5 | Plan 6 |
Diffuser rotation angle /o | 0 | 12 | 24 | 36 | 48 | 60 |
Diffuser installation location /o | 41 | 29 | 17 | 5 | 65 | 53 |
2.2. Experimental facilities
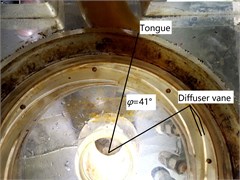
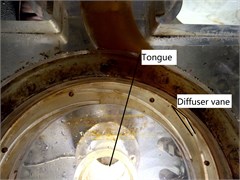
The flow passage components of the test pump which includes impeller, diffuser and volute are made by organic glass, and the diffuser is fixed on the volute by the eight pin holes (as shown in Fig. 1). The pump with the guide vane installed at different positions (as shown in Fig. 2) is tested to investigate the influence of the clocking effect on the hydraulic performance. In order to prove the accuracy of the numerical simulation, the initial installation location between the diffuser vane and the volute tongue is 41°(as shown in Fig. 2). For Position 1 and Position 2, the volute tongue basically locates between two diffuser vanes, and the tongue located near the guide vane trailing edge at Position 3 and Position 4.
Fig. 2Different diffuser installation locations
a) Position 1
b) Position 2
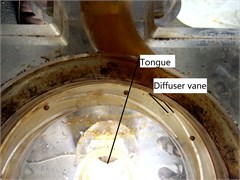
c) Position 3
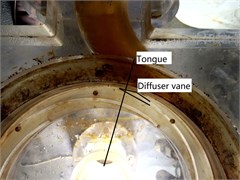
d) Position 4
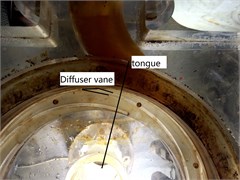
e) Position 5
The measurement methods and test facilities are accord with measurement requirements which described in Ref. [20]. The torque and speed are measured by using the torque transmitter with ±0.2 % full scale measurement error. The full scale measurement error of an electromagnetic flow meter applied to measure the flow rate is ±0.5 %. An uncertainty of the pressure transmitter used to measure the inlet pressure, outlet pressure and instantaneous pressure of pressure taps is ±0.075 %. The electric signals from the all transmitters are converted to digital signals by Data Acquisition Board and LABVIEW software, and the performance curve, pressure fluctuation etc. are consequently obtained.
3. Numerical setup
3.1. Flow solver and mesh generation
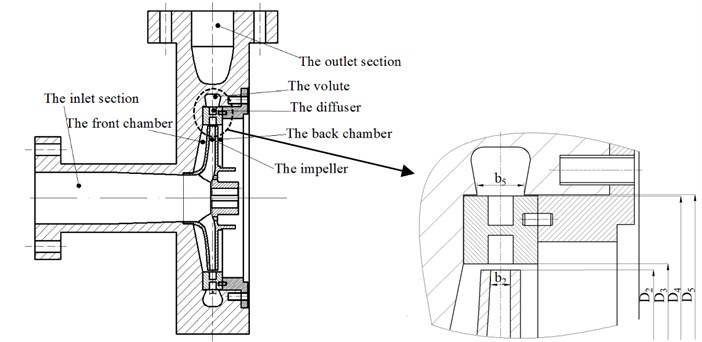
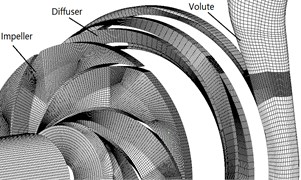
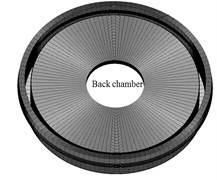
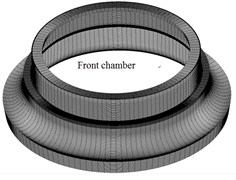
The numerical model of the test pump comprises four modules; each one is generated and meshed independently: a) inlet duct, b) impeller, c) diffuser, d) volute and outlet duct, e) front chamber and back chamber (as shown Fig. 3). The computational grid number can influence the accuracy of the numerical simulation for the centrifugal pump. The more number of grid, the more computer memory and time are required. Thus, the optimal grid number of each calculation area is selected to ensure the accuracy and reliability of numerical simulation. In this paper, five different mesh numbers are applied to numerical calculation (Table 3). Table 4 shows the grid independence analysis under the design conditions with guide installation angle 41°. When the grid number is more than 5.6×10⁶, the ranges of the pump efficiency and head become smaller. Specifically, the ranges of efficiency and head are 0.1 % and 0.2 m, respectively. Thus, to ensure the calculation speed and the calculation accuracy, Grid 3 is used in numerical simulation, and the total grid elements number is approximately 5.61×10⁶ (as shown Table 3). The value of for the entire computational flow domain presented in the paper is between 30 and 50. The inlet and outlet ducts are included in the model to take apart boundary conditions. Meshes of the computational domain are generated in commercial software ICEM CFD 17.1. The entire flow field is meshed with structured hexahedral grid.
Fig. 3Mesh of computational domain
a)
b)
c)
Table 3Grid numbers
Impeller | Diffuser | Volute | Front chamber | Back chamber | Inlet | Outlet | Total grid elements | |
Grid1 | 307890 | 450547 | 654380 | 312876 | 365098 | 318650 | 307546 | 2.7×10⁶ |
Grid2 | 520917 | 580980 | 904578 | 503322 | 588201 | 318650 | 307546 | 3.8×10⁶ |
Grid3 | 776522 | 704558 | 1499703 | 622300 | 630078 | 318650 | 307546 | 4.8×10⁶ |
Grid4 | 946876 | 898541 | 1623098 | 721802 | 748013 | 318650 | 307546 | 5.6×10⁶ |
Grid5 | 122377 | 1257660 | 2008910 | 1044579 | 1177541 | 318650 | 307546 | 6.3×10⁶ |
Table 4Grid independence analysis
Parameters | Grid 1 | Grid 2 | Grid 3 | Grid 4 | Grid 5 |
Head / m | 64.82 | 66.53 | 67.13 | 68.23 | 68.44 |
Efficiency / % | 53.23 | 54.35 | 55.49 | 55.54 | 55.57 |
The numerical simulation for a single stage centrifugal pump with guide vane is performed by commercial code ANSYS-CFX 17.1 with SST - turbulence model [21, 22]. The pressure at the pump inlet and mass flow at pump outlet are in accordance with the experimental measurement. The no-slip boundary condition is imposed to all physical surfaces of the pump. The interfaces between the stationary and rotational components are set as the frozen-rotor and the transient-rotor-stator methods for steady and unsteady calculations, respectively. In the unsteady numerical simulation, the steady-stage simulation is taken as an initial calculation condition of transient simulation, and time step is 5.74×10⁻⁵s which corresponded to a rotating angle of 1° for every time step at 2900 rpm rotation speed. The time for one cycle is 0.02 s and 6 rounds are simulated.
3.2. Governing equation
The internal flow of the impeller, guide vane etc. in hydraulic machinery is three-dimensional viscous incompressible unsteady flow. The expression of Navier-Stoke equations in the rectangular coordinate system is as follows:
where is the density of the fluid, is speed, is pressure, is time, is space coordinate, is dynamic viscosity, is source item, and are the component of the coordinate axis.
In this paper the SST - turbulence model is used, which combined the - turbulence model and the - turbulence model. Meanwhile, it has the accuracy of calculating viscous flow in the near wall region and the accuracy of free flow in the far field, and the main calculation equations are as follows:
where is the generation of Turbulence Kinetic Energy; is the generation of turbulent dissipation rate; and are the diffusion coefficient of and ; and are the dissipative term of and ; is Lateral diffusion term; , are the standby user defines item of the original. Effective diffusion coefficient as follows:
where , is turbulence Prandtl number of and ; is turbulence viscosity coefficient. Related calculation equations as follows:
where is low Reynolds number correction factor. Calculation method is as follows:
In the formula, , 6, and 0.072. In high Reynolds number flow, 1. Calculation method of mixed function is as follows:
where is the distance from the wall; is the positive component of the lateral diffusion term.
3.3. Numerical method validations
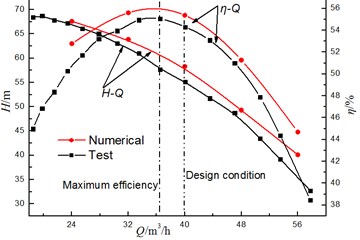
Fig. 4 shows a comparison of the experimental and numerical results for the head and efficiency of the model pump with diffuser installation angle 41°. The maximum efficiency of the model pump cannot be at the design condition ( 40 m3/h) but deviates from the design condition ( 37 m3/h), which may be attributed to the smaller throat area of the diffuser. The numerical results are in good agreement with that of the experiment, especially under the pump operating flow area ( 37 m3/h-48 m3/h). For example, at 40 m3/h, the predicted error between the theoretical results and the experimental data for total head and pump efficiency is 5.1 % and 1.8 %, respectively. The pump head and the efficiency predicted numerically are higher than those obtained experimentally, which may be attributed to neglect of leakage loss through balancing holes and mechanical loss by mechanical seal and bearing. The comparison between the experimental and numerical results indicates that the grid discretization and turbulence model are suitable for the simulation of a centrifugal pump with the guide vane.
Fig. 4Comparison of the hydraulic performance between the numerical and test results at φ= 41°
The comparison of the pressure fluctuation for monitoring point P1 and P2 (as shown Fig. 5) between the numerical and experimental results in volute at 40 m3/h are shown in Fig. 6 and Fig. 7 to further verify the accuracy of the numerical results. In the numerical simulation, the pressure pulsation curves are similar to experimental results, and they present periodic fluctuation due to the interaction between volute tongue and impeller.
Fig. 5Monitoring points P1-P2 in volute
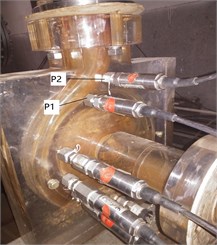
The predicted pulsation of the pressure for P1 is in great agreement with the experimental result, but for P2, it presents poorly. Whether in the numerical and experiment results, the flow frequency for both P1 and P2 is the blade-passing frequency (). Meanwhile, the numerical pressure amplitudes at are higher than test results.
Fig. 6Comparison of the pressure fluctuation at P1 between the numerical and test results at φ= 41°
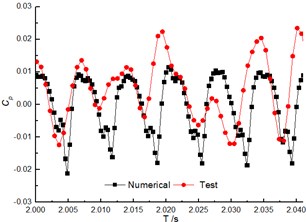
a) Time domain of pressure pulsation
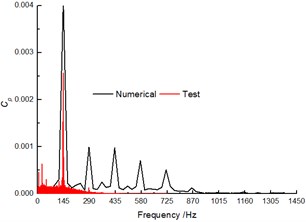
b) Frequency spectra of pressure fluctuation
Fig. 7Comparison of the pressure fluctuation at P2 between the numerical and test results at φ= 41°
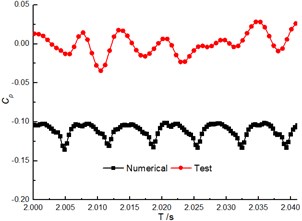
a) Time domain of pressure pulsation
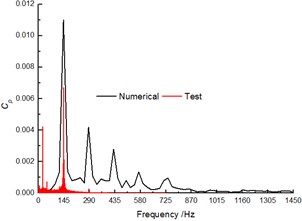
b) Frequency spectra of pressure fluctuation
4. Experimental results
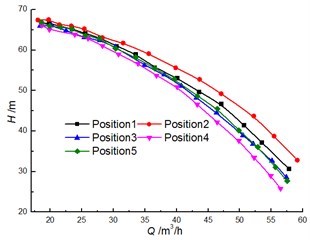
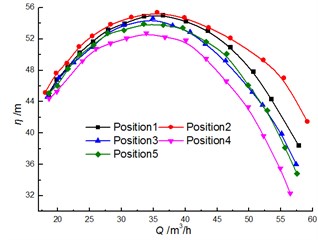
Fig. 8 shows a comparison of the experimental results for head and efficiency at different clocking positions. It is noted that the clocking positions have a great influence on the hydraulic performance of a centrifugal pump with guide vane. The test results show that the head and efficiency gradually decrease with the diffuser vane approaching the volute tongue. For example, the head and the efficiency of the model pump achieve the maximum at Position 1 and Position 2, and they reach minimum at Position 4. The head and efficiency differences between Position 1 and Position 2 increase with the flow rate. And they can reach 4.8 m and 3.6 % at 40 m3/h, respectively. Thus, the impact of clocking position on the hydraulic performance of a centrifugal pump with guide vane cannot be neglected.
Fig. 8Comparison of performance under different clocking positions
a)-
b)-
Table 5Pressure amplitudes at fBPF for P1
Description | 12.5 m3/h | 20.27 m3/h | 25.48 m3/h |
Position 1 | 1561.78 Pa | 1154.67 Pa | 1025.26 Pa |
Position 2 | 1482.1 Pa | 645.70 Pa | 1052.47 Pa |
Position 3 | 753.62 Pa | 296.11 Pa | 264.52 Pa |
Position 4 | 443.85 Pa | 211.31 Pa | 588.3 Pa |
Position 5 | 1256.37 Pa | 1121.49 Pa | 1131.12 Pa |
Table 6Pressure amplitudes at fBPF for P2
Description | 12.5 m3/h | 20.27 m3/h | 25.48 m3/h |
Position 1 | 4515.61 Pa | 3010.88 Pa | 4505.06 Pa |
Position 2 | 1787.93 Pa | 1191.12 Pa | 938.79 Pa |
Position 3 | 1118.55 Pa | 405.84 Pa | 2212.16 Pa |
Position 4 | 539.5 Pa | 358.04 Pa | 348.73 Pa |
Position 5 | 4996.11 Pa | 2693.87 Pa | 2151.93 Pa |
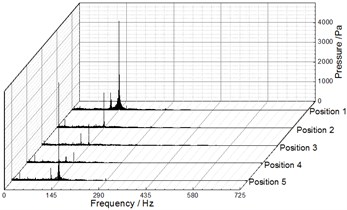
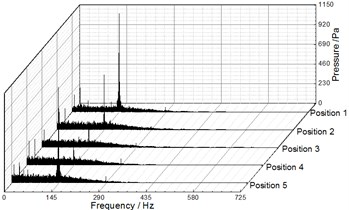
Fig. 9, Fig. 10 and Fig. 11 illustrate the frequency domain of static pressure pulsations within the volute under different flow rates, respectively. For the five diffuser installation positions, the flow frequency at the two monitoring points (P1, P2) is the blade-passing frequency. And the pressure amplitudes at gradually increase along the volute flow channel. For example, when 20.27 m3/h, the pressure amplitudes of P1 and P2 for Position 1 at are 1154.67 Pa and 3010.88 Pa respectively (as shown in Table 4 and Table 5). The clocking position has a significant effect on the pressure amplitudes at , while it has little impact on them at the shaft-frequency and the harmonic frequency. As the guide vane gradually approaches the volute tongue, the pressure amplitudes at decrease, and they reach the minimum at Position 4 under different flow rates (as shown Table 5 and Table 6). Therefore, it is rather clear that the clocking positions have a significant impact on the pressure pulsation caused by the interaction between impeller blade and volute tongue.
Fig. 9Frequency spectra of pressure fluctuation at Q= 12.25 m3/h
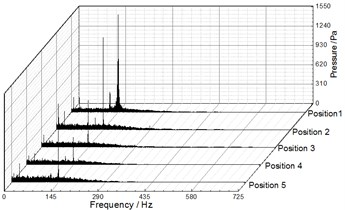
a) P1
b) P2
Fig. 10Frequency spectra of pressure fluctuation at Q= 20.25 m3/h
a) P1
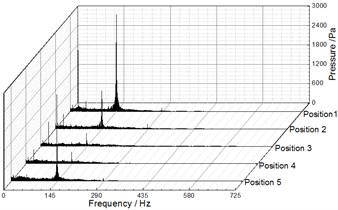
b) P2
Fig. 11Frequency spectra of pressure fluctuation at Q= 25.48 m3/h
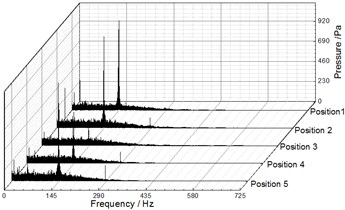
a) P1
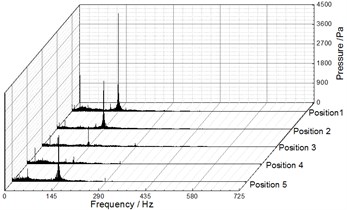
b) P2
5. Numerical results
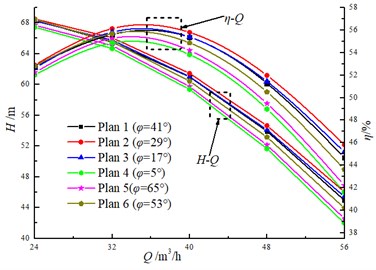
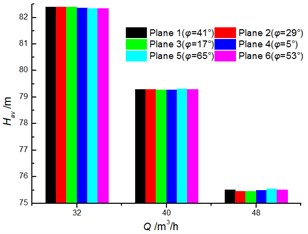
Fig. 12 illustrates the comparison of the numerical simulation results on the hydraulic performance under different diffuser installation positions. The clocking effect has a significant impact on the head and efficiency of the model pump. As the guide vane gradually approaches the volute tongue, the head and efficiency gradually decrease. And they reach the maximum while the tongue lies between two diffuser vanes. For Plane 1 ( 29°), the pump achieves the maximum head and efficiency, but it becomes the minimum one at Plane 1 ( 5°). Meanwhile, the differences between 29° and 5° increase with the flow rate increasing. For example, at 24 m3/h and 32 m3/h, the difference between 29° and 5° are 1 % and 1.4 % for the efficiency respectively, and it is 2.2 %, 2.4 %, 4.5 % at 40 m3/h, 48 m3/h and 56 m3/h respectively. Thus, the conclusions obtained numerically are similar with those obtained by experiment (as shown in Fig. 8), and the accuracy of the numerical simulation is further validated.
Fig. 12Comparison of the numerical simulation results on hydraulic performance
The impeller is an important flow passage in a centrifugal pump, thus the performance of the impeller is defined as follows:
where is the transient performance of impeller; and are the transient average total pressure at the outlet and inlet under the absolute coordinate system, respectively.
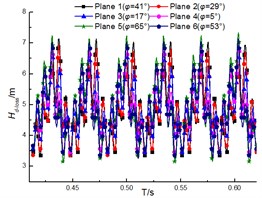
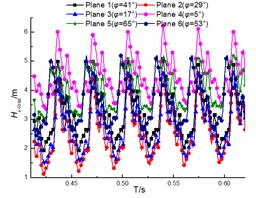
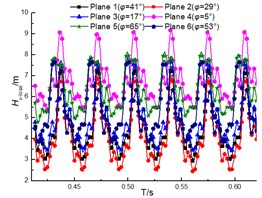
Fig. 13 shows the unsteady performance of the impeller. It is noted that the performance of the impeller decreases with increase of the flow rate, which indicates the head of the pump drops when the flow rate increases. The periodic fluctuations of performance can be clearly observed due to the interaction between the impeller and the diffuser under different flow rates. The clocking position has little impact on the performance of the impeller, and it is similar with fluctuation and magnitude under different diffuser installations at the same flow rates. And the differences under different clocking positions cannot exceed 0.2 m (as shown in Fig. 14), thus the effect of clocking position on the hydraulic performance of pumps cannot be dominated by the performance of impellers.
Fig. 13Performance of the impeller under different diffuser installations
a) 32 m3/h
b) 40 m3/h
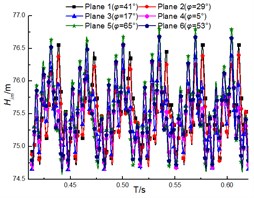
d) 56 m3/h
Fig. 14Comparison of the instantaneous average for impeller under different clocking positions
The diffuser and the volute are important flow components in a centrifugal pump with guide vane, and the main functions are converting kinetic energy to pressure energy. Thus, the performance of the diffuser and volute are defined as follows:
where is the transient total pressure loss; and are the transient average total pressure at inlet and outlet, respectively.
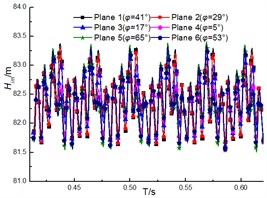
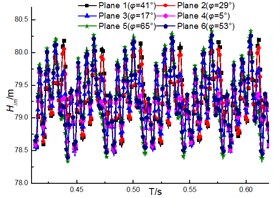
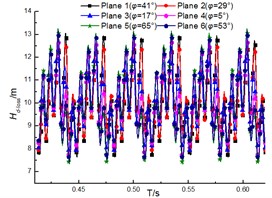
The transient total pressure loss for the guide vane and volute are as shown in Fig. 15 and Fig. 16. The results illustrate that the total pressure loss in both diffuser and volute increases with the flow rate, and the loss pulsation presents the periodic pulsation due to the interaction between rotor and stator. However, the loss fluctuation for diffuser is more violent than that for volute. And this is that the inner flow field in the diffuser is affected by both the upstream and the downstream region, but the upstream region is the major factor for affecting that in the volute.
Fig. 15Total pressure loss of diffuser under different diffuser installations
a) 32 m3/h
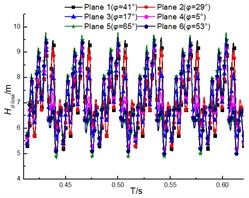
b) 40 m3/h
d) 56 m3/h
Fig. 16Total Pressure loss of volute under the different diffuser installations
a) 32 m3/h
b) 40 m3/h
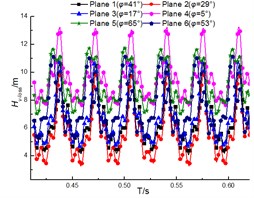
d) 56 m3/h
The clocking positions have little influence on the total pressure loss of diffuser, while it has a significant effect on that for volute [17]. The differences of the loss for diffuser under different clocking positions cannot exceed 0.2 m (as shown in Fig. 17), thus the impact of clocking position on the hydraulic performance of pump cannot be dominated by the performance of diffuser. The influence of the clocking effect on the total pressure loss in the volute increases with the flow rate. When the diffuser vane locates near the volute tongue ( 5°), the total pressure loss for volute achieve maximum, but it reaches minimum at 29°. Meantime, the difference between 29° and 5° is 2.5 m, 3 m and 4 m at 32 m3/h, 40 m3/h and 56 m3/h, respectively (as shown in Fig. 18). Thus, the inner flow field in volute is the major factor affected by the hydraulic performance of a centrifugal pump with guide vane under different diffuser installation positions.
Fig. 17Comparison of the instantaneous average for diffuser under different clocking positions
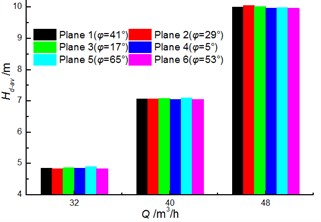
Fig. 18Comparison of the instantaneous average for volute under different clocking positions
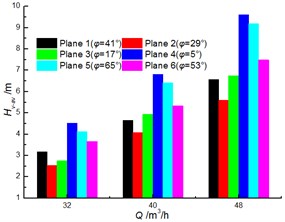
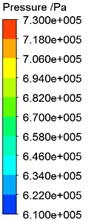
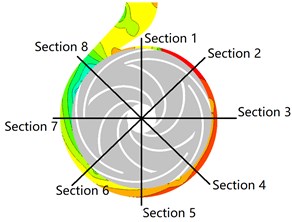
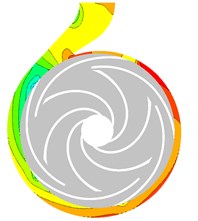
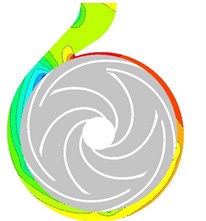
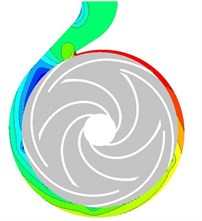
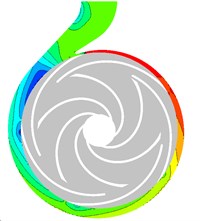
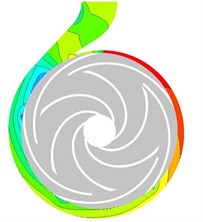
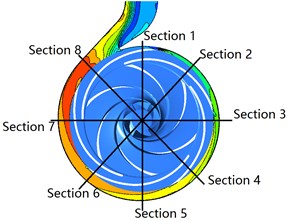
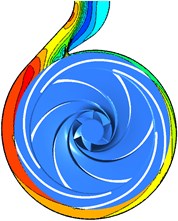
Fig. 19 shows the total pressure contour in volute under different clocking positions at 40 m3/h. The Section 1-Section 8 represents the corresponding eight flow sections of volute. A similar phenomenon that the total pressure gradient in volute tongue region and the region located near the guide vane trailing edge are larger variety, indicating that the total pressure loss in these regions is higher than those in other regions. The trailing edge of the suction of the diffuser vane is the main factor affecting the total pressure gradient changing in the flow section of the volute. The clocking effect has a significant influence on the total pressure in volute. The total pressure in volute decreases as the guide vane is close to the tongue, especially in region near the tongue, the volute outlet region and the large flow section. For 5°, the total pressure gradient achieves maximum variety, and it reaches minimum for 29°, which indicates that the flow field in the volute at 29° is more non-uniform than that at 5°. Meantime, a lower total pressure loss occurs when guide vane gradually approaches the tongue.
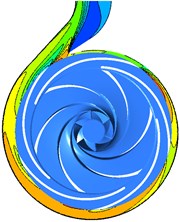
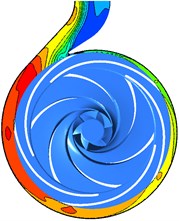
Fig. 20 shows the influence of different clocking positions on the static pressure in the volute at 40 m3/h. It is noted that the static pressure of each cross section of the volute gradually decreases as the guide vane is close to the volute tongue. The static pressure gradient gradually increases at the trailing edge of the guide vane and the volute tongue region when the diffuser vane approaches the volute tongue, indicating that the flow field in the volute can be non-uniform and causes larger hydraulic loss to reduce the hydraulic performance of centrifugal pump. For 41°, 29° and 17°, the high pressure region locate at Section 1-Section 5, and pressure distribution in the volute cross section of passage is more uniform, but for other installation positions, the high pressure region locate at Section 1-Section 3 and the pressure gradient greatly changes. The pressure is minimum and static pressure gradient change maximum, especially in the area of Section 8 when the diffuser vane installation positions are 5°and 65°, indicating that the velocity in volute is larger and the internal flow field of volute is uneven which produce larger hydraulic loss and make poorly hydraulic performance of volute.
Fig. 19Total pressure contours in volute under the different clocking positions at Q= 40 m3/h
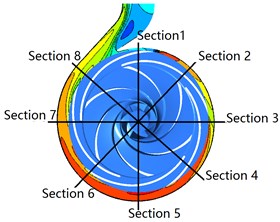
a) Plane 1 ( 41°)

b) Plane 2 ( 29°)
c) Plane 3 ( 17°)
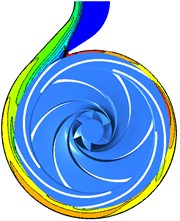
d) Plane 4 ( 5°)
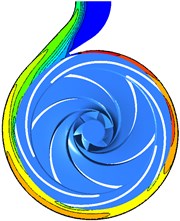
e) Plane 5 ( 65°)
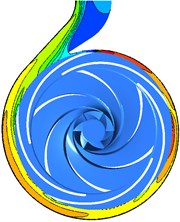
f) Plane 6 ( 53°)
Fig. 20Pressure contours in volute under the different clocking positions at Q= 40 m3/h
a) Plane 1 ( 41°)
b) Plane 2 ( 29°)
c) Plane 3 ( 17°)
d) Plane 4 ( 5°)
e) Plane 5 ( 65°)
f) Plane 6 ( 53°)
The hydraulic loss in volute is related to the absolute velocity. The direction of the velocity cannot be a variety with the flow rate increasing due to the geometry of the volute. The velocity in the flow section of volute increases as the diffuser vane get close to the tongue and the region of high-velocity extends. For 41°, 29°and 17°, the velocity reaches maximum and the high-velocity region locates between Section 7 to Section 8, but it reaches minimum for 5° and 65°, and the high-velocity region extends to Section 5 (as shown in Fig. 21) These results indicate that the hydraulic loss generated by the velocity at 41°, 29°and 17°is higher than other diffuser installation angles. Due to the tongue, the fluid in volute can be divided into two parts: flowing to the volute outlet and the flow passage of volute along the flow section. When the volute tongue locates between two diffuser vanes, the swirl appears in the region of the suction vane due to the flow collision between the volute inlet and diffuser outlet, and the fluid in the region adjacent to Section 1 flows reversely to the volute outlet. However, the fluid flows directly to the volute outlet when guide vane located near the tongue, causes higher mass flow from Section 1 to Section 8 (as shown in Fig. 22) and larger velocity (as shown in Fig. 21).
Fig. 21Velocity contours in volute under the different clocking positions at Q= 40 m3/h
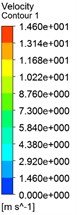
a) Plane 1 ( 41°)

b) Plane 2 ( 29°)

c) Plane 3 ( 17°)
d) Plane 4 ( 5°)
e) Plane 5 ( 65°)

f) Plane 6 ( 53°)
Fig. 22Velocity Streamline in the near tongue Q= 40 m3/h
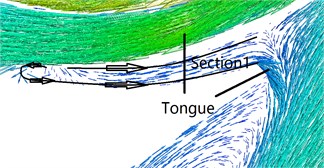
a) Plane 2 ( 29o)

b) Plane 4 ( 5o)
6. Conclusions
In this study, the influence of the clocking effect on the hydraulic performance of a radial centrifugal pump with guide vane is researched. The performance of pumps is tested by both experiment and numerical simulation. Although leakage through the balancing holes and mechanical seals is not included in the numerical models, the differences of the total head and pump efficiency between the numerical and experiment are 5.1 % and 1.8 % at 40 m3/h, respectively. Meantime, the predicted pulsation of the pressure at each monitoring point is in agreement with the experimental result.
According to the experimental results, it can be observed that the head and the efficiency decreased gradually as the guide vane get close to the volute tongue, and at 40 m3/h, the differences of the head and efficiency between the volute tongue located in middle of two diffuser vane and the tongue approached to the diffuser vane can reach 4.8 m and 3.6 %, respectively. However, the pressure pulsation in volute achieves maximum as the tongue located between two diffuser vanes. Thus, the clocking position has a great impact on the performance of the pump and cannot be neglected.
It is noted that the major factor impacting on the hydraulic performance of the pump under different clocking positions is the performance in volute rather than that in impeller and diffuser, and the differences for the performance of impeller and the energy loss in diffuser under different clocking positions cannot exceed 0.2 m. The energy loss pulsation in diffuser becomes more violent than that in volute due to the effect of both upstream and downstream region for the inner flow field in a diffuser. The volute can obtain better hydraulic performance when the tongue lies between two diffuser vanes, and it presents worse when the guide vane approaches the tongue, and the difference can research 2.5 m, 3 m and 4 m at 32 m3/h, 40 m3/h and 56 m3/h, respectively.
The total pressure loss in diffuser and volute increases with the flow rate. The total pressure gradient changes greatly in the region near the tongue, the volute outlet and the large flow section of the volute. It indicates that these regions have more total pressure loss. The energy loss is higher as the guide vane approaches the tongue. Meanwhile, the flow field in the volute is more non-uniform when the volute located in the near middle of the two diffuser vane. Thus, the inner flow field in volute is the major factor affecting the hydraulic performance of a centrifugal pump with guide vane under different diffuser installation positions.
References
-
Huber F. W., Johnson P. D., Sharma O. P., et al. Performance improvement through indexing of turbine airfoils. Part 1: experimental investigation. Journal of Turbomachinery, Vol. 118, Issue 4, 1996, p. 630-635.
-
Barankiewicz W. S., Hathaway M. D. Effects of stator indexing on performance in a low speed multistage axial compressor. ASME International Gas Turbine and Aeroengine Congress and Exhibition, Orlando, Florida, 1997.
-
Dorney D. J., Sharma O. P., Gundy Burlet K.-L. Physics of airfoil clocking in a high-speed axial compressor. International Journal of Turbo and Jet Engines, Vol. 15, Issue 4, 1998, p. 259-270.
-
Arnone A., Marconcini M., Pacciani R., et al. Numerical investigation of airfoil clocking in a three-stage low pressure turbine. Journal of Turbomachinery, Vol. 124, Issue 1, 2002, p. 61-68.
-
Städing J. D., Wulff G., et al. An experimental investigation of stator clocking effects in a two-stage low-speed axial compressor. Turbine Technical Conference and Exposition, 2011, p. 275-281.
-
Cizmas P. G. A., Dorney D. J. The influence of clocking on unsteady forces of compressor and turbine blades. International Journal of Turbo and Jet Engines, Vol. 17, Issue 2, 2000, p. 133-142.
-
Haldeman C. W., Krumanaker M. L., Dunn M. G., et al. Influence of clocking and vane/blade spacing on the unsteady surface pressure loading for a modern stage and one-half transonic turbine. Journal of Engineering Thermo Physics, Vol. 125, Issue 4, 2003, p. 327-338.
-
Mailach R., Vogeler K. Rotor-stator interactions in a four-stage low-Speed axial compressor-Part I: Unsteady profile pressures and the effect of clocking. Journal of Turbomachinery, Vol. 126, Issue 4, 2004, p. 833-845.
-
Key N. L., Lawless P. B., Fleeter S. An Experimental study of vane clocking effects on embedded compressor stage performance. Journal of Turbomachinery, Vol. 132, Issue 1, 2010, p. 1973-1984.
-
Mileshin V., Druzhinin Y., Stepanov A. Numerical and experimental investigations of clocking effect in a two-stage compressor with π C = 3.7. Turbine Technical Conference and Exposition, 2015.
-
Jiang H., Xi Guang, Zhang W. Experimental investigation of stator clocking in a centrifugal compressor. Journal of Engineering Thermo Physics, Vol. 30, Issue 6, 2009, p. 964-966.
-
Yan P., Yao H., Han W. Numerical study of influence of rotor blades’ clocking effect on aerodynamic performance of a multistage compressor. Proceedings of the CSEE, Vol. 32, Issue 26, 2012, p. 118-125.
-
Rzadkowski R., Gnesin V., Kolodyazhnaya L. Stator clocking in first stage of SO-3 compressor. Advances in Vibration Engineering, Vol. 10, Issue 2, 2011, p. 119-131.
-
Schennach O., Pecnik R., Woisetschläger J., et al. The effect of vane clocking on the unsteady flowfield in a one and a half stage transonic turbine. Turbomachinery, Vol. 130, Issue 3, 2007, p. 538-544.
-
Ouml S., Stoffel N. Experimental investigation of the clocking effect in a 1.5-stage axial turbine – part I: time-averaged results. Journal of Turbomachinery, Vol. 131, Issue 2, 2009, p. 21003.
-
König S., Stoffel B., Schobeiri M. T. Experimental investigation of the clocking effect in a 1.5 Stage axial turbine – part II: unsteady results and boundary layer behavior. Journal of Turbomachinery, Vol. 131, Issue 2, 2009, p. 21004.
-
Wei Jiang, Guojun Li, Pengfei Liu Numerical investigation of the influence of the clocking effect on the unsteady pressure fluctuations and radial forces in the centrifugal pump with vaned diffuser. International Communications in Heat and Mass Transfer, Vol. 71, 2016, p. 164-171.
-
Wanshi Qu, Lei Tan, Shuliang Cao Numerical investigation of clocking effect on a centrifugal pump with inlet guide vanes. Engineering Computations, Vol. 33, Issue 2, 2016, p. 465-481.
-
Minggao Tan, Naichang He, Houlin Liu Experimental test on impeller clocking effect in a multistage centrifugal pump. Advances Mechanical Engineering, Vol. 8, Issue 4, 2016, p. 1-10.
-
Pumps R. Rotodynamic Pumps – Hydraulic Performance Acceptance Tests – Grades 1 and 2. ISO 9906:1999, 2007.
-
Boccazzi A., Sala R., Gaetani P. Flow field in the vaned diffuser of a centrifugal pump at different vane setting angles. Journal of Fluids Engineering, Vol. 134, Issue 3, 2012, p. 369-380.
-
Olivier Petit, Håkan Nilsson Numerical investigations of unsteady flow in a centrifugal pump with a vaned diffuser. International Journal of Rotating Machinery, 2013, p. 961580.
Cited by
About this article

This work was supported by the scientific research foundation of National Natural Science Foundation-Outstanding Youth Foundation (51622906), National Science Foundation (51479173,51509209), Fundamental Research Funds for the Central Universities (201304030577), Scientific research funds of Northwest A&F University (2013BSJJ095), the scientific research foundation on water engineering of Shaanxi Province (2013slkj-12, 2017slkj-5), the Science Fund for Excellent Young Scholars from Northwest A&F University and Shaanxi Nova Program (2016KJXX-55), the scientific research foundation from Northwest A&F University (Z109021642).
