Abstract
The reported researches only analyze vibration parameters of the seed-metering device. However, they do not adopt any algorithm to conduct a multi-objective optimization for the vibration performance of the seed-metering device. In this paper, the vibration of the seed-metering device is numerically computed firstly, and the correctness of the computational model is validated by experimental test. Then, some parameters including the plate thickness, inclination angle, excitation source position and supporting leg thickness of the seed-metering device are studied. In this way, those parameters which have serious impacts on the vibration are obtained. Therefore, the vibration performance is tried to optimize using these parameters as the design variables. This paper proposes a novel multi-layer immune algorithm based on genetic algorithms (ML-IGA). In order to further verify validity of the novel ML-IGA model for optimizing the vibration of the seed-metering device, it is compared with the traditional GA model and PSO-GA model. When the iteration of ML-IGA model was conducted to the 156th generation, the predicted error is smaller than the set critical error. Compared with other two kinds of algorithms, the optimized time is reduced. Regarding optimization of the GA model, the vibration amplitudes are increased by 2.49 % and 4.22 % respectively. Regarding optimization of the PSO-GA model, the vibration amplitudes are increased by 9.74 % and 6.024 % respectively. Regarding optimization of the ML-IGA model, the vibration amplitudes are increased by 17.34 % and 6.78 % respectively. Obviously, structures with better performance can be obtained through using the novel ML-IGA model.
1. Introduction
In recent years, vibration seed-metering devices have been studied and applied widely because they bring no damage and could get adapted to different seeds. Vibration seed-metering devices are mainly divided into mechanical vibration type, electromagnetic vibration type, and pneumatic vibration type [1-5]. Pneumatic vibration types are widely applied in protective sowing operations. Straws and residues are on the surface of protective farming lands, so vibration characteristics of seed-metering devices are different from those during common farming. Vibrations can seriously influence population motion status in a seed chamber. When the vibration is relatively small, populations have a small motion speed and fluidity, and repeated suction rate of seed suction holes is relatively high. When the vibration is relatively serious, the motion speed of populations is high, seed suction of seed suction holes is difficult and suction missing rate is relatively high. Proper vibrations can reduce the suction missing rate and repeated suction rate of seed suction holes relatively [6, 7]. Therefore, it is very necessary to study vibration parameters of pneumatic vibration seed-metering devices.
At present, a lot of scholars have made researches on vibration characteristics of seed-metering devices. Sun [8] designed structures and dimensions of seed suction holes according to seeds. He also conducted an optimization design on structural parameters of horizontal round-disk seed-metering devices. Song [9] designed a seed-metering device with variable seed suction holes, where adaptability of the seed-metering device to seeds with different shapes and sizes was improved through changing the depth of seed suction holes. Liao [10] established a discrete element model of a centrifugal seed-metering device, and conducted simulation analysis on seed motion during operation of the centrifugal seed-metering device. In order to study vibration parameters of the pneumatic seed-metering device and impacts of the vibration on maize population motion, Zhang [11] used an acceleration sensor and a vibration test system to test vibration characteristics of the seed-metering device and analyzed vibration signals using MATLAB. In order to obtain impacts of design parameters of a seed-metering device on vibration characteristics accurately, Chen [12] applied ADAMS software to establish a simulation model of the seed-metering device and conducted dynamic simulation. Hu [13] adopted the Hertz-mindlin contact model to establish a simulation model of seeds and seed-metering devices to study impacts of vibration frequency and amplitude on performance of the seed-metering device. Results showed that when the vibration frequency was 40 Hz and the vibration amplitude was 0.5 mm, the population stacking height was stable, and stable seed supply was achieved. Yu [14] used an approximate model to establish a complete model of the seed-metering device. The motion and dynamic characteristics of hinged points were simulated by rod elements; natural frequencies and modes on top 4 orders were analyzed. In order to further improve accuracy of ordered arrays, Yu [15] studied horizontal vibration characteristics of a vibration plate. Results showed that leaps of rice seeds can be avoided effectively when the excitation frequency was 4.5 Hz, vibration amplitude was 3.5 mm and vibration plate inclination was 10°. Liu [16] applied range and variance analysis to study impacts of vibration parameters of the seed plate on the seed suction rate. To improve the operating efficiency of seeders and enable the seeder-metering device to keep good metering performance at different speeds, an [17] proposed a multifunctional smart test bench for STB-700 seeder-metering devices, which was used for metering and seeding tests with two different kinds of soybean and maize seeds.
The mentioned researches only analyze vibration parameters of the seed-metering device. However, they do not adopt any algorithm to conduct an optimization design for vibration performance of the seed-metering device. Yu [18] applied orthogonal experiments to study impacts of each parameter of the seed-metering device on the sequencing effects. The impact sequence of parameters and a group of optimized structural parameters were obtained. Yang [19] analyzed related structures of the seed-metering device and conducted orthogonal experiments of parameters. Main parameters which could affect the seed-metering device were determined. However, optimized results of the orthogonal experiment are not accurate and the convergence speed was very slow, so data rules can hardly be determined.
Common optimization methods can easily get trapped in local extreme values, which could lead to endless loop and iteration termination [20-25]. Therefore, the paper proposes a novel multi-layer immune algorithm based on genetic algorithms (ML-IGA). The model is divided into an upper layer and a lower layer. The antibody sub-population on the lower layer and the antibody sub-population on the upper layer are organized. There are sub-populations in the lower-layer antibody sub-population, and each sub-population has antibodies. A population is divided into multiple sub-populations, so diversity of individuals in the population can be maintained effectively, and the search characteristics of the traditional genetic algorithm are maintained [26-28]. Adaptive characteristics of the immune algorithm are used to solve the multi-objective function solution [29-31]. Defects including premature convergence and high sensitivity to problem scale presented in application of the single-population evolution computation can be avoided effectively. Through using the competition-type co-evolution, the convergence speed and convergence accuracy of each lower-layer subpopulation can be increased effectively. Through upgrade, lower-layer sub-populations are upgraded to the higher layer in order to constitute a higher-layer antibody sub-population. A parallel genetic algorithm based on collaborative cooperation is used for operations on the higher layer. The information communication and cooperation are achieved through the individual migration. Through the updating, sub-populations obtained after higher-layer optimization are updated to corresponding lower-layer sub-populations. Finally, the proposed ML-IGA method is applied to a multi-objective optimization of the seed-metering device. Therefore, the structure with optimal performance is obtained.
2. Numerical computation for vibration modals of the seed-metering device
The seed-metering device is composed of pneumatic vibrator, vibration plate and supporting legs. Cyclic excitation forces provided by the pneumatic vibrator can make the vibration plate generate reciprocating motion. Under effects of gravity and traction inertia forces, seeds on the vibration plate would slide forwards along the vibration plate. When the seed-metering device vibrates, root parts of the supporting legs are fixed on a lower support by belts. The complete system is connected to upper parts of the supporting legs. Lower parts of supporting legs can also be deemed to be fixed, namely fixed constraint. Upper parts of the supporting legs are connected to the left and right brackets of the vibration plate, and they are also firmly connected by belts. Supporting legs and the vibration plate are objects of the finite element analysis. Solid models of them are established respectively in the model. However, in the fixed connection, relative motion does not take place between the supporting legs and the brackets. In fact, they are already integrated. Constraints between them are analyzed through direct integral adhesion between supporting legs and brackets, as shown in Fig. 1(a).
Fig. 1Geometric model and finite element model of the seed-metering device
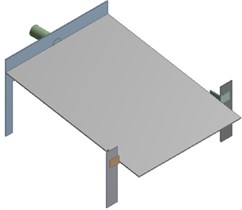
a) Geometric model
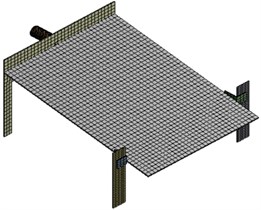
b) Finite element model
During dividing meshes of a model, impacts of mesh quality on the computational accuracy and time should be considered. Meshes with a high quality would have a high accuracy for computational results and shorter computation time. Meshes with poor quality would stop the computation. After meshes are finished, amounts of elements and nodes should be checked, as well. Too many elements which are more than the computational scope of a computer will affect the finite element analysis. Too many elements may be caused by that the geometric model which has sharp corners, round corners, mutations and other problems. At these positions, meshes will be very dense, so the number of elements increased. The minimum size of elements is 5 mm. In order to achieve mesh division conveniently, the paper adopts free division method. The final finite element model has 10289 elements and 14987 nodes, as shown in Fig. 1(b). A rigid region is established on the bottom of supporting legs, and master-slave nodes are set. Element nodes at the bottom center of supporting legs are taken as master nodes. Element nodes on the outer surface of supporting legs are taken as slave nodes. The established rigid region is used to command the connection of master-slave nodes. A rigid region is established at the installation position of vibrator.
The center point of vibrator is taken as the master node; nodes at joints between vibration plate and vibrator are taken as slave nodes which are connected to master-slave nodes. Rigid regions are established to ensure that constraint and vibration force can be transferred to the vibration plate through the master nodes. In order to reflect vibration situations of the vibration plate actually, spring elements are disposed on the bottom of supporting legs, and master nodes disposed at the bottom center of supporting legs are taken as end nodes of the spring elements. Structures of the seed-metering device are made of Q235. Parameters of the finite element analysis are set as follows: elasticity modulus is 2.06e11Pa, density is 7850 kg/m3 and Poisson’s ratio is 0.3.
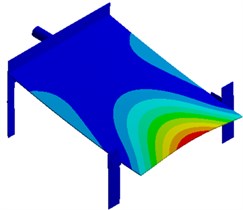
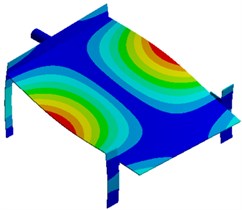
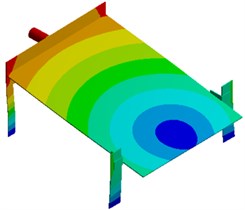
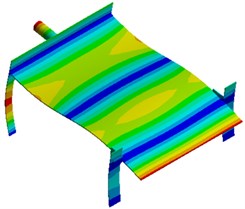
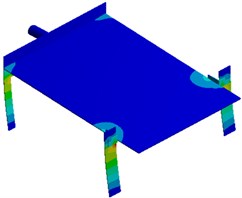
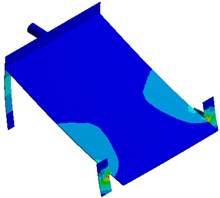
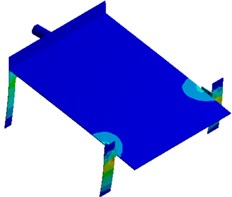
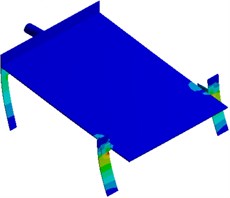
Modal analysis is used to compute vibration characteristics of structures, namely natural frequencies, modes and mode participation coefficient. Modes are a natural characteristic of a structure. Mode information is an important parameter to be used for structural design and improvement. Meanwhile, responses of the structure under different working conditions are decided by vibration characteristics, so it is necessary to conduct mode analysis and obtain its information on each order of the structure before the dynamic analysis is conducted. Seed-metering devices conduct an ordered array of rice seeds using large vibration amplitudes and forces generated during structural resonance. Therefore, its working point is inevitably located around the resonance frequency of a low order (first order in general). Fig. 2 shows modes on top 6 orders of the seed-metering device, where the first-order frequency is 6.25 Hz. It is shown in the figure that the first-order mode is mainly reflected by horizontal reciprocating motion of the vibration plate caused by bending vibration of supporting legs. In this way, motion of seeds can be motivated. It is a working vibration mode of the seed-metering device. The second-order mode is reflected by second-order bending vibration of supporting legs and the vertical vibration of vibration plate. Most serious vibration is mainly distributed at the center of vibration plate. Modes of other orders are mainly reflected by local vertical vibration of the vibration plate and bending vibration of supporting legs.
Fig. 2Modes on top 6 orders of the seed-metering device
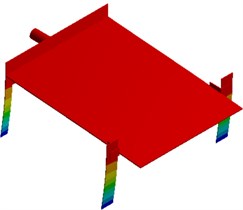
a) First order
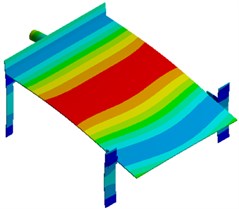
b) Second order
c) Third order
d) Fourth order
e) Fifth order
f) Sixth order
3. Numerical computation for the vibration of the seed-metering device
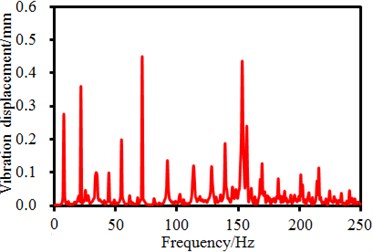
In order to observe vibration characteristics of the seed-metering device, many observation points are arranged on the seed-metering device, as shown in Fig. 3. In the system, a pneumatic vibrator is taken as the excitation source. Excitation forces are directly applied on the master node Point 5 which is located at the center of the vibrator. The vibration plate generated cyclic reciprocating motion using the supporting legs. The excitation force is obtained through experimental test, as shown in Fig. 4. It is shown in Fig. 4(a) that the excitation force has an obvious periodicity, where the amplitude of the time-domain excitation force is 1.85 mm. Frequency-domain results can be obtained through FFT, as shown in Fig. 4(b). It is shown in Fig. 4(b) that many obvious peak values are in the frequency-domain results, where the maximum peak value is 0.56 mm, and the corresponding frequency is 82 Hz. The interval of peak values is 50 Hz because the time-domain results have an obvious periodicity.
Fig. 3Arrangement positions of observation points of the seed-metering device
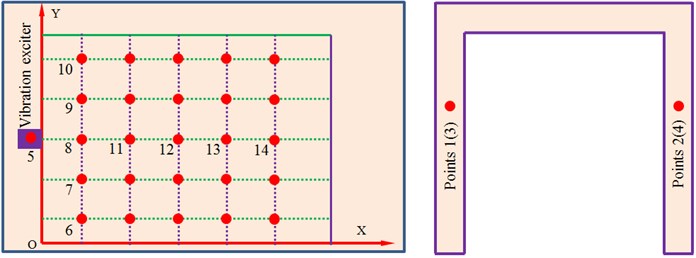
Fig. 4Time-frequency-domain results of excitation forces of the seed-metering device
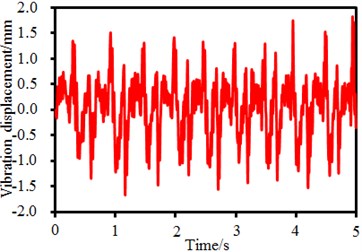
a) Time-domain results
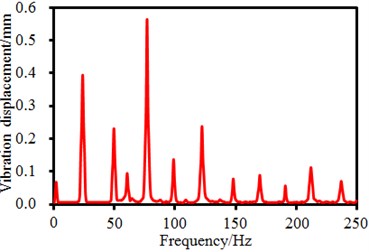
b) Frequency-domain results
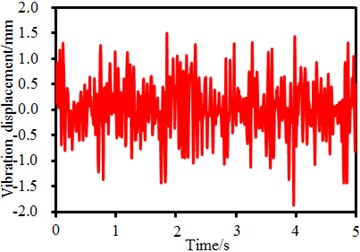
It is shown in Fig. 1 that the seed-metering device has 4 supporting legs. Time-frequency domain vibration displacements of observation points on the supporting legs are extracted, as shown in Fig. 5. It is shown in the figure that time-domain vibration displacements of supporting legs fluctuate around 0. Maximum time-domain vibration displacements of observation points 1, 2, 3 and 4 are 1. 5mm, 1.8 mm, 2.2 mm and 1.6 mm, respectively. Corresponding frequency-domain results are obtained through FFT. It is found in the frequency-domain results that the vibration displacements have peaks around 6.25 Hz, which are caused by fundamental frequency of the seed-metering device. In addition, obvious peaks are around 25 Hz, 50 Hz, 82 Hz, 150 Hz and so forth as the excitation source in Fig. 4 has obvious peak values at these frequencies. In addition, some extra peak values are also in the frequency-domain results, which are caused by structural resonance of the seed-metering device. Obviously, frequency-domain displacement peaks at supporting legs of the seed-metering device are mainly caused by overlaying of natural frequencies of the excitation source and the structure.
4. Experimental test and numerical analysis on the vibration of the seed-metering device
Structural parameters of the seed-metering device will cause obvious impacts on the vibration performance. Therefore, each vibration parameter is studied based on the numerical computation model. As shown in Fig. 3, many observation points in and directions are arranged on the vibration plate. Vibration displacement amplitudes of many observation points are extracted to study each parameter of the seed-metering device.
Fig. 5Time-frequency domain displacements at supporting legs of the seed-metering device
a) Time-domain results (Point 1)
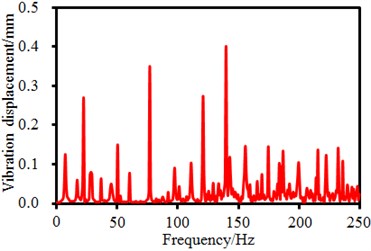
b) Frequency-domain results (Points 1)
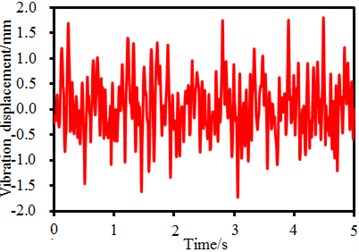
c) Time-domain results (Point 2)
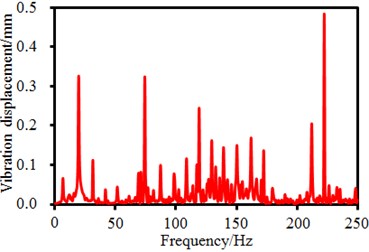
d) Frequency-domain results (Points 2)
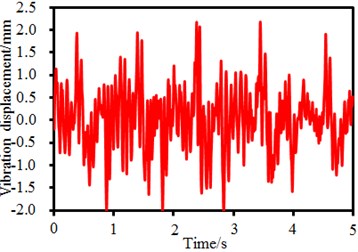
e) Time-domain results (Point 3)
f) Frequency-domain results (Points 3)
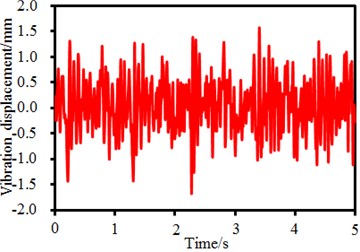
g) Time-domain results (Point 4)
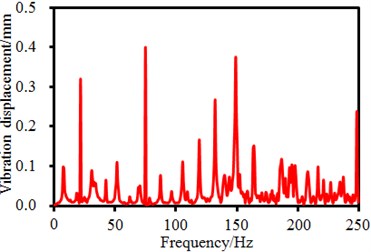
h) Frequency-domain results (Points 4)
4.1. Experimental verification of the vibration of the seed-metering device
Vibration displacement amplitudes of observation points 8, 11, 12, 13 and 14 in in -direction as well as observation points 6, 7, 8, 9 and 10 in -direction in Fig. 3 are extracted. Results are shown in Fig. 6. It is shown in Fig. 6(a) that in direction of the vibration plate, the vibration is stronger when the observation point is farther from the excitation source. The phenomenon is caused by that shaking of supporting legs far from the excitation source could easily cause problems such as distortion and resonance, leading to serious vibration. It is shown in Fig. 6(b) that the vibration in direction presents an approximate symmetric distribution with the excitation source as the center. The vibration far from the excitation source is serious gradually, and the weakest vibration is at the position directly facing the excitation source. The phenomenon is caused by constraints of supporting legs and lateral baffles along two ends of the vibration plate in -direction. Therefore, the vibration plate gets deformed, but the strength is much weaker compared with the tail end in -direction.
Fig. 6Vibration amplitudes of the seed-metering device in X and Y-direction
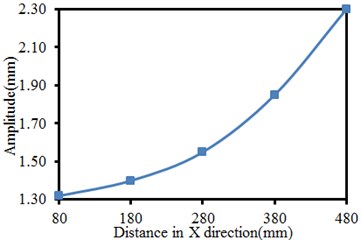
a) Vibration amplitudes in -direction
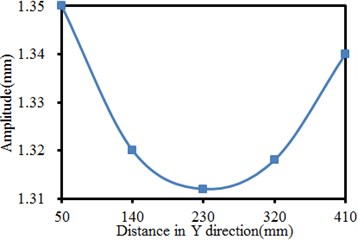
b) Vibration amplitudes in -direction
Numerical simulation of the vibration performance of the seed-metering device is seriously affected by excitation source and boundary conditions. Therefore, correctness of the model must be verified by experimental test. Multi-point test is used to test the normal displacement of the vibration plate, so the normal displacement distribution of the complete plate under the comprehensive frequency is obtained. The experimental result is compared with vibration characteristics in the numerical computation results. The complete test system is composed of sensors, data lines, data collectors, signal amplifiers and computers, as shown in Fig. 7. The adopted sensor is advantageous in small size, steady work, high accuracy, etc. Equipment produced by B&K Company is used as the data collector. Throughout the experimental test, the sensor is used to collect normal displacement signals of the vibration plate. Signals are input into an analyzer for analyzing and computing. Then, time-domain signals or frequency-domain signals are output by software in the computer. In the time-domain signals, the peak value of output waveforms is the amplitude size of each waveband. In the experimental test, the selection of each structural parameter of the seed-metering device is consistent with the numerical simulation, where the inclination of the vibration plate is 10°. Experimental results of points 6, 7, 8, 9 and 10 in the figure are selected to reflect -direction vibration distribution of the vibration plate. In a similar way, experimental results of points 8, 11, 12, 13 and 14 which reflect -direction vibration distribution of the vibration plate are also tested.
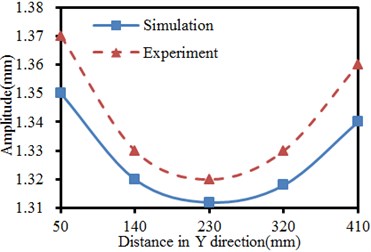
Comparison results between numerical simulation and experimental test are shown in Fig. 8. It is found in the figure that variation tendencies of the vibration displacements are completely consistent in and directions. The maximum difference of vibration displacements in -direction is 5.1 %. The maximum difference of vibration displacements in -direction is 1.5 %. Obviously, the numerical simulation has a high accuracy and can replace the experimental test. Result errors between numerical simulation and experimental test are mainly caused by following reasons: models established in finite element simulation are different from actual structures to a certain extent. During the experimental test, actual structures of the seed-metering device are affected and interfered by many factors. Natural and human operation errors are in the testing system and will affect the experimental results.
Fig. 7Experimental test of the vibration performance of the seed-metering device
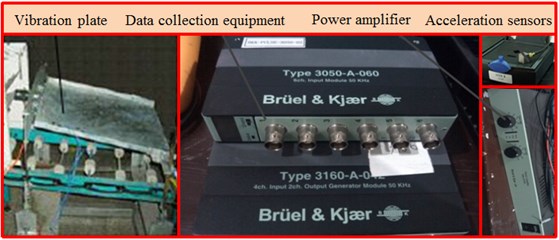
Fig. 8Vibration amplitudes of the seed-metering device in X and Y-direction
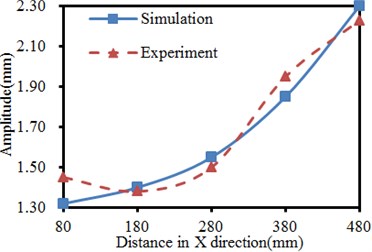
a) Vibration amplitudes in -direction
b) Vibration amplitudes in -direction
4.2. Impacts of the plate thickness on the vibration of the seed-metering device
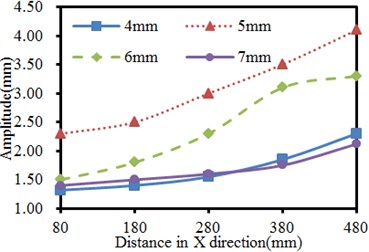
Based on the verified computation model, the thickness of the vibration plate is changed within 4 mm-7 mm, and the step length is 1 mm. The vibration of the seed-metering device under 4 working conditions is computed. Results are shown in Fig. 9. It is shown in Fig. 9(a) that in direction of the vibration plate, the vibration is stronger when the observation point is farther from the excitation source in the same thickness. The phenomenon is caused by that shaking of supporting legs far from the excitation source could easily cause problems including distortion and resonance, leading to serious vibration. It is shown in Fig. 9(b) that the vibration in direction presents an approximate symmetric distribution with the excitation source as the center, where vibration far from the excitation source is serious gradually. The weakest vibration is at the position directly facing the excitation source in the same thickness. The phenomenon is caused by constraints of supporting legs and lateral baffles along two ends of the vibration plate in -direction, so the vibration plate gets deformed, but the strength is much weaker compared with the tail end in -direction. In addition, under the working condition with the same distance, the vibration amplitudes in and directions do not decrease gradually with the increased plate thickness. When the plate thickness is 5 mm, the vibration amplitude reaches the maximum value. When the plate thicknesses are 4 mm and 7 mm, the vibration displacements of the seed-metering device are similar. When the vibration displacement is 6 mm, the vibration amplitude has an obvious valley value at the excitation source position in -direction.
4.3. Impacts of inclination angles of the plate on the vibration of the seed-metering device
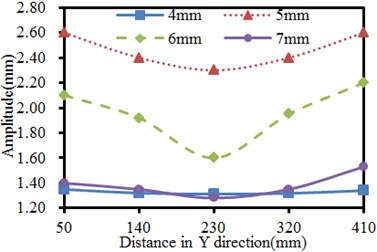
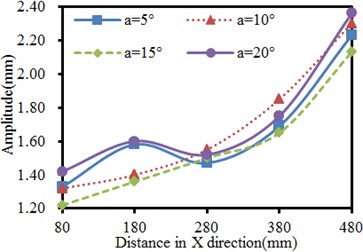
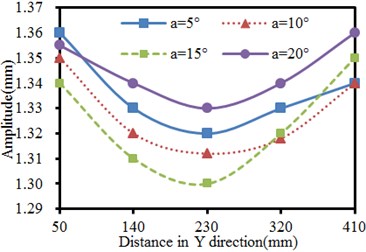
The inclination angle of the plate is changed within 5°–20°, and the step length is 5°. The vibration of the seed-metering device under 4 working conditions is computed. Results are shown in Fig. 10. It is shown in Fig. 10(a) that in direction of the vibration plate, the vibration is stronger when the observation point is farther from the excitation source in the same inclination. The phenomenon is caused by that shaking of supporting legs far from the excitation source could easily cause problems including distortion and resonance, leading to serious vibration. It is shown in Fig. 10(b) that the vibration in direction presents an approximate symmetric distribution with the excitation source as the center, where the vibration far from the excitation source is serious gradually. The weakest vibration is at the position directly facing the excitation source in the same inclination. The phenomenon is caused by constraints of supporting legs and lateral baffles along two ends of the vibration plate in -direction, so the vibration plate gets deformed, but the strength is much weaker compared with the tail end in -direction. In addition, under the working condition with the same distance, the vibration amplitudes do not decrease gradually with the increased inclination angles in and -direction. When the inclination angle is 5° and 20°, the vibration values of the seed-metering device are similar in -direction. When the inclination angle is 20°, the vibration amplitude reaches the maximum value in -direction.
Fig. 9Vibration amplitudes of the seed-metering device in X and Y-direction
a) Vibration amplitudes in -direction
b) Vibration amplitudes in -direction
Fig. 10Vibration amplitudes of the seed-metering device in X and Y-direction
a) Vibration amplitudes in -direction
b) Vibration amplitudes in -direction
4.4. Impacts of excitation source position on the vibration of the seed-metering device
The excitation source position is changed within 300 mm-600 mm, and the step length is 100 mm. The vibration of the seed-metering device under 4 working conditions is computed. Results are shown in Fig. 11. It is shown in Fig. 11(a) that in direction of the vibration plate, the vibration is stronger when the observation point is farther from the excitation source in the same position. The phenomenon is caused by that shaking of supporting legs far from the excitation source could easily cause problems such as distortion and resonance, leading to serious vibration. It is shown in Fig. 11(b) that the vibration in direction presents an approximate symmetric distribution with the excitation source as the center, where the vibration far from the excitation source is serious gradually. The weakest vibration is at the position directly facing the excitation source in the same excitation source position. The phenomenon is caused by constraints of supporting legs and lateral baffles along two ends of the vibration plate in -direction, so the vibration plate gets deformed, but the strength is much weaker compared with the tail end in -direction. In addition, under the working condition of the same distance, the vibration amplitudes gradually increased with the increased excitation source position in and -direction.
Fig. 11Vibration amplitudes of the seed-metering device in X and Y-direction
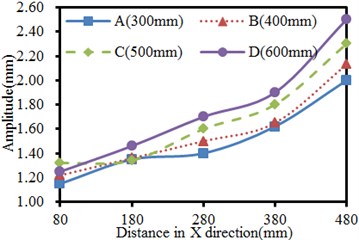
a) Vibration amplitudes in -direction
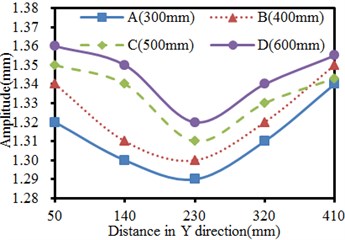
b) Vibration amplitudes in -direction
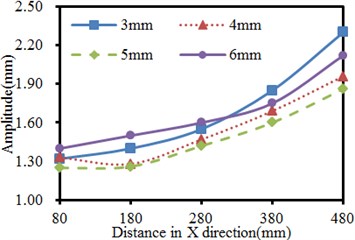
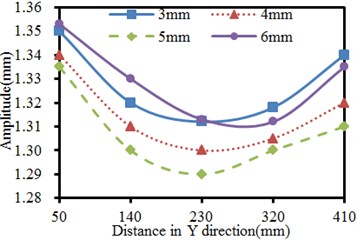
4.5. Impacts of thickness of supporting legs on the vibration of the seed-metering device
Thickness of supporting legs is changed within 3 mm-6 mm, and the step length is 1 mm. The vibration of the seed-metering device under 4 working conditions is computed. Results are shown in Fig. 12. It is shown in Fig. 12(a) that in direction of the vibration plate, the vibration is stronger when the observation point is farther from the excitation source in the same thickness of supporting legs. The phenomenon is caused by that shaking of supporting legs far from the excitation source could easily cause problems including distortion and resonance, leading to serious vibration. It is shown in Fig. 12(b) that the vibration in direction presents an approximate symmetric distribution with the excitation source as the center, where the vibration far from the excitation source is serious gradually. The weakest vibration is at the position directly facing the excitation source in the same thickness of supporting legs.
The phenomenon is caused by constraints of supporting legs and lateral baffles along two ends of the vibration plate in -direction, so the vibration plate gets deformed, but the strength is much weaker compared with the tail end in -direction. In addition, under the working condition with the same distance, the vibration amplitude of the seed-metering device does not decrease with the increased supporting leg thickness. When the supporting leg thickness is 6 mm, the valley positions of the vibration curve are different from other working conditions in -direction.
Fig. 12Vibration amplitudes of the seed-metering device in X and Y-direction
a) Vibration amplitudes in -direction
b) Vibration amplitudes in -direction
4.6. Strains of the seed-metering device under different parameters
Strains with different parameters including the plate thickness, inclination angle, excitation source position and supporting leg thickness are extracted respectively, as shown in Fig. 13. It is shown in the figure that the strain of supporting legs with different parameters is obviously different. The strain also presents obvious differences at connecting positions of each component of the seed-metering device. Therefore, parameters including the plate thickness, inclination angle, excitation source position and supporting leg thickness cause serious impacts on the vibration of the seed-metering device, which will further affect the sowing performance of the seed-metering device.
Fig. 13Strains of the seed-metering device with different parameters
a) Vibration plate thickness
b) Inclination angle
c) Excitation source position
d) Supporting leg thickness
5. Multi-objective optimization for the vibration of the seed-metering device
For most machines and structures, the vibration is a passive and harmful phenomenon which will reduce the machine accuracy, increase additional dynamic stress in structures and seriously shorten the service life of structures. However, the vibration is beneficial under some cases and can be applied. In the paper, the vibration is used for ordered sowing. When the vibration is small, the population motion has a small motion speed and poor liquidity, and the repeated suction rate of seed suction holes is relatively high. When the vibration is very serious, the population motion speed is large, and seed suction of the seed suction holes is difficult. Additionally, the suction missing rate is relatively high. Proper vibrations can relatively reduce the suction missing rate and repeated suction rate of the seed suction holes. Therefore, it is necessary to optimize the vibration of the plate of the seed-metering device in and direction, which is a multi-objective optimization problem. In the multi-objective optimization, multiple objectives are mutually restrained and highly non-linear, so it is nearly impossible to obtain optimal solutions for all the objectives. Therefore, these parameters must be optimized at the same time, so the multi-objective optimization of the vibration can be achieved. In other words, an optimization method must be applied to select system parameters of the seed-metering device rationally to improve the vibration performance.
Analysis in Section 4 shows that the plate thickness, inclination angle, excitation source position and supporting leg thickness of the seed-metering device have serious impacts on the vibration. Therefore, these parameters are taken as design variables. Optimization of the vibration of the seed-metering device in and direction is taken as the objective, and set as . During optimization, it must be ensured that the first-order vibration frequency of the seed-metering device will not be increased because the increased frequency will affect working performance. Therefore, the constraint function is that the first-order frequency is less than 6.25 Hz, namely Hz. Its mathematical model is as follows:
where: is the spatial mean value of the vibration displacement of the seed-metering device in -direction; is the spatial mean value of the vibration displacement of the seed-metering device in -direction. is the first-order frequency of the seed-metering device. is the design variable; is the lower limit of design variables; is the upper limit of design variables. Related parameter values are shown in Table 1.
Table 1Upper and lower limits of optimization design variables of the seed-metering device
Parameters | Original values | Upper limit | Lower limit |
Vibration plate thickness | 4 mm | 7.0 mm | 2.5 mm |
Thickness of supporting leg 1 | 3 mm | 6.0 mm | 1.5 mm |
Thickness of supporting leg 2 | 3 mm | 6.0 mm | 1.5 mm |
Thickness of supporting leg 3 | 3 mm | 6.0 mm | 1.5 mm |
Thickness of supporting leg 4 | 3 mm | 6.0 mm | 1.5 mm |
Vibration plate inclination | 10° | 5° | 20° |
Excitation source position | 400 mm | 300 mm | 600 mm |
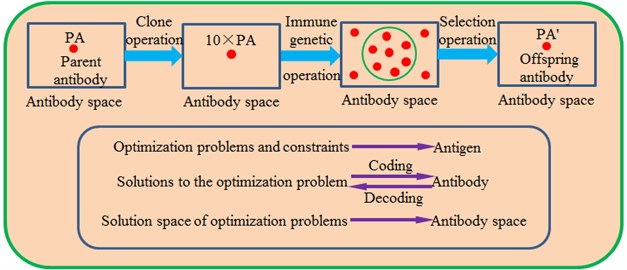
Immune optimization algorithms are an intelligent method which is used to solve optimization problems based on simulation of mechanisms such as immune recognition, immune response and immune memory of a biological immunity system. If an optimization problem and its constraint are deemed as antigens and candidate solutions of the target problem are deemed as antibodies. The immune recognition and immune response processes of the biological immune system can be associated with the search of optimization problem solution space based on the immune optimization algorithm. Fig. 14 describes the search of the optimization solution space based on an immune optimization algorithm. It is shown in the figure that iterations of the immune optimization algorithm mainly include 3 steps: clone operation, immune genetic operation and selection operation.
Fig. 14Topological structures of the traditional immune algorithm
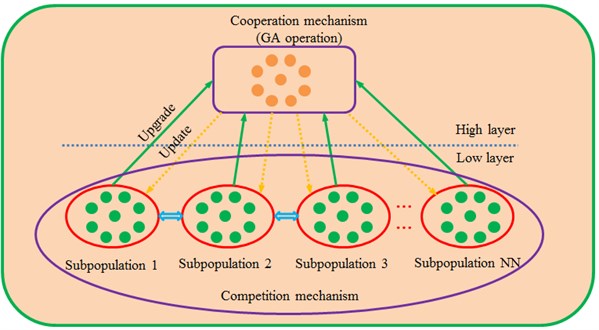
In addition, the traditional immune algorithm has some serious defects, namely it can easily fall into the balanced status of local optimization and the search will be terminated at the later stage of evolution. As a result, final search results of the algorithm are often the local optimal solutions rather than the global optimal solutions. In order to improve the immune algorithm and avoid premature convergence, the paper proposes a novel multi-layer immune algorithm based on genetic algorithms (ML-IGA). The model is divided into an upper layer and a lower layer. The antibody sub-population on the lower layer and the antibody sub-population on the upper layer are organized in the form shown in Fig. 15. There are sub-populations in the lower-layer antibody, and each sub-population has antibodies. A population is divided into multiple sub-populations, so diversity of individuals in the population can be maintained effectively, and defects including premature convergence and high sensitivity to problem scale can be avoided effectively. Through using the competition-type co-evolution, the convergence speed and convergence accuracy of each lower-layer subpopulation can be increased effectively. Through upgrade, lower-layer sub-populations are upgraded to the higher layer in order to constitute a higher-layer antibody sub-population. A parallel genetic algorithm based on collaborative cooperation is used for operations on the higher layer. The information communication and cooperation are achieved through the individual migration. Through the updating, sub-populations are updated to corresponding lower-layer sub-populations.
Fig. 15Topological structures of the proposed ML-IGA algorithm
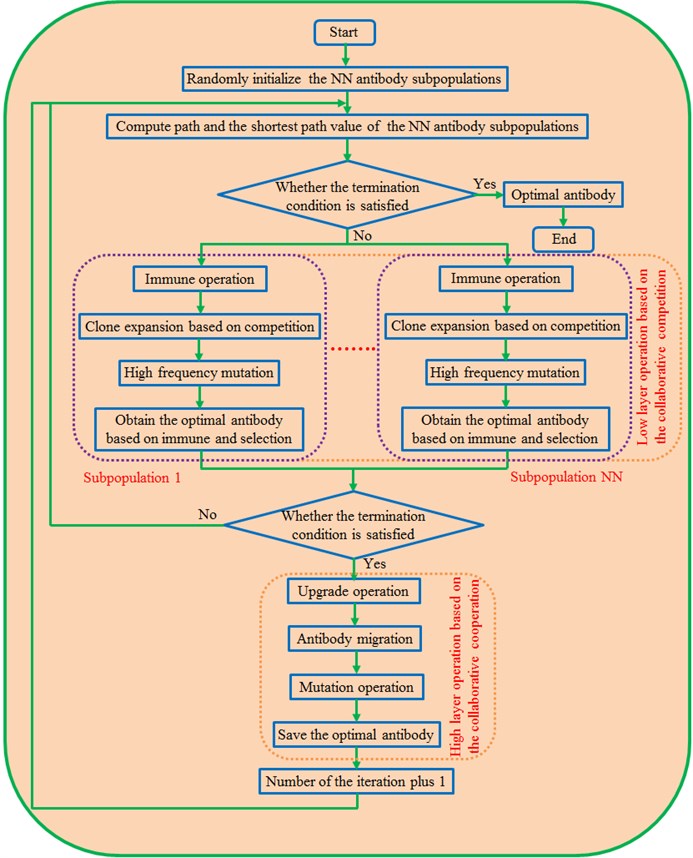
ML-IGA algorithm applies concepts including immunity, genetics and collaborative evolution to combined optimization. Its processes are shown in Fig. 16. Firstly, the optimization model, population scale, antibody number and iteration times, crossover probability, mutation probability and so forth are initialized. Next, path length values corresponding to each antibody in the subpopulation are computed. Therefore, the shortest path value of the subpopulation is obtained. In the ML-IGA algorithm, lower-layer operations based on immune clone selection and higher-layer operations based on genetic algorithm are taken as a series-connection hybrid form. An embedded hybrid form is used for lower-layer and higher-layer operations. Collaborate competition mechanism is embedded into the immune-clone-selection algorithm in the lower-layer operations. The collaborative cooperation mechanism is embedded into genetic algorithm in the higher-layer operations.
With continuous development of some software, good interfaces have been established between different software. Therefore, the commercial software can be integrated into MATLAB for co-simulation. Product models can be modified through modifying design parameters. In this way, simulation software can be operated automatically, and geometric model parameters can be modified automatically. During optimization using the MATLAB software, the ML-IGA optimization algorithm is implanted through secondary development. MATLAB software will modify input parameters of all the integrated software, call solution software to solve them, read the response results and finally judge whether the response results are optimal. The optimization will be ended if the optimal solution is obtained. Otherwise, the parameters will be modified and responses will be solved and read again. The process is repeated till the ideal objective function value is obtained.
Fig. 16Optimization processes of the proposed ML-IGA method
In order to further verify validity of the ML-IGA model for optimizing the vibration of the seed-metering device, it is compared with the traditional GA model and PSO-GA model. Predicted errors of three kinds of optimization algorithms are shown in Fig. 17. In order to ensure rigor of analysis, three kinds of algorithms adopt populations with the same scale, while a set critical error or iteration number is set as the termination condition. In the optimization, 0.01 is set as the critical error, and the maximum iteration number is 600. It is shown in Fig. 17 that errors of GA model, PSO-GA model and ML-IGA model are 0.145, 0.092 and 0.043 respectively when the iteration is conducted to 81th generation, where all the errors are more than the set critical error 0.01. At this moment, the optimization iteration still proceeded. When the iteration is conducted to the 156th generation, the error of the ML-IGA model is 0.0098 and smaller than the set critical value 0.01, and the optimization iteration is convergent. At this moment, errors of the GA model and PSO-GA model are 0.125 and 0.065 respectively, far more than the critical error. Therefore, the optimization iteration will keep on proceeding. When the iteration of PSO-GA model is continued to the 315th generation, the error is 0.0099, smaller than the set critical value 0.01. Therefore, the optimization iteration is convergent. However, at this moment, the iteration error of GA model is 0.085, still more than the set critical error. In addition, the GA model falls into local extremes when the iteration is conducted to 138th-265th generation and jumps out from the local extremes after a long time. When the iteration is conducted to the 600th generation, iteration of the GA model is ended, and the error is 0.018 at this moment. The value is still more than the set critical error. When the iteration of the ML-IGA model is conducted to the 156th generation, the predicted error is smaller than the set critical error. Compared with other two kinds of algorithms, the optimization accuracy is increased and the time is reduced. Finally, original vibration amplitudes in and directions are 1.684 mm and 1.328 mm, respectively. Regarding optimization of the GA model, the vibration amplitudes in and direction are 1.726 mm and 1.384 mm respectively. Obviously, the vibration amplitudes are increased by 2.49 % and 4.22 % respectively. Regarding optimization of the PSO-GA model, the vibration amplitudes in and direction are 1.848 mm and 1.408 mm respectively. Obviously, the vibration amplitudes are increased by 9.74% and 6.024 % respectively. Regarding optimization of the ML-IGA model, the vibration amplitudes in and direction are 1.976 mm and 1.418 mm respectively. Obviously, the vibration amplitudes are increased by 17.34 % and 6.78 % respectively. Optimized structure parameters and results are shown in Table 2. Obviously, structures with better performance can be obtained through using the proposed ML-IGA model.
Fig. 17Iteration processes of three kinds of optimization algorithms
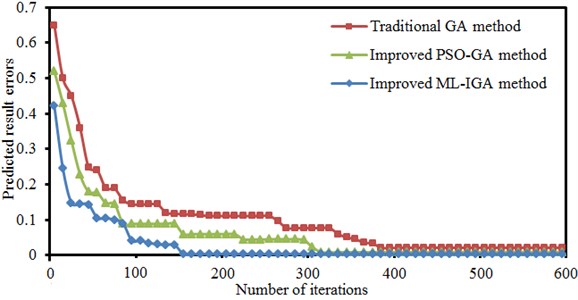
Table 2Related results of the seed-metering device before and after optimization
Parameters | Original values | Optimized values |
Vibration plate thickness | 4 mm | 7.0 mm |
Thickness of supporting leg 1 | 3 mm | 6.0 mm |
Thickness of supporting leg 2 | 3 mm | 6.0 mm |
Thickness of supporting leg 3 | 3 mm | 6.0 mm |
Thickness of supporting leg 4 | 3 mm | 6.0 mm |
Vibration plate inclination | 10° | 5° |
Excitation source position | 400 mm | 300 mm |
Vibration amplitude in direction | 1.684 mm | 1.976 mm |
Vibration amplitude in direction | 1.328 mm | 1.425 mm |
First-order vibration frequency | 6.25 Hz | 6.18 Hz |
6. Conclusions
In order to improve the immune algorithm and avoid premature convergence, the paper proposes a novel multi-layer immune algorithm based on genetic algorithms (ML-IGA). The model is divided into an upper layer and a lower layer. The antibody sub-population on the lower layer and the antibody sub-population on the upper layer are organized. A population is divided into multiple sub-populations, so diversity of individuals in the population can be maintained effectively. The search characteristics of the traditional genetic algorithm are maintained. Finally, the proposed ML-IGA method is applied to a multi-objective optimization for the vibration of seed-metering devices. The structure with optimal performance is obtained.
1) The working point of the seed-metering device is inevitably located around the resonance frequency of the low order, where the first-order frequency was 6.25 Hz. The first-order mode is mainly reflected by horizontal reciprocating motion of the vibration plate caused by bending vibration of supporting legs. In this way, motion of seeds can be motivated. It is a working vibration mode of the seed-metering device. The second-order mode is reflected by the second-order bending vibration of supporting legs and the vertical vibration of the vibration plate. Most serious vibration is mainly distributed at the center of the vibration plate. Modes of other orders are mainly reflected by local vertical vibration of the vibration plate and bending vibration of supporting legs.
2) Frequency-domain results have an obvious peak around 6.25 Hz, which is caused by fundamental frequency of the seed-metering device. In addition, obvious peaks are around 25 Hz, 50 Hz, 82 Hz and 150 Hz as the excitation source has obvious peaks at these frequencies. In addition, some extra peaks are also in the frequency-domain results, which are caused by structural resonance of the seed-metering device. Obviously, frequency-domain displacement peaks at supporting legs of the seed-metering device are mainly caused by overlaying of natural frequencies of the excitation source and the structure.
3) Variation tendencies of the vibration displacements are completely consistent in and directions. The maximum difference of vibration displacements in -direction is 5.1 %, and the maximum difference of vibration displacements in -direction is 1.5 %. Obviously, the numerical simulation has a high accuracy and can replace the experimental test.
4) Regarding parameters including the plate thickness, inclination angle, excitation source position and supporting leg thickness, in the same condition, the vibration in direction is stronger when the observation point is farther from the excitation source. It is caused by that shaking of supporting legs far from the excitation source could easily cause problems including distortion and resonance, leading to serious vibration. The vibration in direction presents an approximate symmetric distribution with the excitation source as the center. The vibration far from the excitation source is serious gradually, and the weakest vibration is at the position directly facing the excitation source. The phenomenon is caused by constraints of supporting legs and lateral baffles along two ends of the plate in -direction. Therefore, the plate gets deformed, but the strength is much weaker compared with the tail end in -direction. Parameters including the plate thickness, inclination angle, excitation source position and supporting leg thickness have serious impacts on the vibration of the seed-metering device.
5) In order to further verify validity of the novel ML-IGA model for optimizing the vibration performance of the seed-metering device, it is compared with the traditional GA model and PSO-GA model. In order to ensure rigor of analysis, three kinds of algorithms adopt populations with the same scale. A set critical error or iteration number is set as the termination condition. When the iteration of the ML-IGA model is conducted to the 156th generation, the predicted error is smaller than the set critical error. Compared with other two kinds of algorithms, the optimized time is reduced. Regarding optimization of the GA model, the vibration amplitudes are increased by 2.49 % and 4.22 % respectively. Regarding optimization of the PSO-GA model, the vibration amplitudes are increased by 9.74 % and 6.024 % respectively. Regarding optimization of the ML-IGA model, the vibration amplitudes are increased by 17.34 % and 6.78 % respectively. Obviously, structures with better performance can be obtained through using the novel ML-IGA model.
References
-
Anantachar M., Kumar P. G. V., Guruswamy T. Neural network prediction of performance parameters of an inclined plate seed metering device and its reverse mapping for the determination of optimum design and operational parameters. Computers and Electronics in Agriculture, Vol. 72, Issue 2, 2010, p. 87-98.
-
St Jack D., Hesterman D. C., Guzzomi A. L. Precision metering of santalum spicatum (Australian Sandalwood) seeds. Biosystems Engineering, Vol. 115, Issue 2, 2013, p. 171-183.
-
Zhan Z., Yafang W., Jianjun Y., et al. Monitoring method of rice seeds mass in vibrating tray for vacuum-panel precision seeder. Computers and Electronics in Agriculture, Vol. 114, 2015, p. 25-31.
-
Yazgi A., Degirmencioglu A. Measurement of seed spacing uniformity performance of a precision metering unit as function of the number of holes on vacuum plate. Measurement, Vol. 56, 2014, p. 128-135.
-
Anantachar M., Kumar G. V. P., Guruswamy T. Development of artificial neural network models for the performance prediction of an inclined plate seed metering device. Applied Soft Computing, Vol. 11, Issue 4, 2011, p. 3753-3763.
-
Chen J., Li Y. M. Study on seeds movement law in sowing test with suction and vibration. Transactions of the Chinese Society for Agricultural Machinery, Vol. 33, Issue 1, 2002, p. 47-50.
-
Zhao L. X., Zheng Y. L., Liu Z. M., et al. Seed vibration performance of vibrational air-sucking seeder with air-style vibrator. Transactions of the Chinese Society for Agricultural Machinery, Vol. 21, Issue 7, 2005, p. 65-68.
-
Sun W., Wang G. P., Wu J. M. Design and experiment on loss sowing testing and compensation system of spoon-chain potato metering device. Transactions of the Chinese Society for Agricultural Machinery, Vol. 32, Issue 11, 2016, p. 8-15.
-
Song J. L., Yang Z. D., Yang S. D., et al. A seed metering device of variable hole depth. Journal of Agricultural Mechanization Research, Vol. 32, Issue 12, 2010, p. 103-105.
-
Liao Q. X., Zhang P. L., Liao Y. T., et al. Numerical simulation on seeding performance of centrifugal rape-seed metering device based on EDEM. Transactions of the Chinese Society for Agricultural Machinery, Vol. 45, Issue 2, 2014, p. 109-114.
-
Zhang T., Liu F., Zhao M. Q., Liu Y. Q., Li F. L., et al. Movement law of maize population in seed room of seed metering device based on discrete element method. Transactions of the Chinese Society for Agricultural Machinery, Vol. 32, Issue 22, 2016, p. 27-35.
-
Chen C. C., Zhou H. B., Ma X., Zhou L., Zhai T. T. Simulation and analysis of seeding speed for vibrating precision seed meter. Journal of Jiamusi University (Natural Science Edition), Vol. 32, Issue 3, 2014, p. 408-412.
-
Hu J. P., Guo K., Zhou C. J., Hou C. Simulation and experiment of supplying seeds in box of magnetic precision cylinder-seeder. Transactions of the Chinese Society for Agricultural Machinery, Vol. 45, Issue 8, 2014, p. 61-65.
-
Yu Y. X., Li J. M., Shao X. B., Zhao Y. The modal analysis and experimental study on vibration seed-metering device. Journal of Zhejiang Sci-Tech University, Vol. 28, Issue 1, 2011, p. 69-72.
-
Yu Y. X., Zhang X., Wu F., Liu L. Analysis and test of transverse vibration of vibrating plate of rice seed metering device. Journal of Zhejiang Sci-Tech University, Vol. 33, Issue 1, 2015, p. 78-82.
-
Liu C. L., Song J. N. Influence of seed tray vibration on work performance of suction-vibration type precision seed device. Journal of China Agricultural University, Vol. 9, Issue 2, 2004, p. 12-14.
-
An X., Wang S., Duan H., et al. Test on Effect of the operating speed of maize-soybean interplanting seeders on performance of seeder-metering devices. Procedia Engineering, Vol. 174, 2017, p. 353-359.
-
Yu Y. X., Zhao Y., Zhang B., Li G. Seed metering device based on orienting ordered arrangement in embryo and parameter optimization. Journal of Jiangsu University (Natural Science Edition), Vol. 29, Issue 3, 2008, p. 194-197.
-
Yang R. B., Zhang X., Li J. D., Shang S. Q., Chai H. H. Parameter optimization and experiment on cone canvas belt type seed-metering device. Transactions of the Chinese Society for Agricultural Machinery, Vol. 32, Issue 3, 2016, p. 6-13.
-
El Ela A.-A.-A., Allam S. M., Shatla Maximal M. M. optimal benefits of distributed generation using genetic algorithms. Electric Power Systems Research, Vol. 80, Issue 7, 2010, p. 869-877.
-
Abd El Wahed W.-F., Mousa A. A., El Shorbagy M.-A. Integrating particle swarm optimization with genetic algorithms for solving nonlinear optimization problems. Journal of Computational and Applied Mathematics, Vol. 235, Issue 5, 2011, p. 1446-1453.
-
Korürek M., Doğan B. ECG beat classification using particle swarm optimization and radial basis function neural network. Expert systems with Applications, Vol. 37, Issue 12, 2010, p. 7563-7569.
-
Rashidi M. M., Ali M., Freidoonimehr N., et al. Parametric analysis and optimization of entropy generation in unsteady MHD flow over a stretching rotating disk using artificial neural network and particle swarm optimization algorithm. Energy, Vol. 55, 2013, p. 497-510.
-
Liu H., Tian H., Chen C., et al. An experimental investigation of two Wavelet-MLP hybrid frameworks for wind speed prediction using GA and PSO optimization. International Journal of Electrical Power and Energy Systems, Vol. 52, 2013, p. 161-173.
-
Wang P. C., Shoup T. E. A poly-hybrid PSO optimization method with intelligent parameter adjustment. Advances in Engineering Software, Vol. 42, Issue 8, 2011, p. 555-565.
-
Lau H. C. W., Chan T. M., Tsui W. T., et al. Application of genetic algorithms to solve the multidepot vehicle routing problem. IEEE Transactions on Automation Science and Engineering, Vol. 7, Issue 2, 2010, p. 383-392.
-
Hidalgo D., Melin P., Castillo O. An optimization method for designing type-2 fuzzy inference systems based on the footprint of uncertainty using genetic algorithms. Expert Systems with Applications, Vol. 39, Issue 4, 2012, p. 4590-4598.
-
Hasanien H. M., Muyeen S. M. Design optimization of controller parameters used in variable speed wind energy conversion system by genetic algorithms. IEEE Transactions on Sustainable Energy, Vol. 3, Issue 2, 2012, p. 200-208.
-
Hu Z. H. A container multimodal transportation scheduling approach based on immune affinity model for emergency relief. Expert Systems with Applications, Vol. 38, Issue 3, 2011, p. 2632-2639.
-
Mobini M., Mobini Z., Rabbani M. An Artificial Immune Algorithm for the project scheduling problem under resource constraints. Applied Soft Computing, Vol. 11, Issue 2, 2011, p. 1975-1982.
-
Li R., Mita A., Zhou J. Hybrid methodology for structural health monitoring based on immune algorithms and symbolic time series analysis. Journal of Intelligent Learning Systems and Applications, Vol. 5, Issue 1, 2013, p. 48-56.
Cited by
About this article

