Abstract
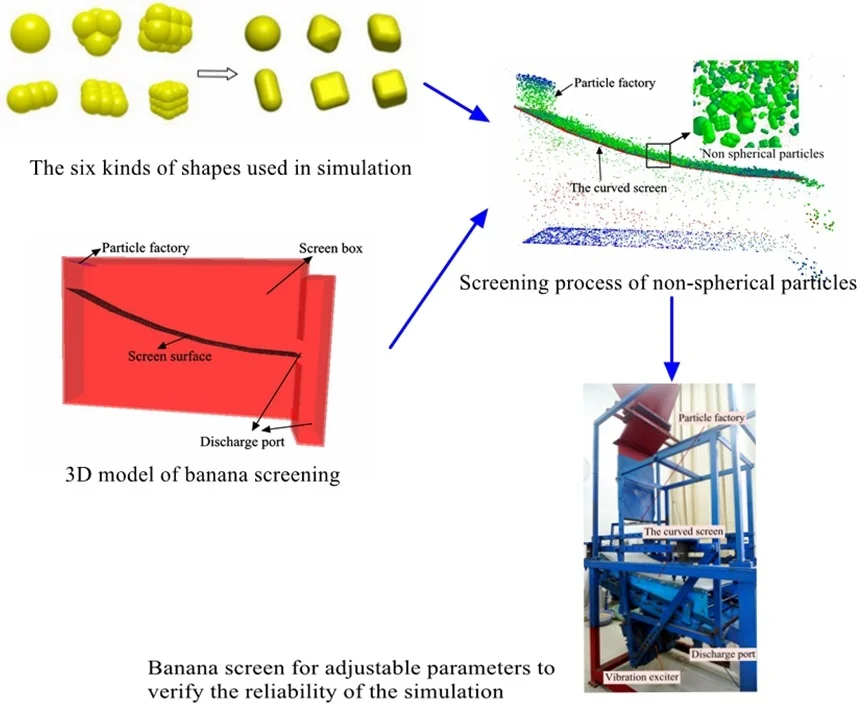
This paper carried out the numerical simulation about the movement of non-spherical particles on banana vibrating screen using direct element method (DEM) considering the complexity of particle collision and avoiding obtaining motion information with difficulty. Experimental prototype of banana vibrating screen under variable parameters was manufactured to verify the feasibility of simulations. Because the complex non-linear mathematical model is the basis of optimization. Based on the simulation data this paper applied the least squares support vector machines (LS-SVM) to establish relationships between vibrating parameters of banana screen and screening performance. LS-SVM based on statistical theory can effectively solve the mapping problem of small sample. At same time, in order to improving the quality of modeling, the kernel parameters of SVM were optimized by particle swarm optimization (PSO). Considering multi-extremum, large-scale, and non-differentiable of this computational model, the artificial fish-swarm algorithm (AFSA) with strong robustness and global convergence was applied to vibration parameters optimization. Finally, the optimal vibration parameters were: vibration amplitude 2.4 mm, vibration frequency 21 Hz, vibration direction angle 40 degrees.
Highlights
- DEM-solutions simulate the irregular particles movements in banana screen.
- Mathematical modeling of highly nonlinear screening process is performed using SVR.
- Non-differentiable and highly non-linear SVR modeling was optimized by AFSA.
1. Introduction
Sieving is a technique for separating particles of different sizes. It is widely used in many granular media industries such as the construction, mineral separation, medicine and food fields [1-3]. When small particles penetrate the plate under suitable vibration source, other particles run to outlet indicating that the screening process finished. As an important screen machine in industrial screening, banana screens which named by the curved screening plate have better performance and throughput. The curved plate can make the same material layer thickness. With large inclined angle in the feeding end, it is helpful for small particles rapid movement and layering to penetrate sieve mesh. Then with the small particles and the inclined angles gradually decreasing, the time of screening process gets longer, and the thickness of material keeps stable. That makes the lager particles have more opportunities to pass though screening aperture. The research on the design and mechanism of banana screen has gradually attracted the attention of scholars [4-6].
Due to the complex collisions between particle-particle and particle-machine, plenty of time from traditional screen experiment including the statistics of particles motion information and size, DEM has been proved to be an effective method for dealing with granular systems. In 2002, Cleary simulated the separation process of 8000 3D-spherical particles in vibrating screen with inclined plate using DEM [7]. In 2007, Jiao and Zhao studied the penetrate motion of particle with 2D Sieve-DEM developed by VC++.NET [8]. Based on DEM considering the collision property and simulation condition, Liu and Tong analysed the relationships between parameter and screening efficiency [9]. Recent years, on the basis of DEM on screening simulation, the research of banana screen has become a hot spot. K. J. Dong do the deeply investigate in the effect of the equal inclination angle on the sieving performance of three-plate banana screen by DEM [4] in 2009. In 2013, J.W. Fernandez used SPH-DEM to simulate the movement of moist particles over the plate of banana screen [10]. Liu presented the mathematical study of particle flow on a banana screen deck using DEM [11]. In 2017, Li studied the sieving process of banana screen with the inclinations improved by Fibonacci sequence based on DEM [11]. But due to the lack of the mapping between vibration parameters and screening performance, it is hard to optimize reasonable parameters without the valid mathematic model of banana screen.
Particle morphology is another important impact on the particle micromechanical behavior. Cleary [12] have carried out three-dimensional simulations about screening process of spherical particles and non-spherical particles. The results showed that screening rate of spherical particles is larger than that of non-spherical particles. Li explored a simple two-dimensional crop seed DEM model, and discussed their effects on screening efficiency, the physical mechanism of separation [3]. Spherical, conical, cylindrical particles respectively in different vibration parameters and structure parameters, transmission speed and screening rate were studied by Frederik and Elskamp [13]. In this paper, non-spherical particles which match sand’s sphericity and a banana vibrating screen with a curved sieving surface were established by using DEM modeling. In order to study the relationship between vibration parameters and screening performance, Brereton and Dymott based on particle penetrating probability theory of Gaudin established the mathematical model of two-layer thickness screening stage [14, 15]. Chen established a comprehensive screening model about vibration and structure parameters [16]. Li presented A novel application of non-linear regression modeling based on Support Vector Machines (SVMs) is used for mapping the sample space of operating parameters and vibrating screen configuration [17]. In this paper, Simulation data which can be verified by the adjustable parameters are used, and the optimization model of banana is established by using the optimized support vector machine. At last, the overall parameters of banana screen were optimized by intelligent optimization algorithm.
2. DEM-simulations of banana screen and conditions
2.1. The discrete element (DEM)
DEM is a means to study the mechanical behavior of granular media systems. A soft ball model considering the surface deformation of particles is used as the basis of contact theory. According to the calculation of the intergranular contact force between the normal and tangential displacement, calculation strength is small which is beneficial to engineering problem. Particles in the initial position (the inlet) with a certain initial velocity under the influence of gravity fell down screening surface. After that the collision occurred between particles.
Using the theory of contact mechanics and elastic mechanics to determine the force and the material displacement, the speeds and positions of all particles in banana screen are constantly updated along with time by applying Newton’s second law [18, 19]. When the particles movements of whole system stop, that is system balance, iteration process ends. All the particles in the working surface conform to Newton's second law. These equations are:
where is particle-I’ mass; is position vector; and are respectively Normal and tangential contact forces which are caused by intergranular collisions; and are respectively normal and tangential damping; is gravity; is rotational inertia; is the torque generated by rolling friction; is contact torque. After the time step , the new velocity and location of the granules are obtained:
where is the velocity of the particle; is the particle velocity of the previous step.
2.2. Simulations of particle’ shapes
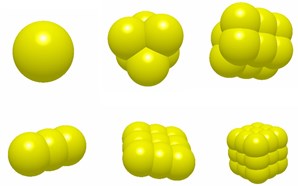
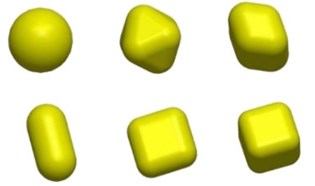
DEM has been successfully used in non-spherical shaped particles interactions and has provided useful qualitative information of particles [20-22] (Cleary, 2009; Zhu et al., 2008; Elskamp et al., 2015). Gabriel et al. (2013) conducted a multi-sphere pellet model of iron ore to perform DEM simulations in both the slipping and the mill tumbling, and the results showed a good agreement with experiments [23]. In 2006 Cho, G. C. [24] mentioned that the sphericity of the crushed sand is generally 0.7-0.8, and the sphericity of natural sand is generally 0.5-0.9. The sphericity of the sand model selected in this paper is consistent with the sphericity of the sand.
Fig. 1The six kinds of shapes used in simulation
a)
b)
The cluster-particle diameter is defined as the virtual sphere diameter whose volume equals to the cluster-particle. The cluster-particle diameter is calculated as:
where is non-sphere cluster-particle diameter (mm), is cluster-particle volume (mm3).
2.3. Simulation conditions and the assessment criteria of screening performance
2.3.1. Simulation settings
As can be seen from the Fig. 2 and Fig. 3, the 3D-DEM modeling of banana screen was established to simulate the screening process of non-spherical particles using software-EDEM. Length, width and height of banana screen were arranged as 160 mm, 28 mm and 80 mm. The simplified banana screen model is composed of screen factory, the curved screening surface and screening box. Meanwhile the curved screening plate has 5 decks, and the angle difference of neighboring decks is 5.5 degrees. In addition, the inclination of the third deck was invariably 14 degrees when banana surface was in a straight-line oscillation. Vibration parameters including frequency, amplitude and vibration direction angle were mainly set by single factor experiment. The detailed parameters and simulation conditions were listed in Table 1. In order to provide more data to complete the mathematical mapping, orthogonal tests were conducted. Each of the three predominant factors was segmented into four levels whose values were chosen based on the single factor experiment above, which were listed in Table 2. All screening efficiency data were calculated, the mathematical model was established to optimize the parameters and the optimal combination of vibration parameters under the highest screening efficiency in later chapters.
Fig. 2Screening process of non-spherical particles
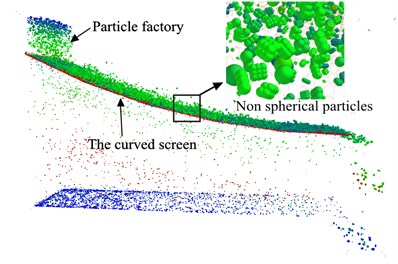
Fig. 33D model of banana screening
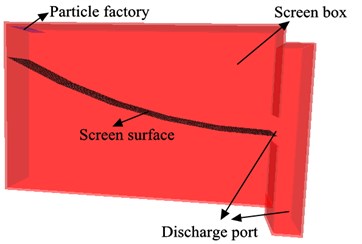
Table 1List of simulation parameters
Material properties | Poisson’s ratio | Shear modulus | Density |
Particle | 0.3 | 23 Mpa | 2678 kg/m2 |
Deck / Box | 0.29 | 79980 Mpa | 7861 kg/m2 |
Collision properties | Restitution coefficient | Static friction | Rolling friction |
Inter-particle | 0.1 | 0.545 | 0.01 |
Particle-deck | 0.2 | 0.5 | 0.01 |
Particle diameter | Mean 0.5 and 1.0 mm; Std: 0.55 | Particle generate rate | 1666 particles/s |
Screen length (mm) | 160 in horizontal projection | Particle total number | 10000 |
Screen width (mm) | 30 | Wire diameter (mm) | 0.7 |
Aperture size (mm) | 0.7×0.7 | Frequency (Hz) | 15, 20, 25, 30, 35, 40 |
Amplitude (mm) | 1.5, 2, 2.5, 3, 3.5, 4, 4.5 | Vibration direction angle (°) | 25, 30, 35, 40, 45, 50, 55 |
Table 2Factors and levels
Level | Frequency (Hz) | Amplitude (mm) | Direction angle (°) |
1 | 18 | 1.8 | 33 |
2 | 20 | 2 | 35 |
3 | 22 | 2.2 | 37 |
4 | 24 | 2.4 | 39 |
2.3.2. Assessment criteria of screening performance
Assessment criteria of screening performance can not only effectively express the quality of screening performance, but also be the foundation of mathematical modeling. We choose as Unit-time Screening Efficiency to stand for screening capacity and screening efficiency:
where is the screening efficiency in unit interval, and are the mass of particles whose diameters smaller than the aperture size in the undersized material respectively, and are total mass of particles whose diameters smaller than the aperture size respectively. is the duration of the sieving process.
2.4. Experimental verification
2.4.1. Banana screen with adjustable parameters
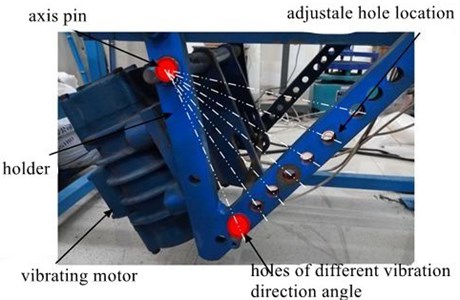
To verify the reliability of the simulation, the characteristics of experimental prototype are simple structure, short period, easy installation and maintained. Above all many parameters of banana screen such as incline angle, vibrating direction angle and so on can be adjusted and the structure is widely used in bolt fixing type. The vibrating screen was presented in Fig. 4, and Fig. 5 showed that the vibrating motor is installed on the mounting rack to provide exciting force. The purpose of adjusting vibration direction angle is achieved through fixing the shaft at one end of the mounting bracket and adjusting the mounting hole at the other end to the different positions. As shown in Fig. 5, the specific scope of the adjustable are: 15°, 25°, 35°, 45°, 55°, 65°, 75° and 85°.
Fig. 4Banana screen of adjustable parameters
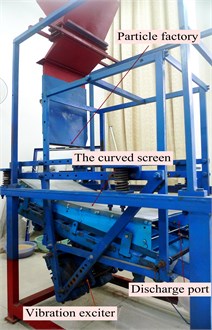
Fig. 5Adjustment scheme of vibration direction angle
2.4.2. Comparison of DEM simulation with experimental outcomes
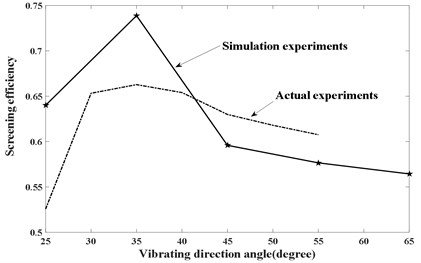
In this part, the paper carries out the comparison between physical experiment and simulation experiment. The result was listed in Fig. 7. In order to improve the reliability of contrast as far as possible, the material selected as sands with the shock type-based vibrating screen (Fig. 6) tried to meet size distribution of granules in the EDEM’ model. Meanwhile the main conditions of physical experiment are as follows: capacity 0.5 ton/h, vibrating amplitude 2.2 mm, vibrating frequency 22 Hz, the aperture 0.7 mm and the diameter of mesh 0.4mm. Under different vibrating direction angles, statistical regularity of Unit-time Screening Efficiency was conducted. But physics experiment and the simulation experiment cannot completely consistent. Because the process of numerical simulation cannot fully meet the conditions of physical experiments, such as the property of particle, the particle size distributions, the complex random particle shape and so on. Unit-time Screening Efficiency has a certain gap in physical experiment and simulation experiment. More important, the effect of vibration direction angle on Unit-time Screening Efficiency is consistent (same crest value and variation tendency). Fig. 7 showed that numerical simulation can reflect the law of screening, and screening mechanism research can be carried out by using DEM-numerical simulation method.
3. The banana screen regression model based on PSO-SVR
In this paper, the vibration parameters (vibration amplitude, vibration frequency, vibrating direction angle) are the mainly optimized parameters of vibrating screen. In industrial production, with the fixed equipment structure and craft parameters, the vibration parameters (that is operation parameters) are the most direct optimization parameters in production site. The purpose of building mathematical modeling is to optimize the parameters of banana screen. The optimized parameters are effective way to improve screening performance. High-dimension, non-linear and complex mathematical mapping between vibrating parameters and Unit-time screening efficiency was solved by support vector regression (SVR) which can deal with small sample problems and has good generalization ability using the principles of structural risk minimization. Kernel function directly affects the quality of SVR. In this paper, in order to improving the leaning ability and the predicting ability of the SVR modeling, the intelligent algorithm-particle swarm optimization was used to optimize the parameters including penalty parameter and Kernel function parameter in Radial Basis Function-RBF [25].
Fig. 6The shock type-based vibrating screen
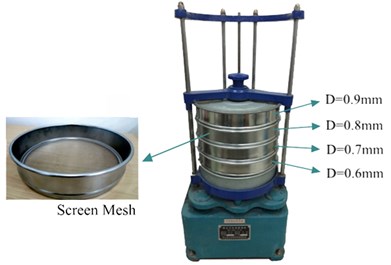
Fig. 7The comparison of simulation with actual experiment
3.1. The method of SVR
Linear regression which is basis of explaining the nonlinear regression is an important part of SVR [25]. All training data sets 1, 2, 3…, , , , under the fitting precision , are fit by the linear function as possible . The corresponding function as follow:
To facilitate the calculation of Lagrange conversion, the loss function is:
At the same time, in order to control the complexity of functions, according to the optimization theory, this paper optimized and minimized the VC dimension to control the expected risk of the whole sample.
3.2. The method of PSO
Optimal parameters , in RBF which depends on SVR generalization performance are further complicated due to SVM model complexity. As an intelligent algorithm in computing, PSO algorithm was inspired by the behavior of birds. Each group of particles (similar to birds in nature) in algorithm are the optimization goal of a set of potential solutions, and each group of particles have a N-dimensional search space on behalf of the number of parameters to be optimized in combinations [26]. The fitness of each group of particles can get the corresponding value. Within the search space, particle swarm with a certain flight direction and initial velocity varies with the individual and group flight experience for dynamic adjustment, so as to realize the globe optimization solution.
Table 3DEM-solution results
No. | (mm) | (°) | (Hz) | (%) | No. | (mm) | (°) | (Hz) | (%) |
1 | 1.5 | 45 | 20 | 27.67694 | 23 | 2.2 | 37 | 18 | 39.89687 |
2 | 2 | 45 | 20 | 44.99424 | 24 | 2.4 | 39 | 18 | 47.56771 |
3 | 2.5 | 45 | 20 | 53.97708 | 25 | 1.8 | 35 | 20 | 35.13287 |
4 | 3 | 45 | 20 | 52.25444 | 26 | 2 | 33 | 20 | 41.10875 |
5 | 3.5 | 45 | 20 | 50.20258 | 27 | 2.2 | 39 | 20 | 52.89655 |
6 | 4 | 45 | 20 | 48.76211 | 28 | 2.4 | 37 | 20 | 54.71309 |
7 | 4.5 | 45 | 20 | 47.13436 | 29 | 1.8 | 37 | 22 | 45.7189 |
8 | 2 | 25 | 20 | 30.92401 | 30 | 2 | 39 | 22 | 48.99843 |
9 | 2 | 30 | 20 | 43.55065 | 31 | 2.2 | 33 | 22 | 53.1094 |
10 | 2 | 35 | 20 | 47.34145 | 32 | 2.4 | 35 | 22 | 52.20527 |
11 | 2 | 40 | 20 | 46.71648 | 33 | 1.8 | 39 | 24 | 47.1592 |
12 | 2 | 45 | 20 | 44.99424 | 34 | 2 | 37 | 24 | 48.9128 |
13 | 2 | 50 | 20 | 44.1426 | 35 | 2.2 | 35 | 24 | 49.54852 |
14 | 2 | 55 | 20 | 43.40002 | 36 | 2.4 | 33 | 24 | 49.28272 |
15 | 2 | 60 | 20 | 42.88861 | 37 | 2.2 | 39 | 22 | 53.65323 |
16 | 2 | 45 | 15 | 15.41589 | 38 | 2.4 | 39 | 22 | 52.40812 |
17 | 2 | 45 | 20 | 44.99424 | 39 | 2 | 37 | 20 | 46.15368 |
18 | 2 | 45 | 25 | 44.6867 | 40 | 2.2 | 33 | 20 | 50.14654 |
19 | 2 | 45 | 30 | 43.84538 | 41 | 2 | 33 | 22 | 50.02739 |
20 | 2 | 45 | 35 | 40.61504 | 42 | 2.2 | 35 | 22 | 54.27371 |
21 | 2 | 45 | 40 | 38.28651 | 43 | 2.2 | 37 | 22 | 53.37402 |
22 | 1.8 | 33 | 18 | 21.11952 | 44 | 2 | 35 | 18 | 30.41073 |
3.3. Non-linear modeling of banana screen using PSO-SVR
Mathematic model needs to be established between parameters and Unit-time Screening Efficiency. The mapping function is given by:
where is vibrating amplitude, (mm), is vibrating direction angle, (°), is vibrating frequency, (HZ).The function relation is difficult to express using a simple function because of its highly nonlinear. The data of DEM solutions were used as input and output sample data listed in Table 3 for training and testing. Of the 44 groups of data, 35 groups were chosen randomly as training data and the remaining 9 groups of data were selected as testing data. The data which were listed in Table 3 consisted of two parts: single factor experiments and orthogonal test. The total sample size meets the need of regression modeling. In this paper the lower limit and upper limit of SVR parameters (, ) in PSO optimal process were set in Table 4. At last the optimal results also listed in Table 4.
Table 4The optimal results via PSO
SVR parameters | Lower limit | Upper limit |
10-2 | 103 | |
10-1 | 102 | |
Optimal results | 13.4085 | 0.94305 |
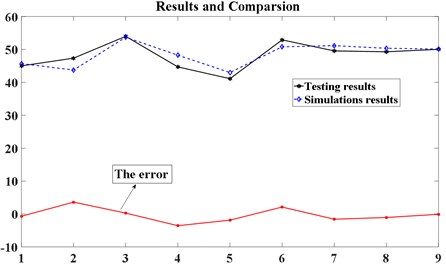
Fig. 8 shows PSO-SVR ability of learning about simulation data of 35 samples. From Fig. 9, we can see that the 9 sets of testing data results obtained by DEM-solution and the predicting outcomes established by PSO-SVR are compared. The two do have errors, but the overall trend and output errors are within acceptable limits. At the same time, two graphs show that the model established by PSO-SVR has good learning ability of samples, and the generalization prediction ability of fresh data is also better. In conclusion, vibration parameters of the sieving banana screen can be optimized by using the model described above.
Fig. 8Comparison between training results and DEM simulation results
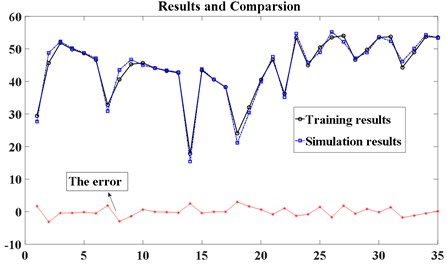
Fig. 9Comparison between texting results and DEM simulation results
4. Optimal banana screen’s parameters combination based on AFSA
4.1. The optimizing process of AFSA
Computation model is a highly non-linear, multiple maximum and non-differentiable large computational problem. Although the traditional regression algorithms such as Powell method and gradient decent method have their merits, it’s hard to solve the PSO-SVR modeling which doesn’t possess strict mathematical conditions for example differential and continuous. As an intelligence algorithm, Artificial Fish Swarm Algorithm (ASFA) has the advantages of global optimality, robustness and high convergent speed [27, 28]. The algorithm simulates fish foraging, tailgating and clustering behavior, and the local optimization of each fish can achieve global optimization, which has been used to solve various combinatorial optimization problems.
In the actual process of banana vibrating screen, vibration strength needs to keep within the reasonable limit avoiding particles to attach screen and to excessive fly. So, the feasible region range of each design variable is the constraint condition of parameter combination optimization. According to the mathematical model established above, the relationship between parameters and Unit-time Screening Efficiency needs to be optimized and optimization objectives can be expressed as:
where is vibrating amplitude, is vibrating direction angle, is vibrating frequency, is Unit-time Screening Efficiency.
5. The results of the optimization process
Suppose the artificial fish (, , ,…, ), individual fish stands for optimal variables such as vibrating frequency. In this algorithm, Distance Perception suggested scope of individual fish’ activities; individual fish’ moving step length value and the other main parameters was listed on Table 5. Fig. 10 presented the flowchart of AFSA-PSO-SVR for optimization.
Fig. 10Flowchart of AFSA-PSO-SVR for optimization
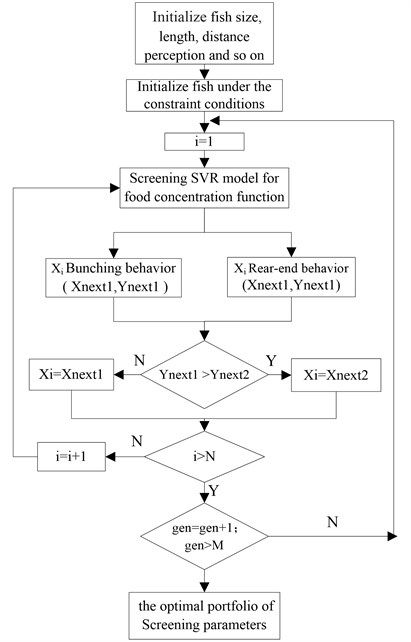
Table 5Selection of artificial fish group parameters
Parameter | Value | Parameter | Value |
Number of fish | 50 | Distance perception | 0.5 |
Maximum iterations | 20 | Crowding factor | 0.718 |
Foraging test number | 50 | Moving step length | 0.3 |
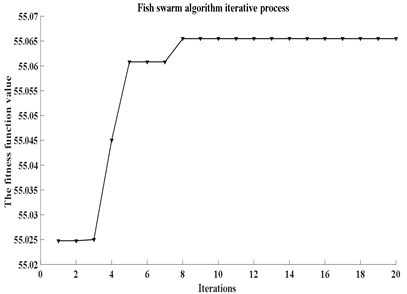
The change of 20 iterations is shown in Fig. 11. By the whole algorithm of AFSA-PSO-SVR, the optimal combination is as follow: vibration amplitude 2.36018 mm, the optimization results of vibration frequency 20.61352 Hz, vibrating direction angle 40.339° screening efficiency 55.0654 %. The round numbers of combination parameters (amplitude of 2.4 mm, vibration frequency of 21 Hz, vibration direction Angle of 40°) were used to simulate the sieving process of banana screen. DEM-solutions result is about Unit-time Screening Efficiency of 56.1 %. The non-parametric model established using the integration of DEM and SVR, combined with ASFA algorithm in subsequent parameter optimization offered insights to the design and manufacture of vibrating banana screens.
Fig. 11The iterative process of AFSA-PSO-SVR
6. Conclusions
This paper conducted the following research on the problem of the unclear relationships between the performance of banana screen and screening parameters:
1. DEM-solutions which instead of a time-consuming physical experiment can effectively simulate the irregular particles movements considering the collisions and material properties in banana screen. The variation tendency of screening efficiency under the different vibration parameters between simulations and physical experiments is consistent.
2. Mathematical modeling of highly nonlinear screening process is performed using SVR that was optimized by PSO. The mapping which provides the basis for parameter combination demonstrates good learning and generalization ability.
3. Non-differentiable and highly non-linear SVR modeling of banana screen was optimized by AFSA. The optimal combination is as follow: vibration amplitude 2.36018 mm, the optimization results of vibration frequency 20.61 Hz, vibrating direction angle 40.339° screening efficiency 55.07 %.
4. The error caused by the particle shape in simulations, the penalty parameter C and kernel in SVR and the influence factor about initial value in ASFA, all of that need further research.
References
-
Jahani M., Farzanegan A., Noaparast M. Investigation of screening performance of banana screens using LIGGGHTS DEM solver. Powder Technology, Vol. 283, 2015, p. 32-47.
-
Li Z. F., Tong X. A study of particles penetration in sieving process on a linear vibration screen. International Journal of Coal Science and Technology, Vol. 2, Issue 4, 2015, p. 299-305.
-
Li J., Webb C., Pandiella S. S., Campbell G. M. A numerical simulation of separation of crop seeds by screening-Effect of particle bed depth. Food and Bioproducts Processing, Vol. 80, Issue 2, 2002, p. 190-202.
-
Dong K. J., Yu A. B., Brake I. DEM simulation of particle flow on a multi-deck banana screen. Minerals Engineering, Vol. 22, 2009, p. 910-920.
-
Cleary P. W., Matthew Sinnott D., Rob Morrison D. Separation performance of double deck banana screens – Part 1: Flow and separation for different accelerations. Minerals Engineering, Vol. 22, 2009, p. 1218-1229.
-
Cleary P. W., Matthew Sinnott D., Rob Morrison D. Separation performance of double deck banana screens – Part 2: Quantitative predictions. Minerals Engineering, Vol. 22, 2009, p. 1230-1244.
-
Cleary P. W., Sawley M. DEM modelling of industrial granular flows: 3D case studies and the effect of particle shape on hopper discharge. Applied Mathematical Modelling, Vol. 26, 2002, p. 89-111.
-
Jiao H. G., Ma J., Zhao Y. M. Study on the numerical simulation of batch sieving process. Journal of Coal Science and Engineering, Vol. 12, 2006, p. 80-83.
-
Liu G. H., Tong X., Xin C. T. Numerical simulation of vibration screening process and its process. Metal Mine, Vol. 9, 2008, p. 104-110.
-
Fernandez J. W., Cleary P. W., Sinnott M. D., Morrison R. D. Using SPH one-way coupled to DEM to model wet industrial banana screens. Minerals Engineering, Vol. 24, 2011, p. 741-753.
-
Li Z. F., Tong X. Applications of the discrete element method and Fibonacci sequence on a banana screen. Journal of Engineering, Design and Technology, Vol. 15, Issue 1, 2017, p. 2-12.
-
Cleary P. W. Particulate mixing in a plough share mixer using DEM with realistic shaped particles. Powder Technology, Vol. 248, Issue 2, 2013, p. 103-120.
-
Frederik E., Harald K. E., Manuel H., Ulrich T. Benchmarking of process models for continuous screening based on discrete element simulations. Minerals Engineering, Vol. 83, 2015, p. 78-96.
-
Bereton T., Dymott K. R. Some factors which influence screen performance. Proceedings on International Mineral Processing, London: Institution of Mining and Metallurgy, 1974, p. 181-194.
-
Subasinghe G. K. N. S., Schaap W., Kelly E. G. Modeling the screening process: a probabilistic approach. Powder Technology, Vol. 59, Issue 1, 1989, p. 37-44.
-
Chen Y. H., Tong X. Modeling screening efficiency with vibrational parameters based on DEM 3D simulation. Mining Science and Technology, Vol. 20, 2010, p. 615-620.
-
Li Z., Tong X., Zhou B., Wang X. Modeling and parameter optimization for the design of vibrating screens. Minerals Engineering, Vol. 83, 2015, p. 149-155.
-
Cundall P. A., Strack O. D. A discrete numerical model for granular assemblies. Geotechnique, Vol. 29, Issue 1, 1979, p. 47-65.
-
Standish N., Bharadwaj A. K., Hariri Akbari A. A study of the effect of operating variables on the efficiency of a vibrating screen. Powder Technology, Vol. 48, Issue 2, 1986, p. 161-172.
-
Cleary P. W., Robinson G. K., Golding M. J., Owen P. J. Understanding factors leading to bias for falling-stream cutters using discrete element modeling with non-spherical particles. Chemical Engineering Science, Vol. 63, Issue 23, 2008, p. 5681-5695.
-
Elskamp F., Kruggel Emden H. Review and benchmarking of process models for batch screening based on discrete element simulations. Advanced Powder Technology, Vol. 26, Issue 3, 2015, p. 679-697.
-
Zhu H. P., Zhou Z. Y., Yang R. Y., Yu A. B. Discrete particle simulation of particulate systems: A review of major applications and findings. Chemical Engineering Science, Vol. 63, Issue 23, 2008, p. 5728-5770.
-
Gabriel K. P. B., Carvalho R. M. D., Kwade A., Tavares L. M. Contact parameter estimation for DEM simulation of iron ore pellet handling. Powder Technology, Vol. 248, Issue 2, 2013, p. 84-93.
-
Cho G. C., Dodds J., Santamarina J. C. Particle shape effects on packing density, stiffness and strength –natural and crushed sands. Journal of Geotechnical and Geoenvironmental Engineering, Vol. 132, Issue 5, 2006, p. 591-602.
-
Vapnik V. N. An overview of statistical learning theory. IEEE Transactions on Neural Networks, Vol. 10, Issue 5, 1999, p. 988-999.
-
Kennedy J., Eberhart R. Particle swarm optimization. Proceedings of IEEE International Conference Neural Networks, 1995, p. 1942-1948.
-
Shen Z. J., Chen X. F., He Z. J., Sun C., Zhang X. L., Liu Z. W. Remaining life predictions of rolling bearing based on relative features and multivariable support vector machine. Journal of Mechanical Engineering, Vol. 2, 2013, p. 183-189.
-
Li X. L., Shao Z. J., Qian J. X. An optimizing method based on autonomous animats: Fish-swarm algorithm. Systems Engineering-Theory and Practice, Vol. 11, 2002, p. 32-38.
Cited by
About this article

The authors gratefully acknowledged the support from the Program for scientific and technological innovation flats of Fujian Province (2014H2002). Fujian Natural Science Foundation (2017J01675). Key projects of Fujian provincial youth natural fund (JZ160460). 51st scientific research fund program of Fujian University of Technology (GY-Z160139). No part of this paper has published or submitted elsewhere. The authors declared that they have no conflicts of interest to this work. All authors have seen the manuscript and approved to submit to your journal.
