Abstract
Utilizing numerical simulation, this study investigated the performance of aortic valves with abnormally thickened leaflets during the systolic phase of the cardiac cycle. The method used coupled computational fluid dynamics and finite element analysis simulations to solve flexible structures interaction with surrounding fluid flow in the valves. The valve model was developed with a valve height of 10 mm, a free edge angle of 0 degrees, a leaflet thickness of 0.2 mm and a valve radius of 23.5 mm. Different cases of valve diseases were considered, including cases involving one thickened leaflet and cases involving two thickened leaflets. In these studied cases, the thickness of the diseased leaflet or leaflets was thicker than that of a normal one by 50 %, 100 % and 150 %, respectively. High shear stresses were discovered during leaflets acceleration period along with big leaflets distortions for all six diseased valve models. The diseased valve with 150 % thicker leaflets experienced a shear stress of up to 98.6 Pa that could disrupt the functions of the valve and therefore lead to severe problems of the cardiovascular system.
1. Introduction
Valvular diseases often affect the left side of the heart due to the relatively high pressure environment of the aortic valve. Valvular diseases include incompetence (retrograde flow) and stenosis (flow blockage) [1]. This study concentrates on the valves seen in stenosis diseases. Stenosis is caused by the calcification of leaflets; such calcification results in abnormally thickened or stiffer leaflets that require higher pressures to open the valves.
Evaluations of thrombosis, hemolysis and endothelial lining damage are largely based on hemodynamic analysis of aortic valve flow patterns. Various in vitro techniques have been used to study flow across the aortic valve and extract flow information from associated experiments [2, 3]. However, those studies can provide only certain specific types of data. It is therefore necessary to use several techniques in a complementary manner to understand certain aspects of the performance of the heart valves. For example, numerical simulations of flow through the aortic valve provide a noninvasive method for obtaining, for example, velocity and shear stress distributions in the aortic valve flow regime. These techniques can provide full domain information, including both forms of data that can be measured by in vitro setups and those that cannot.
Numerical fluid-structure interaction (FSI) simulations can completely solve the time-dependent movement of valve leaflets but require a substantial calculation effort. In order to reduce the resulting computation costs, the flow regime is often simplified with symmetry geometry. Such simplification, however, constrains the capabilities of these methods when they are used to analyze problems that require asymmetric models. For example, diseased valves often result in the asynchronous movement of valve leaflets. Relatedly, while some studies [4, 5] have made efforts to investigate problems involving diseased heart valves, detailed results including flow field velocity and shear stress analysis results have not been provided. On the other hand, a quasi-steady method, the validity of which has been proved experimentally [6], could be applied to most problems with complicated geometric models, and this method requires less computation time. Using a quasi-steady FSI model developed by the authors [7], this paper essentially develops the performance study of aortic valves with abnormally thickened leaflets during systole.
2. Methodology
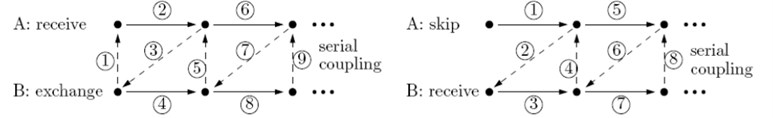
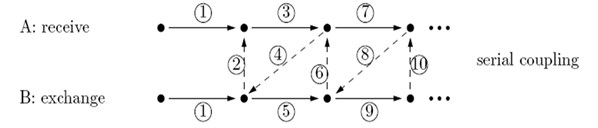
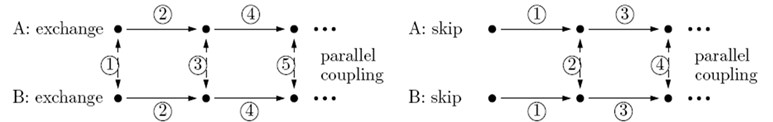
We refer the reader to Hsu et al. [7] for a detailed description of the developed numerical FSI model. The model involved a coupling of the blood flow domain with the flexible valve leaflets and the aortic root of the aortic valve. There are two common couple algorithms including serial coupling and parallel coupling. In the serial coupling algorithm, code A (CFD/FEA) computes one step and then sends data to code B (FEA/CFD), which then computes one step and sends data back to CFD code, and so on. During the serial coupling process, there will always be one code that is computing while the other code is waiting for the data in each step. In the parallel coupling algorithm, both the CFD and FEA codes start computing at the same time, and also exchange data at each step (Fig. 1).
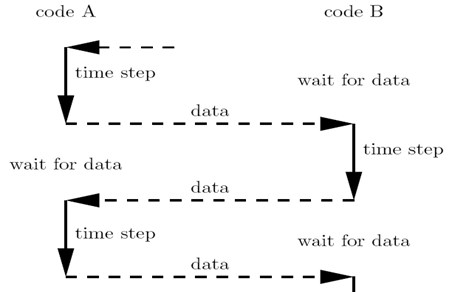
Fig. 1Data exchange between code A and code B
The current study used a staggered method (Fig. 2) that can be classified as a serial coupling algorithm to couple FLUENT (CFD code) and ABAQUS (FEA codes). In this approach, FLUENT starts computing first, then sends data (i.e., pressure or shear stress data) to ABAQUS, which then computes one step and sends data (i.e., data regarding node moving positions or face deformation) back to FLUENT for the next step, and so on. An important issue in this process is the data exchange. The quantities must be transferred from one code to the other. There are several ways to solve this problem. For example, on option is to develop an interface that is based on complicated algorithms like MpCCI, while another is to utilize the User-Defined Function and Dynamic mesh of FLUENT to read moving node positions from ABAQUS and reconstruct the working domain in FLUENT. This study presents a simpler data exchange method that totally utilizes commercial Computer Aided Design (CAD) packages.
The model was carried out in accordance with the following assumptions:
1) Transvalvular pressure ΔP is applied to aortic valve leaflets and induces the deformation of leaflets. The ΔP value is equal to the pressure difference between that of the upstream left ventricle and that of the aorta district of a valve during one pulsation.
2) Blood is a Newtonian fluid.
3) The thickness of valve leaflet is uniform.
4) The root wall of the aorta is rigid.
Fig. 2Staggered method
The surfaces of the deformed leaflets as modeled in ABAQUS (finite element analysis (FEA) software) were delivered to FLUENT (computational fluid dynamics (CFD) software) for fluid dynamics analysis using Alter Hyper-mesh to read and recreate the surfaces of the deformed leaflets and SolidWorks software to the regenerate fluid working domains according to the deformed valve leaflets. The resulting mesh diagrams are shown in Fig. 3. The global size for the mesh elements was set as 0.8, with triangle elements used for the face mesh and tetra elements used for the volume mesh (Fig. 3(a)). The numerical model (Fig. 3(b)) consists of three regions, including the Fix-in and Fix-out regions, each with a mesh ratio of 0.003, and the Domain region with a mesh ratio of 0.001.
Fig. 3Model mesh diagrams for: a) leaflets, b) domain
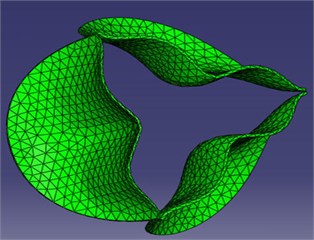
a)
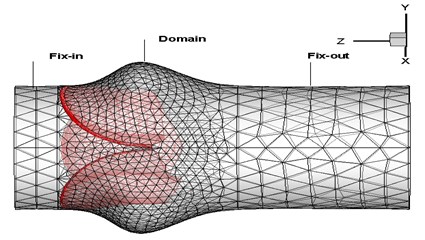
b)
The simulation was simplified using leaflet deformation analysis in ABAQUS, which could be conducted independently by using pre-known loads, for example, transvalvular pressure on the valve. The geometries of the deformed valve leaflets at each step were then exported to the FLUENT software, as shown in Fig. 4, which then performed blood flow analysis. The numerical model showed very promising results that really matched with strong coupling solutions reported in the previous studies [8, 9]. We could therefore conclude that the simulation results are completely reliable. In this study, the geometry development for the aortic valve, the thickened leaflet model and the sinus model were demonstrated in Section 2.1-2.4.
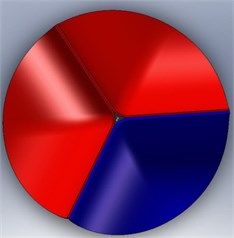
2.1. The aortic valve model
The aortic valve consists of three highly flexible leaflets attached to the aortic root. Many studies have tried to comprehensively describe the dimensions of the valve [10]. We refer the reader to Hsu et al. [7] for a detailed description of the aortic valve geometry. Essentially, the aortic valve model is determined by the parameters of valve radius (), valve height () and free edge angle (). To simplify the model, this study assumed that the valve base radius equals the valve radius () and that the angle is 0 degrees. The material properties and related values of the valve dimension parameters for an aortic valve with normal thickness are summarized in Table 1.
Fig. 4FSI simulation processing
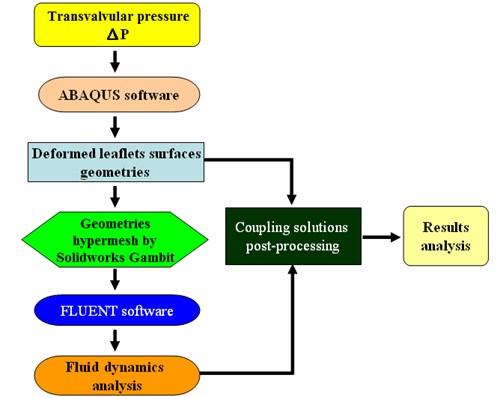
Table 1Dimensions and material properties of aortic valve, sinus and valve leaflet thickness
Material properties and related values of the valve leaflet | |||||||||
Density (kg/m3) [11] | Young’s Modulus (MPa) [12] | Poisson’s ratio | |||||||
1000 | 0.012 | 0.28 | |||||||
Blood properties | |||||||||
Density: 1037 kg/m3 Viscosity: 0.0035 kg/m-s | [13] | ||||||||
Aortic valve | Aortic Sinus | ||||||||
(mm) | (mm) | (degree) | (mm) | (mm) | (mm) | (mm) | |||
11.75 | 10 | 0 | 11.75 | 5.75 | 21.0 | 10.5 | |||
Aortic valve leaflet thickness | |||||||||
Normal | Disease 1 | Disease 2 | Disease 3 | ||||||
0.2 (mm) | 50 % increased | 100 % increased | 150 % increased | ||||||
2.2. The thickened leaflet valve model
The calcification of the aortic valve leads to abnormal thickness of the valve leaflets. However, the clinical data reported about the dimensions of this valvular disease is not sufficient. In addition, this disease is affected by the complex leaflet structure, which might be too complicated to simulate. To simplify the analysis, then, we considered the valve leaflet to consist of one layer with a uniform thickness. Therefore, the diseased valve is represented in a form similar to that of a normal valve but with thicker leaflets. On the other hand, we also assume two levels of disease severity, including a level with only one thickened leaflet (level-1) (Fig. 5 (a)) and a second level with two thickened leaflets (level-2) (Fig. 5(b)). The parameters for an aortic valve with normal thickness and with thickened leaflets are summarized in Table 1.
2.3. The aortic sinus model
The aortic sinus, which has a bulbous geometry, is one of the anatomic dilations of the ascending aorta (Fig. 6). The values of the sinus dimensions originally proposed by DeHart et al [14] are presented in Table 1. As shown in Fig. 6, is the valve radius, is the sinus depth, is the sinus height, is the commissural height and is the leaflet thickness.
Fig. 5Valve disease models: a) 1 thickened leaflet; b) 2 thickened leaflets
a)
b)
Fig. 6Sinus geometry [12]
![Sinus geometry [12]](https://static-01.extrica.com/articles/17426/17426-img10.jpg)
2.4. Boundary conditions
The pressure difference can be determined by the data of computational calculations or experimental measurements. The model used in this study adopts the data from DeHart et al [14] for leaflet deformation analysis. According to the assumptions listed in Section 2.1, the ABAQUS software can analyze the deformation of leaflets independently. On the other hand, the proposed boundary conditions for the computational fluid dynamics analysis are velocity for inlet and aorta pressure for outlet. The uniform axial velocity distribution at each moment is prescribed in the inflow plane, with the case when the pulse peak flow reaches 290 ml/s leading to a Reynolds () number of 3800. For outlet pressure, a physiological aortic pressure would be loaded to the outflow plane of the system.
3. Results and discussion
The study cases include cases involving valves with one thickened leaflet and cases involving valves with two thickened leaflets, with the leaflet thickness being increased by 50 %, 100 %, and 150 %, respectively. The notations for these valve disease cases were as follows:
– 1T03: Valve disease with one thickened leaflet 50 % thicker than a normal leaflet;
– 2T03: Valve disease with two thickened leaflets 50 % thicker than a normal leaflet;
– 1T04: Valve disease with one thickened leaflet 100 % thicker than a normal leaflet;
– 2T04: Valve disease with two thickened leaflets 100 % thicker than a normal leaflet;
– 1T05: Valve disease with one thickened leaflet 150 % thicker than a normal leaflet;
– 2T05: Valve disease with two thickened leaflets 150 % thicker than a normal leaflet.
3.1. Orifice distortion
The three leaflets of a normal valve behave, theoretically, in a similar manner under the same loading condition. Many studies [14, 15] have simulated only one typical leaflet. The final results were then organized by symmetry operation or periodical repeats of the original leaflet. The valve orifice itself was therefore depicted as being symmetric in such studies. In diseased valves, however, the three leaflets react in different ways to different loadings, resulting in valve orifice distortion.
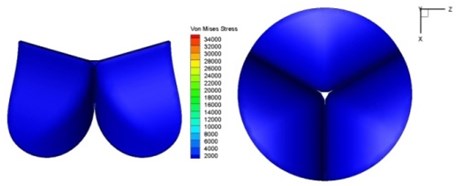
Fig. 7Valve orifice distortion comparison among normal valve and disease valves
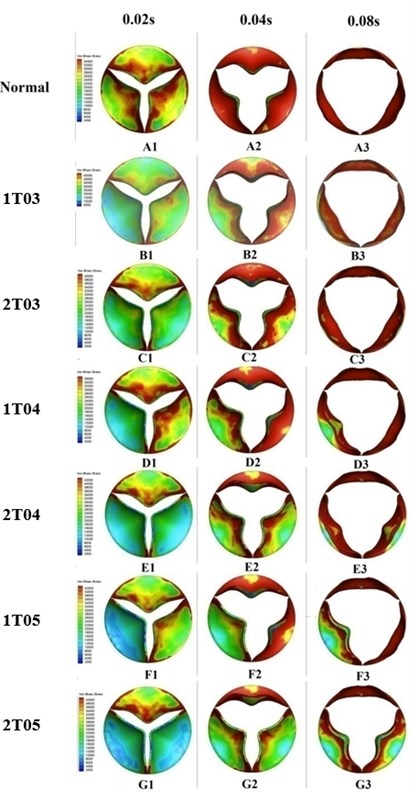
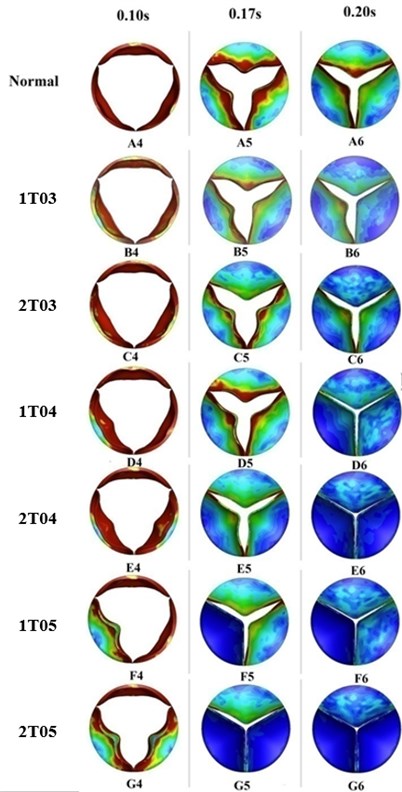
Leaflets with greater thickness exhibit higher stiffness and resistance to deformation under loading. This phenomenon could be proved by the finding of lower von-Mises stress distributions on the thicker leaflets of a diseased valve (Fig. 7). The results depicted in Fig. 7 also indicated that the thickened leaflets were responsible for different distortions of the valve orifice. During the acceleration phase, from 0 sec to 0.08 sec, the orifice distortions were small for the diseased valves with increasing leaflet thickness less than 100 % (B2-3, C2-3, and D2-3). The cases involving two thickened leaflets with a 100 % increase in thickness, however, resulted in a considerably higher distortion of the valve orifices (E1-2). Meanwhile, the valve orifice was even more impacted by cases in which the diseased valve had a leaflet or leaflet with an increased thickness of 150 % (F1-2, G1-2).
During the ejection phase, from 0.08 sec to 0.1 sec, the cases in which the diseased valve had a 50 % thicker leaflet or leaflets exhibited an insignificant difference in orifice opening levels compared to those of a normal valve (B3-4). However, the differences between the normal valve and diseased valves were clearly evident for the cases of higher leaflet thickness, i.e., those in which the thickness of a leaflet or leaflets was increased by 100 % or 150 % (D3-4, E3-4, F3-4, and G3-4). During the deceleration phase after 0.1sec, the thickened leaflets of the diseased valves induced substantial distortion of the valve orifices (B5-6, C5-6, D5-6, E5-6, F5-6, and G5-6).
3.2. Effective orifice area
The effective orifice area (EOA) is a quantity that represents the cross-sectional area of the vena contracta of a jet flow through a circular orifice. The value of the EOA can be computed by the following formulation [1]:
where is the root-mean-square (rms) of the flow rate (mL/s) during the forward flow through the valve and is the mean pressure drop (mmHg) across the valve. The parameter is selected to be 51.6 [16] based on the discharge coefficient used for the aortic valve and the unit conversion factors in order to determine the computed area in terms of square centimeters.
This study computed the EOA of a normal valve and six cases of valves with diseases at some typical moments during systole. Valves with larger EOA values exhibited smaller pressure drops and energy losses in flow across the valve.
Fig. 8EOA comparison among normal valve and thickened leaflet valves
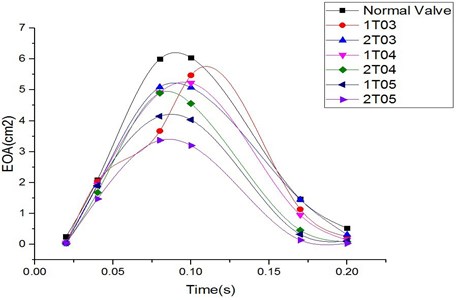
The variations in the EOA during systole were similar for the normal valve and the diseased valves, as shown in Fig. 8. The EOA increased during the period from 0 s to 0.1 s and decreased during the deceleration phase from 0.1 s to 0.2 s. The greatest differences between the EOA value of the normal valve and those of the abnormally thickened valves could be found at peak systole (0.1 s) and during the deceleration phase. The diseased valves with high distortion rates of the valve orifice exhibited more resistance to the blood flow and therefore induced greater pressure drops across the valve. The valves with thicker leaflets resulted in smaller EOA values. Moreover, the cases involving two thickened leaflets induced greater impacts on the valve EOA, which was reflected through even smaller EOA values. However, the EOA in case 1TO3 suddenly dropped at 0.08 sec, as shown in the figure, resulting in a significantly different tendency from that of the other cases. Our previous study [17] evaluating the effect of the thickness of the valve leaflets on the performances of the valve indicated that a leaflet thickness of 0.3 mm (i.e., a thickening rate of 50 %) played a role as a transforming point. More specifically, a valve leaflet with a thickness of less than 0.3 mm showed highly flexible characteristics, whereas one with a thickness greater than 0.3 mm resulted in high stiffness. Due to this special characteristic, the case involving a diseased leaflet with a thickness of 0.3 mm (1T03) induced a higher pressure drop across the valve, resulting in the EOA value being decreased. This effect might be eliminated for a valve with two thickened leaflets with a thickness of 0.3 mm (2T03).
The case involving two thickened leaflets with a 150 % increase in thickness induced a difference in the EOA value of up to 47 % compared with that of the normal valve at peak systole. Such a large difference in the EOA showed the higher energy loss in the diseased valve.
3.3. Opening vs. closing time
Theoretically, the aortic valve opens during systole when the ventricle is contracting and then closes during diastole as the ventricle relaxes and fills from the atrium. Systole lasts about one-third of the cardiac cycle and begins when the aortic valve opens, which typically takes only 20 to 30 msec [18]. As mentioned earlier, this study assumed that transvalvular pressure is the only load that acts on the valve leaflet during a cardiac cycle. In fact, during the diastole phase, the aortic valve is affected by diastolic pressures which might result in excessive deformations of the valve leaflets with applied material parameters in simulations. In reality, the natural valve shows a complex fiber-reinforced composite texture that allows it to bear diastolic pressures. Therefore, the simulations in the current study did not include the diastolic phase.
Fig. 9 presents a series of opening and closing behaviors of the aortic valve during the systolic phase, which lasts for about 0.35 sec. At the beginning of the systolic phase, the valve started opening to create a stellular orifice (Fig. 9(b)). The transvalvular pressure was increasing at that point and resulted in further opening of the valve leaflets that formed a triangular shape in the valve orifice (Fig. 9(c)). At 0.08 sec, the opening of the valve was at the maximum level, and the orifice exhibited a more circular shape (Fig. 9(d)). Although at this moment the flow had not reached its peak, the valve started to close. The blood flow from left ventricle reached its maximum (peak) at 0.1 sec as the valve was closing already, and the shape of the orifice began to change back from circular to triangular (Fig. 9(e)). During the remaining time of the systolic phase, the valve continued closing, resulting in the orifice shape changing further from that of a triangle to a smaller triangle (Fig. 9(f)), and then from a small triangle to a stellular shape (Fig. 9(g)). The valve completely closed at about 0.3 sec (Fig. 9(h)).
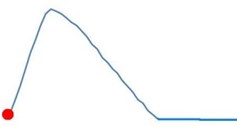
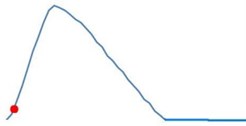
Fig. 10 graphs the opening and closing times of the seven study cases, including the normal valve and the six cases of diseased valves. The opening phase of the valves lasted from 0 sec to the moment when the valve had fully opened, while the closing phase was measured from the moment when the valve began to close to the moment when no further movement of the valve leaflets could be detected.
The results showed that the opening time for all seven cases occurred within the period from 0.07 sec to 0.085 sec, which could be considered as an acceptable value range for the valve before the blood flow from the ventricle reached peak systole at 0.1 sec. Meanwhile, the closing times of the normal and diseased valves were different. Diseased valves with a leaflet or leaflets with an increased thickness of less than 100 % often showed a longer closing time and thus longer heart beat time than those of the normal valve. In a comparison of valves with one thickened leaflet and valves with two thickened leaflets, the latter valves often opened more slowly but closed more quickly, thereby leading to a shorter heart beat time in total. On the other hand, the diseased valves with a leaflet or leaflets with a thickening rate of 150 % presented the shortest opening-closing time due to the faster moving velocity of the leaflets in both the opening and closing phases.
Fig. 9Valve leaflet deformation during systole
a) 0 s
b) 0.02 s
c) 0.04 s
d) 0.08 s
e) 0.1 s
f) 0.17 s
g) 0.2 s
h) 0.3 s
As discussed above, higher leaflet thickness often resulted in greater stiffness, which caused the leaflets to be resistant to movement. The normal valve leaflets often moved faster than the thicker leaflets of diseased valves in both the opening and closing phases and resulting in distortions of the valve orifices. For valves with one thickened leaflet, the much faster movement of the two normal leaflets during the acceleration phase resulted in not only different positions of the leaflets but also different heights for the three tips of the leaflet free edges. This induced a wider valve orifice. Commonly, the thickened leaflets could not reach a state of being fully open before the valve started to close, thereby leading to big distortions of the valve orifices during both the ejection phase and deceleration phase.
Fig. 10Opening and closing time comparison among normal and thickened leaflets valves
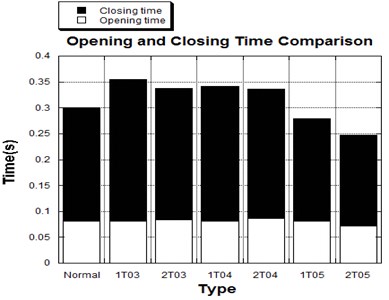
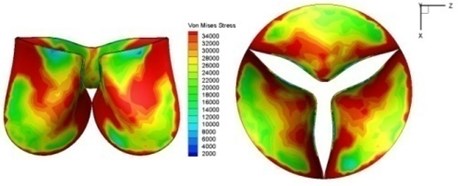
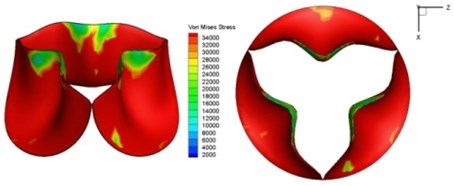
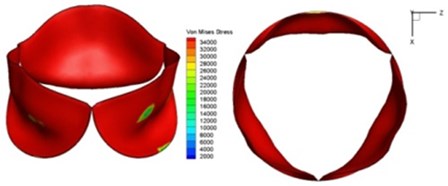
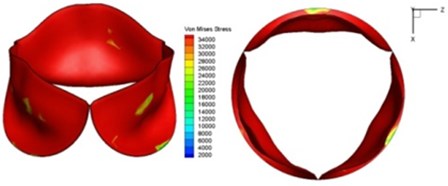
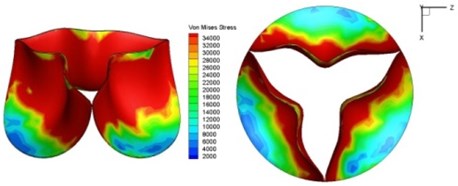
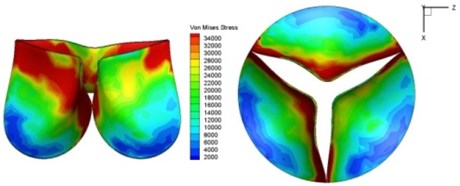
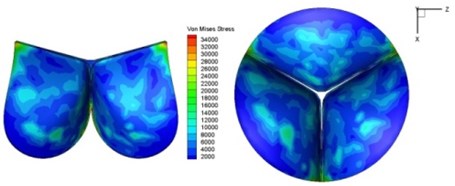
Fig. 11Average shear stress distribution on normal valve and thickened leaflet valves
3.4. Shear stress distribution
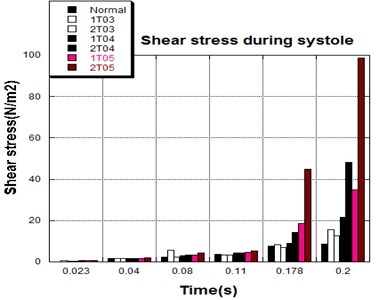
The distortions to the valve orifice in diseased valves could lead to complex phenomena in terms of blood flow and generate high pressure differences between ventricular and ascending aorta. The flow also produced different variations in the shear stress exerted on the valve leaflets (Fig. 11).
High shear stress was often concentrated in regimes where jet impingements or high blood velocity occurred. For all six diseased valve models, high shear stresses were found during the acceleration time corresponding to the moments when big distortions appeared. The case involving two thickened leaflets with a thickening rate of 100 % showed a prominently high shear stress of 48 Pa at 0.2 sec, while the case involving two thickened leaflets with a thickening rate of 150 % showed prominently high shear stresses of 45 Pa and 98.6 Pa at 0.178 sec and 0.2 sec, respectively. It should be noted that the concentration of high stress would have a high possibility of causing calcification and abnormal thickness of leaflets. This explained why higher stress was observed on thicker leaflets. Furthermore, these shear stresses exceeded the damage limit of the endothelial lining (40 Pa [19]) and so could lead to valve failure. In particular, a shear stress of 98.6 Pa for a diseased valve could disrupt the valve’s function after some heart beat cycles. This could induce severe problems for the valve and cardiovascular system.
4. Conclusions
This study investigated diseased aortic valves with abnormally thickened leaflets by combining CFD and FEA codes. Six study cases including valves with one thickened leaflet and valves with two thickened leaflets with thickening rates of 50 %, 100 %, and 150 % were investigated, and the conclusions are provided below.
1) The thickened leaflets caused distortions of the valve orifices during systole that led to complex phenomena in terms of the blood flow. The high stiffness of the diseased valve leaflets that resulted in differences of moving velocity among the normal and diseased leaflets was the main cause of the leaflet distortions. Generally, cases involving thicker leaflets and those involving two thickened leaflets resulted in greater effects on the valve orifices that resulted, in turn, in higher orifice distortion rates.
2) The distorted orifices changed the flow stream and induced more obstruction to the blood flow. These phenomena induced decreases in the amount of blood passing through the valve to the aorta and very high pressure drops across the valve during the deceleration phase. Furthermore, the high-pressure differences between the aorta and ventricle could generate excessive loads on the valve.
3) The smaller orifice and higher pressure differences of the diseased valves resulted in high stress distributions on the valve leaflets during the deceleration phase. The diseased valve leaflets with a thickening rate of 150 % experienced a shear stress of up to 98.6 Pa that could disrupt valve function and induce severe problems to the valve and cardiovascular system.
References
-
Chandran K. B. Heart Valve Prostheses. Encyclopedia of Medical Devices and Instrumentation. John Wiley and Sons, 2006.
-
Akutsu T., Saito J. Dynamic particle image velocimetry flow analysis of the flow field immediately downstream of bileaflet mechanical mitral prostheses. Journal of Artificial Organs, Vol. 9, 2006, p. 165-178.
-
Lee H., Tatsumi E., Homma A., Tsukiya T., Taenaka Y. Mechanism for cavitation of monoleaflet and bileaflet valves in an artificial heart. Journal of Artificial Organs, Vol. 9, 2006, p. 154-160.
-
Van Loon R. Towards computational modeling of aortic stenosis. International Journal for Numerical Methods in Biomedical Engineering, Vol. 26, 2010, p. 405-420.
-
Korakianitis T., Shi Y. Numerical simulation of cardiovascular dynamics with healthy and diseased heart valve. Journal of Biomechanics, Vol. 39, 2006, p. 1964-1982.
-
Sacks M. S., Yoganathan A. P. Heart valve function: a biomechanical perspective. Philosophical Transactions of the Royal Society B: Biological Sciences, Vol. 362, 2007, p. 1369-1391.
-
Hsu C. H., Shih W. C., Vu H. H. A fluid-structure coupling model for hemodynamics simulation of normal aortic valve. Journal of Vibroengineering, Vol. 17, Issue 3, 2015, p. 1518-1525.
-
Robicsek F., Thubrikar M. J., Cook J. W., Fowler B. The congenitally bicuspid aortic valve: how does it function? Why does it fail? The Annals of Thoracic Surgery, Vol. 77, 2004, p. 177-185.
-
Weinberg E. J., Kaazempur M. A multiscale computational comparison of the bicuspid and tricuspid aortic valves in relation to calcific aortic stenosis. Journal of Biomechanics, Vol. 41, 2008, p. 3482-3487.
-
Chandran K. B., Yoganathan A. P., Rittgers S. E. Biofluid Mechanics – The Human Circulation. Taylor & Francis Group, 2007.
-
De Hart J., Peters G. W. M., Schreurs P. J. G., Baaijens F. P. T. Collagen fibers reduce stresses and stabilize motion of aortic valve leaflets during systole. Journal of Biomechanics, Vol. 37, 2004, p. 303-311.
-
Grande-Allen K. J., Cochran R. P., Reinhall P. G., Kunzelman K. S. Finite element analysis of aortic valve-sparing: influence of graft shape and stiffness. IEEE Transactions on Biomedical Engineering, Vol. 48, Issue 6, 2001, p. 647-659.
-
Shibeshi S. S., Collins W. E. The rheology of blood flow in a branched arterial system. Journal of National Institutes of Health, Vol. 15, Issue 6, 2005, p. 398-405.
-
De Hart J., Peters G. W. M., Schreurs P. J. G., Baaijens F. P. T. Collagen fibers reduce stresses and stabilize motion of aortic valve leaflets during systole. Journal of Biomechanics, Vol. 37, 2004, p. 303-311.
-
De Hart J., Peters G. W. M., Schreurs P. J. G., Baaijens F. P. T. A three-dimensional computational analysis of fluid-structure interaction in the aortic valve. Journal of Biomechanics, Vol. 36, 2003, p. 103-112.
-
Dasi L. P., Simon H. A., Sucosky P., Yoganathan A. P. Fluid mechanics of artificial heart valves. Clinical and Experimental Pharmacology and Physiology, Vol. 36, Issue 4, 2009, p. 225-237.
-
Vu H. H. Numerical Study on Hemodynamics and Biomechanics in the Valve Diseases and Polyurethane Prosthetic Heart Valves. Ph.D. Dissertation, National Kaohsiung University of Applied Sciences, Kaohsiung, Taiwan, 2012.
-
Krishan B. Chandran, Ajit P. Yoganathan, Stanley E. Ritgers Biofluid Mechanics – The Human Circulation, Chapter 8. Taylor and Francis Group, LLC, 2007.
-
Yoganathan A. P., Woo Y. R., Hsing W. S. Turbulent shear stress measurements in the vicinity of aortic valve prostheses. Journal of Biomechanics, Vol. 19, 1986, p. 433-442.
About this article

