Abstract
Fault feature extraction and remaining useful life (RUL) prediction are important to condition based maintenance (CBM). In order to realize the fault feature extraction of gearbox vibration signal presenting nonlinear and non-Gaussian, the integration of empirical mode decomposition (EMD) and Wigner-Ville distribution (WVD) are proposed in this paper. Taking the kurtosis as standard, the WVD is applied to some IMFs with larger kurtosis to calculate the time-frequency distribution, with an effective suppress on mode mixing and the cross-term interference. Afterwards, particle filter (PF) with the state space model based on Wiener process is proposed to predict the RUL of gearbox considering degradation feature, gearbox teeth wear and nonlinear and non-Gaussian system. The gearbox life cycle test shows that the EMD-WVD method can extract the valued characteristics of vibration signal accurately, and the particle filter can provide an effective way to predict the RUL of gearbox.
1. Introduction
Gearbox is an important and common transmission component in the rotating machinery. Fault feature extraction and remaining useful life prediction of gearbox under variable conditions is a hot and relatively difficult topic. The vibration analysis techniques have been widely used in the detection of gear faults and the crux is how to extract the fault feature and predict the RUL from the vibration signals. The methods for early detection of faults in a gearbox have already been proposed with the condition monitoring of machinery [1].
EMD and WVD are widely used in the engineering [2-6]. They are especially suitable for processing the nonlinear and non-Gaussian vibration signals. However, they have their own limits; the analysis results are respectively influenced by mode mixing and cross-term interference. A variety of methods are proposed to reduce the mode mixing of EMD. For example, the vibration signals are pre-processed with the Support Vector Machines to suppress the interference of high-frequency intermittent components of EMD [7]. Nevertheless, these methods can only be used to restrain the mode mixing for special frequency. Hence, a novel method is needed to be proposed for mode mixing of EMD.
The Wigner-Ville distribution has been widely used in a variety of fields, such as the diagnosis of induction motors fed at constant frequency under variable speed transient conditions [8] and in an engine fault diagnosis system for feature extraction [9]. Although the potential of the WVD has long been recognized in engineering, its applications are limited mainly due to the cross-term interference [10]. These cross-terms mean that the distribution shows energy which does not actually exist at these particular time/frequency co-ordinates. Many methods have been developed to reduce the existence of cross-terms interference [11-14]. For example, a novel method based on signal decomposition and modified magnitude group delay function, in which vibration signal decomposition achieved by perfect reconstruction filter bank, is proposed to reduce the existence of cross-terms [15]. These methods can restrain the cross-term interference, but another function is introduced into the process of WVD, making the time-frequency distribution complex and different to calculate.
In this case, the integration of EMD and WVD is proposed, which can take the full use of the advantages of EMD and WVD to extract the fault feature of gearbox. Firstly, the EMD is used to obtain the IMFs of vibration signals. Additionally, after we obtain the IMF components, the WVD is applied to some IMFs with larger kurtosis to calculate the time-frequency distribution. Thus, the proposed method can restrain the frequency interference and mode mixing effectively to improve the effectiveness of vibration signal feature extraction.
Accurate prediction of the remaining useful life of the gearbox is important to the CBM of a rotating machinery system. Machine prognostic methods can roughly be categorized into two major classes: model-based and data-driven methods [16]. Among methods for performing prognostics such as support vector regression [17] and artificial neural networks, particle filters are emerging as a technique with considerable potential. Particle filtering is a Monte Carlo-based computational tool particularly useful for Bayesian-framed prognostics of nonlinear and/or non-Gaussian processes [18, 19]. Particle filter avoids making the simplifying assumptions of linearity and Gaussian noise typical of Kalman filtering (KF) [20], which has been proved very successful for non-linear and non-Gaussian estimation problems [21]. The approach has been used in many areas, including computer vision, target tracking, and robotics. The use of particle filters as a tool for prognostics has been increasing in recent years, and they have been applied to a range of applications, including Lithium-ion battery capacity depletion [22], rolling bearings [23] and gearbox plate crack growth prediction [24]. In addition, many new methods are proposed based on particle filtering. For example, a new prognostic method is developed using adaptive neuro-fuzzy inference systems (ANFISs) and high-order particle filtering [25]. In this paper, the integration of particle filter and the state space model based on Wiener process is proposed to predict the remaining useful life of gearbox considering degradation feature, gearbox teeth wear and nonlinear and non-Gaussian system. Finally, the results are compared with the Kalman filter.
The rest of this paper is organized as follows. The main EMD and WVD steps are discussed, as well as the method of fault feature extraction for gearbox based on the integration of EMD and WVD is proposed in Section 2. In Section 3, the particle filter method is presented, which will be used for remaining useful life prediction, and a simulated example is given. In Section 4, the life cycle test of gearbox is carried out. Then, the proposed methods are applied for fault feature extraction and remaining useful life prediction of gearbox. Finally, the conclusions are drawn in Section 5.
2. Fault feature extraction method for gearbox based on EMD-WVD
2.1. Short overview of EMD
The EMD is a widely-used time-frequency analysis method in the signal processing field, which mainly includes two steps. Firstly, the EMD is used to decompose nonlinear and non-Gaussian time series into a number of IMFs and a residual. Second, each IMF is Hilbert transformed to calculate the time-frequency distribution. The first step is the most important. It makes the original signal linear and stationary time series, as well as produces a series of data sequences with different characteristics, that each sequence is an IMF. The EMD method based on such assumptions: (1) the original signal has at least two extreme points, which are a maximum and a minimum, (2) the characteristic time scale is defined as a time interval between the local extreme value points, (3) if the original signal does not have an extreme point but there is an inflection point, the extreme point can be obtained by differential calculus once or more times, then the decomposed results will be get by integral calculus. Therefore, we can see that EMD is a self-adaptive signal processing method, which especially suits for the nonlinear and non-Gaussian signals.
The EMD algorithm exists in two stop conditions: one is aiming at the IMF, the repeating subtracting process will stop until the IMF satisfied the condition which is called component termination condition, the other one is the EMD decomposition termination condition for the original signal, which is namely decomposition termination condition. The EMD decomposition is terminated until the residual is less than the predetermined value or becomes a monotonic function, the EMD decomposition process is over.
The steps of EMD decomposition are shown as follows.
(1) Identify all the local minima and local maxima of the given signal .
(2) According to the local extrema of the signal, connect the local maxima and minima to construct the upper and lower envelopes and by a cubic spline interpolation.
(3) Calculate the mean of signal: .
(4) Obtain the new series: .
(5) If satisfies the two conditions, take it as the first IMF. Otherwise take as the original signal and the above processes are repeated until it satisfies the conditions of IMF.
(6) The residual is got after separating from the , until the final residue becomes a constant value, or is replaced by and the above process is repeated.
The signal can be decomposed into IMFs and a residual via EMD. The original signal can be finally expressed as:
In the process of EMD decomposition, components of different time scales can be found in the same one of the IMFs when decompose a complex signal directly, which is called as mode mixing. In simple terms, there is a rapid change time scale in the signal which makes the different mode composition not to be able being separated effectively according to the characteristic time scales. Then the same IMF contains multiple mode composition inside, so the original signal can’t be clearly reflected the intrinsic nature. And the reasons for this phenomenon has the relationship with the EMD algorithm, signal sampling rate and signal change in a certain time scale.
2.2. Short overview of WVD
Time-frequency distributions have been used extensively for nonlinear and non-Gaussian signal analysis. The Wigner-Ville distribution is the best known one for a time-frequency analysis. The Wigner-Ville distribution can be viewed as the signal energy time-frequency joint distribution, and is an important tool for analyzing nonlinear and non-Gaussian signal. The auto-Wigner-Ville distribution of continuous signal is defined as:
Accordingly, assumed another continuous signal , the cross-Wigner-Ville distribution of it is defined as:
where represents frequency, represents time variables. and are the complex conjugate of continuous signal and .
The disadvantages of Wigner-Ville distribution are the cross-term interference, which is caused by the time and frequency interference caused by nonlinear transformation. When the original signal contains multiple components, there will be no physical meaning of oscillation component at the midpoint of the time-frequency center coordinates between each of the two components in the Wigner-Ville distribution, which provides a false energy distribution and is affected by the physical interpretation of Wigner-Ville distribution. Take the signal as an example, the Wigner-Ville distribution is defined:
According to the definition of WVD, .
and is the conjugate, then:
This suggests that the WVD of two signals summed is not the sum of their each WVD, in addition to two auto-WVDs, there is a cross-WVD which is named as a cross-term interference. Because the cross-term interference is usually an oscillation, which amplitude can be reached twice as much the auto-WVD, which caused the time-frequency signal characteristics is blur.
2.3. The integration of EMD and WVD for gearbox fault feature extraction
The Wigner-Ville distribution can deal with nonlinear and non-Gaussian signals to get the time–frequency distribution, which is a powerful tool for signal processing. In order to reduce the effects of its cross-term interference, the WVD and EMD are combined together, as well as, this method can also reduce the mode mixing of EMD. Firstly, the original signal is decomposed into IMFs which frequency components are relatively single via EMD, then some IMFs that are selected according to the specific rules are processed by WVD. As we know, the original vibration signal can be decomposed into an IMF component by the EMD, and the IMF component signal frequency is single, so the WVD of the IMFs can restrain the frequency interference. Meanwhile, the Wigner-Ville distribution makes the different mode composition of IMF separated, resulting the mode mixing restrained effectively. Finally, the method can be used to improve the effectiveness of vibration signal feature extraction.
Based on this, a fault feature extraction method based on EMD-WVD is proposed in this paper to realize the nonlinear and non-Gaussian signal analysis, the steps are as follows:
(1) The original signal is decomposed via the EMD to get a set of IMFs which contains the different frequencies.
(2) Selecting the appropriate IMFs, they will be analyzed by WVD to get the signal , 1, 2,….
(3) The will be beaded together to get the Wigner-Ville distribution of signal, which is shown as .
During the signal processing, the WVD analysis was conducted for each of the IMFs, so in the final results the restraint for cross-term interference caused by the EMD method will still retain. Such the Wigner-Ville distribution of the superposition original signal can effectively characterize the characteristics in time and frequency domain.
The IMFs which are analyzed by WVD are selected according to kurtosis in this paper. The kurtosis is the degree of a signal waveform peak parameters, which is defined as:
where represents the standard deviation of signal , represents the mean of signal .
When the gearbox is in the normal state, the distribution of its monitored vibration signal can approximate to the normal one; at this moment, its kurtosis is approximately equal to 3. When the gearbox degenerates to a failure, the monitored vibration signal is no longer than the normal distribution because of an impact component of gearbox, which can lead to a bigger kurtosis. On the other hand, the degradation information of gearbox is often contained in the modulation signal of amplitude which with a more impact component. The vibration caused by the state degradation will cause the gearbox shaking at a different frequency, and each of the IMFs contains different natural vibration frequency caused by degradation. Therefore, the IMF is selected to get the fault feature of gearbox vibration signal according to the kurtosis criterion in this paper.
3. The remaining useful life prediction method for gearbox
3.1. Bayesian estimation for particle filter
Particle filter is a hybrid prediction method combined with date-driven and model-driven two kinds of methods. The particle filter employs Monte Carlo simulation of a state dynamic model and Bayesian estimation for estimating the posterior probability density function (PDF) of the state of a degrading component at future times. Therefore, the method is an effective tool to predict the remaining life of nonlinear and non-Gaussian systems.
The adaptive particle filtered Bayesian inference probability index is established for gearbox remaining life prediction in this paper. The state equation and measurement equation of particle filter are expressed as follows:
where is the hidden state to be estimated at time , is the observation at time , and represent the known process and observation functions respectively, and are the dimensions of the state and process noise.
When the initial PDF of the state is , in order to obtain the posterior probability density function of gearbox RUL, the state prediction is defined as:
The new observations are collected at time . According to the rule of Bayesian, the posterior probability density for system state is updating over time, so posterior probability distribution of the current state is obtained:
where the constant is .
Above is the prediction process and update process for Bayesian estimation of particle filter. However, the gearbox vibration signal is nonlinear and non-Gaussian, which makes it difficult to obtain the distribution. In this paper, we utilize Bayesian filtering and Monte Carlo algorithm to obtain the distribution.
Assuming that update monitoring information is known, the posterior probability density of system state can be expressed as follows:
where is the Dirac delta measure, is the posterior probability function, and is the priori probability function. If the real posterior probability function can be obtained, then Eq. (9) can be calculated according to Eq. (10):
where , 1, 2,..., are independent random samples sampling from .
are multi-type and non-standard, and it is difficult to get the results. Then importance function sampling method is proposed, which means the probability distribution and is the same, and the PDF distribution is known. Therefore, Eq. (10) can be transformed as follows:
where is the weight of the system states, , 1, 2,..., , which can be calculated by sampling. are likelihood value of observation sequence. In order to obtain the weight, we assume that and the probability distribution can be expressed as follows:
where:
The state distribution at time can be estimated according to the system state distribution . According to the theory of Bayesian filtering, can be expressed as follows:
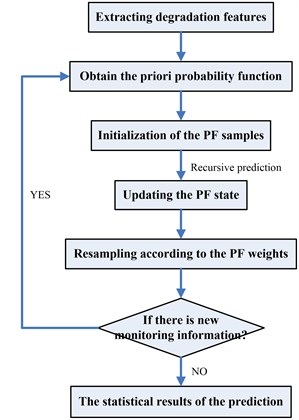
The implementation of the prediction algorithm based on PF is shown in Fig. 1.
Fig. 1The flowchart for the implementation of PF
3.2. Simulated signal analysis compared with KF
In this section, we take the KF as an example and compare the state estimation performance with particle filter, which prove that PF is more effective under the condition of nonlinear and non-Gaussian. A simulation test proposed with a discrete time adaptive noise of high-order non-linear state space model, and the function is expressed as follows:
where and obey the standard normal distribution. Simulation repeats 50 times to get 50 real value and observation value of simulation state. The process is repeated twice, and the results are shown in Fig. 2.
Fig. 2KF and PF simulation comparison
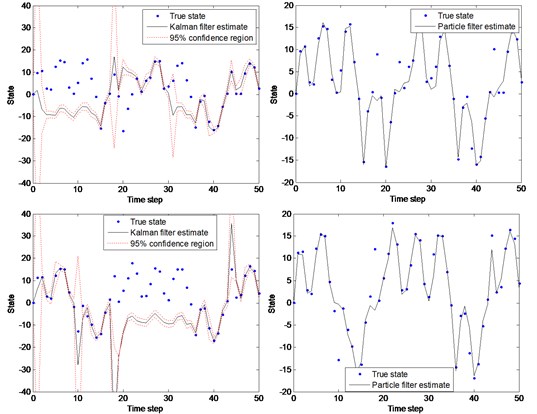
As shown in Fig. 2, KF state estimation results is bad, and has obvious deviation with the real data. On the other hand, PF has a higher precision, which indicates that PF has a better prediction performance for the nonlinear and non-Gaussian state space.
4. Case studies and discussion
The gearbox is widely used in the transmission system of mechanical equipment, and the mechanical equipment fault is caused by gearbox failure mostly. Therefore, taking the gearbox as an example, the methods of fault feature extraction based on the EMD-WVD and remaining useful life prediction based on PF proposed above are proven in this section.
4.1. The life cycle test of gearbox
The test object gearbox is shown in Fig. 3. The test bed is mainly composed of gearbox, speed and torque sensor (3056B4, produced by DYTRAN Company), magnetic powder electromotor (YCT180-4A), a load (FZJ-5) and other parts. Among them, the test bed is a steel platform (1500×600×700 mm) with a longitudinal slot; the output shaft axis of electromagnetic motor is parallel with the gearbox input shaft, where the power transfer is done through a coupling (6305). The gearbox output shaft is connected with the input shaft of the load through a coupling (6309). The vibration signal is acquired by the PXI-1031 case that produced by NI Company and PXI-4472B data acquisition card.
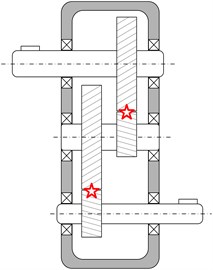
The most important part of the experiment is a secondary transmission gearbox, as shown in Fig. 4.
Fig. 3Image of test bed. (1 – load, 2, 3 – speed and torque sensor, 4 – electromotor, 5 – test bed, 6 – gearbox system)
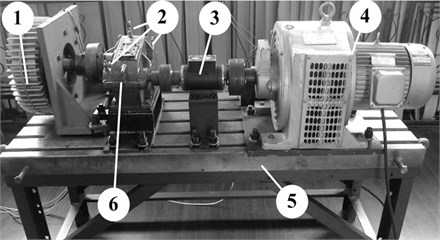
Fig. 4Gearbox structure sketch map
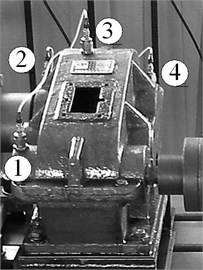
The maximum capacity for lubricant is 2, the rated speed is 1450 rpm, and rated transmission power is 0.75 kW. At particular parts of the gearbox there are four acceleration sensors numbered 1-4, the test load for gearbox is 2-2.5 times as much as the rated load. The signal is collected every five minutes with the sampling frequency for 20 kHz. The main parameters of the gearbox are shown in Table 1.
The life cycle test for gearbox is carried out; the vibration signal is acquired by four sensors. According to the monitoring vibration information, a failure of severe wear of the gear tooth surface occurs when the gearbox is working during about 400 hours, and the result is shown in Fig. 5. The incomplete data of worn-teeth is collected, which means that the wear condition is monitored only at some run time, the wear data obtained is shown in Table 2.
Fig. 5Comparison of gear after the experiment
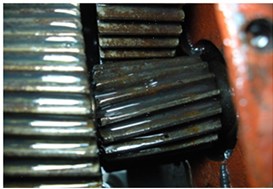
a) Gear before experiment
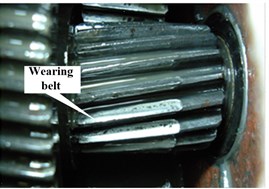
b) Gear after experiment
Table 1Prime parameters of gearbox
Name | First level transmission | Second level transmission | Transmission ratio | ||
High-speed shaft teeth number | Middle gear teeth number | Middle gear teeth number | Big gear teeth number | ||
35 | 64 | 18 | 81 | 8.23 | |
Table 2Gear teeth wear at different inspection points
Time (h) | 0 | 300 | 325 | 380 | 400 | 442 |
Gear teeth wear (mm) | 0 | 0.05 | 0.08 | 0.1 | 0.19 | 0.3 |
4.2. Fault feature extraction for gearbox vibration signal
First of all, a vibration signal of gearbox is analyzed, as the original vibration signal of channel 1 at a different monitoring time is shown in Fig. 6.
Fig. 6Original vibration signal of channel 1 at different monitoring time
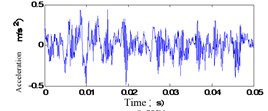
a) 1 h
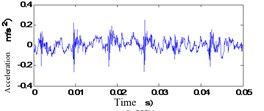
b) 100 h
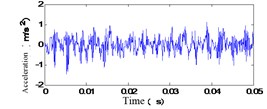
c) 200 h
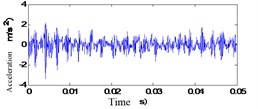
d) 300 h
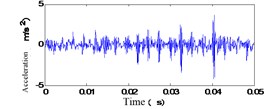
e) 400 h
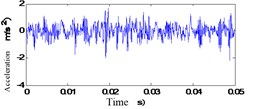
f) 442 h
However, the health status of gearbox can’t be directly identified by the time domain analysis. Thus, fault feature extraction of vibration signal based on EMD-WVD is proposed in this paper.
The vibration signal of the gearbox shown in Fig. 6 at a different monitoring time is decomposed by the EMD, and the IMFs and a residual are obtained, as shown in Fig. 7. - are the IMFs decomposed from the vibration signal of gearbox and is the residual.
The kurtosis of the IMFs - obtained by EMD is shown in Table 3. and , which have bigger kurtosis, are selected to be analyzed by the WVD. All the time-frequency distributions of different states are obtained, as shown in Fig. 8.
Fig. 7Gearbox vibration signal EMD results at t= 200 h
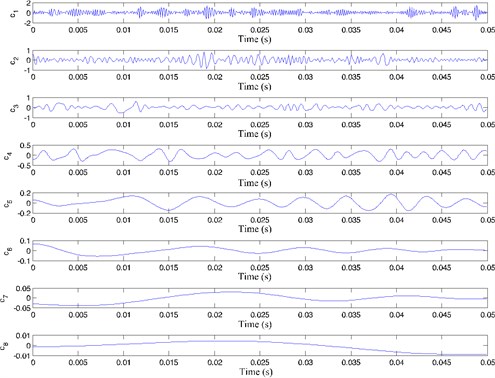
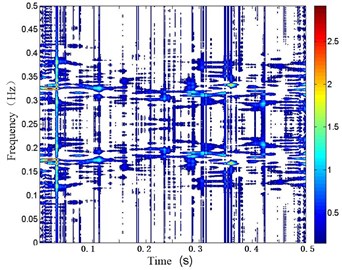
Fig. 8EMD-WVD results of channel 1 vibration signal at different condition time
a) 1 h
b) 100 h
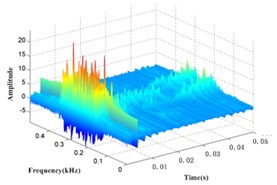
c) 200 h
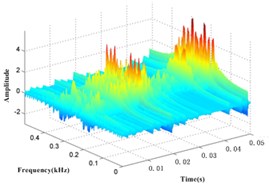
d) 300 h
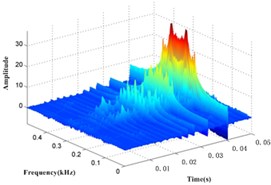
e) 400 h
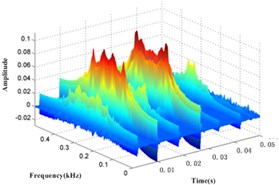
f) 442 h
It can be seen in Fig. 8 that the amplitude is increasing within 0.17 kHz to 0.37 kHz over time, so this frequency band is taken as a specific frequency band of gearbox, and the special frequency band energy collected from vibration signal is also taken as the health status value of gearbox.
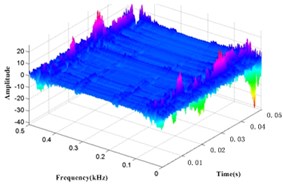
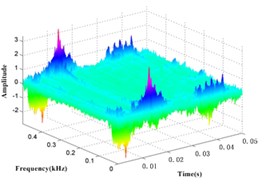
In order to confirm the effect of feature extraction for vibration signal of gearbox, taking the vibration signal of the gearbox under the normal state without EMD as an example, the original signal is analyzed via WVD directly. For comparison, the result of WVD is given according to the contour, as shown in Fig. 9.
As compared with Fig. 9(b) and Fig. 9(a), it can be seen that the energy concentration of Fig. 9(b) whose distribution is got from the signal obtained by EMD is more obvious than Fig. 9(a) whose distribution is got from the original signal in the time-frequency domain. This is mainly because the original vibration signal is decomposed into IMFs with a single frequency by EMD, so the signal WVD obtained by EMD can restrain frequency interference and mode mixing effectively.
Table 3IMF kurtosis of gearbox vibration signal at t= 200 h
IMF | ||||||||
4.524 | 4.035 | 3.774 | 1.832 | 2.030 | 2.740 | 2.1158 | 2.016 |
Fig. 9EMD-WVD comparison results of gearbox vibration signal at t= 200 h
a) WVD of the original signal
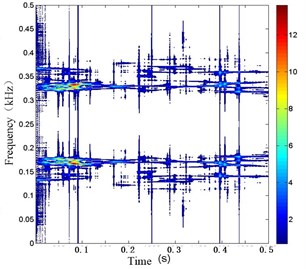
b) WVD of the signal obtained by EMD
Analyzing the result of Fig. 8, we can see that the amplitude of frequency band (0.71 kHz-0.37 kHz) is increasing with the gearbox working longer, the specific frequency band energy of the vibration signals is extracted based on energy analysis using wavelet packet as the special frequency band of gearbox, and the special frequency band energy of vibration signal is taking as the health status characteristic of gearbox, which is shown in Fig. 10.
Fig. 10Specific band energy of gearbox vibration signal
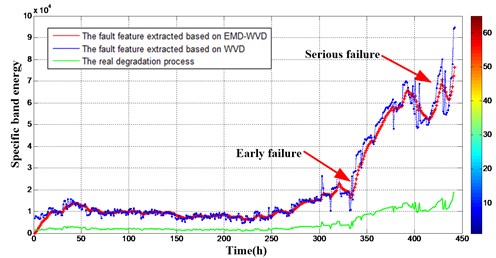
As we can see in Fig. 10, the green curve represents the real degradation process of gearbox, which is the wear of the gear tooth. The red curve and blue curve represent the fault feature extracted based on the EMD-WVD and fault feature extracted based on the WVD respectively. They all correspond with the degradation trend of gearbox, which demonstrates the accuracy of the methods. In addition, the fault feature based on the proposed method has a better stability compared with the fault feature based on the WVD, especially during the early failure and serious failure occurred. In the proposed method, some IMFs with larger kurtosis were selected, and the WVD was applied to these selected IMFs to attain the time-frequency distribution, so the noise, mode mixing and the cross-term interference were restrained. However, the WVD method can’t avoid the influence of these factors. Therefore, the proposed method has a better accuracy and effectiveness than the traditional method.
4.3. Gearbox remaining life prediction based on particle filter
The training samples for gearbox remaining useful life prediction based on particle filter are specific frequency band energy shown in Fig. 10 and gear teeth wear shown in Table 2. To describe the degradation process of gearbox, the state space model based on Wiener process (Wiener-SSM) is proposed, and gearbox remaining useful life is obtained based on the degradation process model. The state space model for the gear teeth wear is as follows:
where is the gearbox worn state, is the unknown parameters related to the state which can’t be observable, is extracted specific frequency band energy, noise and is Gaussian distributed. Eq. (15) is used to describe the gearbox worn over time, parameters updating during the prediction process and the relationship between the gearbox worn and the fault feature, respectively. Take gearbox teeth wear at 442 hours as the failure threshold, namely . Assuming that the initial model parameters are as follows: , , , , .
Taking the parameters estimation at 300 hours as an example, initial value and historical data are both iterative based on PF to get the best estimation for the gearbox state . Afterwards, all parameters of the state space model are calculated at 300 hours, as shown in Fig. 11.
Fig. 11The updated parameters at monitoring time 300 h
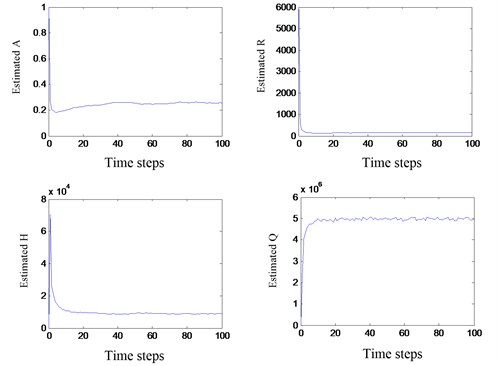
Model parameters are convergence to the optimum value quickly, which is the response of the gearbox SSM degradation trend, and will be used in the gearbox state feature prediction.
The parameters have randomness during the solving process, 1000 times repeated calculation is carried through to obtain the mean and standard deviation of parameters in this section, as shown in Table 4.
The probability density can be obtained based on the model parameters:
where is the posterior probability under the conditions of at time , and is the corresponding weight of particle . According to the Eq. (13), the estimated parameters are shown in Table 5.
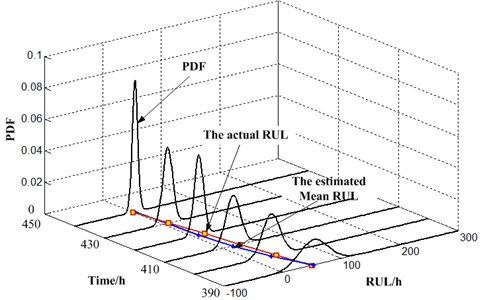
The probability density function of RUL and mean remaining life can be obtained based on the model parameters at different time, as shown in Fig. 12. The mean remaining life of gearbox is closer to the real remaining life with the increase of monitoring data. The variances of the probability density function are smaller over time, with more condition monitoring information is used, which means that the prediction results are more and more accurate.
Table 4Results of parameter estimation
Parameters | ||||
Mean | 0.2576 | 87.8 | 8913 | 2095 |
Standard deviation | 0.0039 | 0.610 | 357.4 | 53.9 |
Table 5Estimated parameters at different inspection time
Time (h) | ||||
325 | 0.7400 | 187.8 | 12722 | 2483 |
350 | 0.5323 | 141.4 | 12316 | 2432 |
375 | 0.4653 | 113.3 | 9947 | 2420 |
400 | 0.2576 | 87.8 | 8913 | 2221 |
Fig. 12Remaining useful life probability density function of gearbox
4.4. Performance evaluation
In order to evaluate the performance of remaining useful prediction based on PF, we take RMSE, MAE and VAE as indicators of absolute error, and take MARE and VRE as indicators of relative error. These indicators are shown as follows:
where is the real state, is the predicted state. The indicator is smaller means higher prediction precision.
The predicted results based on KF and PF are compared, as shown in Fig. 13, and the calculation results according to Eqs. (17-21) is shown in Table 6. The main conclusions are as follows. The RUL prediction method based on PF has a better precision and accuracy than based on KF. The prediction method based on PF considers degradation feature extracted from vibration signal, gearbox teeth wear and nonlinear and non-Gaussian system, which make it more suitable for gearbox remaining life prediction. However, the KP model is simple, and is easier to obtain the prediction results.
Fig. 13Comparison of two RUL prediction methods
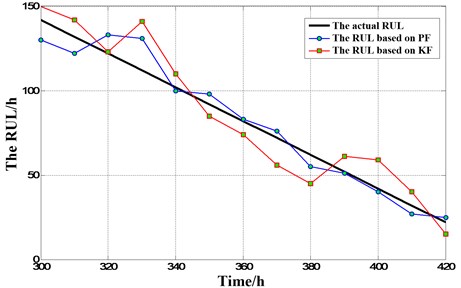
Table 6Performance evaluation results of RUL prediction
The model | Performance evaluation | ||||
RMSE | MAE | VAE | MARE | VRE | |
KF | 16.1169 | 35.5484 | 164.9626 | 0.4778 | 0.1024 |
PF | 10.8169 | 20.2750 | 56.9469 | 0.2533 | 0.0205 |
5. Conclusions
This paper proposes the fault feature extraction and remaining useful life prediction methods for the gearbox under the condition of nonlinear and non-Gaussian states. Firstly, the vibration signal of gearbox is decomposed into a set of IMFs by EMD. Then the time-frequency features can be obtained via the Wigner-Ville distribution, to achieve the purpose of fault feature extraction for gearbox. Afterwards, the RUL is obtained based on PF considering degradation feature, gearbox teeth wear and nonlinear and non-Gaussian system. The main findings are as follows.
1) The signal processing method based on EMD-WVD can suppress the influence of mode mixing and cross-term interference, which has a better effect for the time-frequency analysis of the nonlinear and non-Gaussian vibration signals. So, the proposed method can effectively extract the fault characteristics of the gearbox.
2) The remaining useful life prediction based on PF and state space model based on Wiener process considers degradation feature, gearbox teeth wear and nonlinear and non-Gaussian system, which can make full use of all the monitoring information. Therefore, the method is suitable for gearbox remaining useful life prediction and can be used for stochastic degradation systems.
3) The life cycle test of gearbox demonstrates the accuracy and effectiveness of fault feature extraction method based on EMD-WVD and remaining useful life prediction method based on PF in the engineering application.
References
-
Baydar N., Ball A. Case study detection of gear failures via vibration and acoustic signals using wavelet transform. Mechanical Systems and Signal Processing, Vol. 17, Issue 4, 2003, p. 787-804.
-
Xiuzhong Xu, Zhiyi Zhang, Hongxing Hua, et al. Time-varying modal parameter identification with time-frequency analysis methods. Journal of Shanghai Jiaotong University, Vol. 37, Issue 1, 2003, p. 122-126.
-
Changhang Xu, Jifei Liu, Guoming Chen, et al. Application of EMD and WVD to feature extraction from vibration signal of reciprocating pump valves. Journal of China University of Petroleum, Vol. 34, Issue 3, 2010, p. 99-103.
-
Zhengjia He, Jin Chen, Taiyong Wang, et al. Theories and Applications of Machinery Fault Diagnostics. Fourth Edition, Higher Education Press, Beijing, 2010.
-
Farook Sattar, Goran Salomonsson The use of a filterbank and the Wigner-Ville distribution for time-frequency representation. IEEE Transactions Signal Process, Vol. 47, Issue 6, 1999, p. 1776-1783.
-
Cong Wang, Meng Gan, Chang’an Zhu Non-negative EMD manifold for feature extraction in machinery fault diagnosis. Measurement, Vol. 70, 2015, p. 188-202.
-
Xiaofeng Liu, Lin Bo, Honglin Luo Bearing faults diagnostics based on hybrid LS-SVM and EMD method. Measurement, Vol. 59, 2015, p. 145-166.
-
Changhang Xu, Jifei Liu, Guoming Chen, et al. Application of EMD and WVD to feature extraction from vibration signal of reciprocating pump valves. Journal of China University of Petroleum, Vol. 34, Issue 3, 2010, p. 99-103.
-
JianDa Wu, ChengKai Huang An engine fault diagnosis system using intake manifold pressure signal and Wigner-Ville distribution technique. Expert Systems with Applications, Vol. 38, 2011, p. 536-544.
-
Ghofrani S., Mclernon D. C. Auto-Wigner-Ville distribution via non-adaptive and adaptive signal decomposition. Signal Processing, Vol. 89, 2009, p. 1540-1549.
-
Chen G., Chen J., Dong G. M. Chirplet Wigner-Ville distribution for time-frequency representation and its application. Mechanical Systems and Signal Processing, Vol. 41, 2013, p. 1-13.
-
Ram Bilas Pachori, Anurag Nishad Cross-terms reduction in the Wigner-Ville distribution using tunable-Q wavelet transform. Signal Processing, Vol. 120, 2016, p. 288-304.
-
Hai B. Huang, Ren X. Li, Xiao R. Huang, et al. Sound quality evaluation of vehicle suspension shock absorber rattling noise based on the Wigner-Ville distribution. Applied Acoustics, Vol. 100, 2015, p. 18-25.
-
Wei Zeng, Haitao Wang, Guiyun Tian, et al. Application of laser ultrasound imaging technology in the frequency domain based on Wigner-Wille algorithm for detecting defect. Optics and Laser Technology, Vol. 74, 2015, p. 72-78.
-
Narasimhana S. V., Malini Nayakb B. Improved Wigner-Ville distribution performance by signal decomposition and modified group delay. Signal Processing, Vol. 83, 2003, p. 2523-2538.
-
Jardine A. K. S., Lin D., Banjevic D. A review on machinery diagnostics and prognostics implementing condition-based maintenance. Mechanical Systems and Signal Processing, Vol. 20, 2006, p. 1483-1510.
-
Muhammad Farrukh Yaqub, Iqbal Gondal, Joarder Kamruzzaman Multi-step support vector regression and optimally parameterized wavelet packettransform for machine residual life preciction. Journal of Vibration and Control, Vol. 19, Issue 7, 2012, p. 963-974.
-
Arulampalam Ms., Maskell S., Gordon N., et al. A tutorial on particle filters for online nonlinear/non-Gaussian Bayesian tracking. IEEE Transactions on Signal Processing, Vol. 50, 2002, p. 174-188.
-
Doucet A., Godsill S., Andreu C. On sequential Monte Carlo sampling methods for Bayesian filtering. Statistics and Computing, Vol. 10, 2000, p. 197-208.
-
Shane Butler, John Ringwood Particle filters for remaining useful life estimation of abatement equipment used in semiconductor manufacturing. Conference on Control and Fault Tolerant Systems Nice, France, 2010, p. 436-441.
-
Katja Nummiaroa, Esther Koller-Meierb, Luc Van Goola An adaptive color-based particle filter. Image and Vision Computing, Vol. 21, 2003, p. 99-110.
-
Saha B., Goebel K., Poll S., et al. Prognostics methods for battery health monitoring using a Bayesian framework. IEEE Transactions on Instrumentation and Measurement, Vol. 58, Issue 2, 2009, p. 291-296.
-
Bin Fan, Lei Hu, Niaoqing Hu Remaining useful life prediction of rolling bearings by the particle filter method based on degradation Tate tracking. Journal of Vibroengineering, Vol. 17, Issue 2, 2015, p. 743-756.
-
Orchard M. A Particle Filtering-Based Framework for On-Line Fault Diagnosis and Failure Prognosis. Ph.D. Dissertation, Georgia Institute of Technology, 2007.
-
Chaochao Chen, Bin Zhang, George Vachtsevanos, et al. Machine condition prediction based on adaptive neuro-fuzzy and high-order particle filtering. IEEE Transactions on Industrial Electronics, Vol. 58, Issue 9, 2011, p. 4353-4364.
Cited by
About this article

The research is supported by the National Natural Science Foundation of China (No. 71401173) and the authors are grateful to all the reviewers and the editor for their valuable comments.
