Abstract
This study proposes a spectral-amplitude-coding optical code-division multiple-access (SAC-OCDMA) framework for accessing the vibration frequency of a test object by using a Michelson interferometer vibration sensor (MIVS). Each sensor node possesses an individual signature codeword, and liquid crystal spatial light modulator (LC-SLM) encoders/decoders (codecs) are adopted to provide excellent orthogonal properties in the frequency domain. The proposed LC-SLM-based OCDMA system mitigates multiple access interference among all sensor nodes. When optical beams strike and are reflected by the object, the sensing interferometer becomes sensitive to external physical parameters such as temperature, strain, and vibration. The MIVS includes a Michelson interferometer placed at a specific distance from the test object on a designed vibration platform. A balanced photodetector (BPD) was used to convert the light output of the LC-SLM decoders into electrical signals, and a digitizing oscilloscope was used to Fourier transform the BPD electrical signal output, thereby yielding the vibration frequency of the test object. The results showed that the proposed sensor network with an interferometer can be used as a distributed highly sensitive sensor to obtain mechanical values. This study provides a new optical sensor network for current vibration frequency measurements.
1. Introduction
In recent years, optic sensor technologies have developed rapidly, and because of advances in optical communication technology, data can be transmitted anywhere with low distortion. Using optical fibers, information can be transmitted without using conventional wired or wireless networks, which are susceptible to electromagnetic interference and only applicable to single-point simplex measurements. A high-density residential area has many buildings. With fiber-to-the-home (FTTH) technology, every building unit can have a high bandwidth connection. Optical transceiver modules are indispensable for transmitting data in the FTTH architecture. In this study, we converted optical signals to electrical signals using Michelson interferometer vibration sensors (MIVSs), and a warning can quickly be issued when the fibers are deformed because of external environmental factors, such as earthquakes and strong winds.
Conventional structural sensors, such as strain gauges [1], air sensor system [2], accelerometers, and optical fiber sensors, have been widely used for measuring physical parameters, such as rotation, acceleration, electromagnetic fields, temperature, pressure, sound, vibration, and humidity. In principle, these methods are contact techniques requiring direct contact with the sample, which limits their practical applicability. In optical fiber sensors, the self-weight of the sensors changes the modal parameters, such as the frequency and modal shape of the structure of interest, which affects the measurement accuracy. A plastic card or tube is used to bend the optical fiber and construct a fiber loop sensor in optical code-division multiple-access (OCDMA) sensor network is presented [3].
Vibration and deformation have been accurately measured by using noncontact optical interferometry, wherein vibration and deformation displacements are calculated using phase changes in the interferometry patterns. In addition, optical interferometry allows light signal transmission, which enables multiplex measurements from multiple points by combining various multiplex network frameworks, such as wavelength division multiplexing (WDM), time division multiplexing, frequency division multiplexing, and OCDMA [4-8].
Optical interferometer sensors (OISs) can be integrated with multiplex techniques to achieve distributed sensing and reduce complexity of multiple-point measurement systems. OISs are widely used in remote sensing such parameters as strain, temperature, and pressure. Among the various multiplexing techniques, WDM is the most commonly used and is a simple technique for identifying multiple OISs. The other study [9] discussed about intensity modulated fiber vibrations sensing using Khazani Syed (KS) and Modified Quadratic Congruence Code (MQC) code for quasi distributed vibration measurement have been evaluated.
This study primarily used a liquid crystal spatial light modulator (LC-SLM) to construct an OCDMA system. Light modulation with LCs is accomplished by applying an electric field across an LC layer. The refraction index of light propagating through an anisotropic LC material is a function of the applied voltage. Placing an LC material between two polarizers leads to intensity and phase modulation of the incident light beam [10, 11]. LC optical modulators offer several advantages, including high modulation depth, low power dissipation, high large aperture operation potential, and low cost. Thus, in addition to increasing spectral efficiency, LC optical modulation utilizes the high confidentiality characteristic of spectral-amplitude-coding (SAC)-OCDMA technology to increase system confidentiality.
SAC encoding can be used by multiple active users because of its characteristic of eliminating interference and preventing phase-induced intensity noise during photodetection. By integrating a distributed vibration sensing system with a sensor and an encoding/decoding device, the excellent characteristics of SAC encoding can be used for multiple-point multiplex measurements [12]. For vibration sensing, this paper proposes using optical interferometry to replace fiber vibration sensors containing two optical collimators. This improvement transforms the entire sensor framework into an economical, simple, and flexible optical sensor design, facilitating various vibration measurements.
This study proposes an SAC-OCDMA framework to access the vibration frequency of a test object on a MIVS. Each sensor node possesses an individual signature codeword, and LC-SLM encoders/decoders (codecs) were used, providing excellent orthogonal properties in the frequency domain. The proposed LC-SLM-based OCDMA system mitigates multiple access interference (MAI) among all sensor nodes. When optical beams strike and reflect from the object, the sensing interferometer becomes sensitive to external physical parameters, such as temperature, strain, and vibration. The results showed that the proposed sensor network with an interferometer can be used as a distributed highly sensitive sensor to obtain mechanical values. This study provides a new sensor network for current vibration frequency measurements.
2. Theories and principles
2.1. Michelson interferometer vibration sensor
In this section, the principle of the Michelson interferometer-based vibration sensor system is described. The Michelson interferometer is commonly used in optical interferometry. Using a beam splitter (BS), a light source is split into two arms, each of which is reflected back toward the BS, which interferometrically combines their amplitudes. The resulting interference pattern is not directed back to the source but is typically directed to such devices as a photoelectric detector or camera. Depending on the application, the two arms may be of different lengths or include optical materials and components under test. Recent studies have focused on theories regarding sensitivity of changes in interference fringes. When one of the arms displaces an object under test, the Michelson interferometer can be used for sensing.
An optical interferometer measures physical distances directly in terms of wavelengths of light by counting interference fringes that move when one of the two objects is displaced [13]. Michelson interferometer sensors measure the vibration frequency of mechanical equipment; first risk is low because these sensors require minimum optical power. In addition, Michelson interferometer sensors can measure high- and low-frequency vibrations and detect shifts in the millimeter range.
Fig. 1Structure of the Michelson interferometer-based vibration sensor
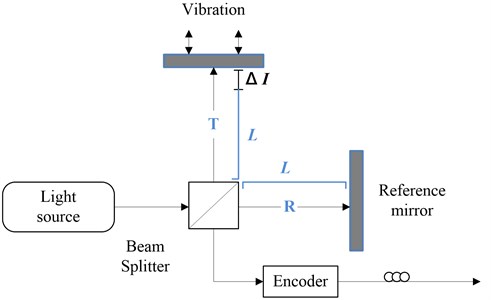
The beams must be mutually coherent and have a definite phase relationship for fringes to be visible. Fig. 1 illustrates the structure of a Michelson interferometer-based vibration sensor. Here, mutual coherence is obtained by splitting light originating from a single source with a partially reflecting mirror (BS). The reflected () and transmitted () waves are redirected by ordinary mirrors to the output, where they are superposed to form fringes. This process is known as interference by division of amplitude.
To calculate fringe spacing [14], assume that the origin of the coordinates is at the center of the reference mirror. Waves are reflected normally by the reference mirror (Wave 1) and at an angle to the -axis by the vibrating object (Wave 2). The resulting plane waves are expressed as follows:
where is the difference between the mirror-BS and object-BS distances, and and denote the propagation constant and the angle of the object surface to the -axis, respectively. The resultant electric field in the region where the two beams overlap is expressed as follows:
The intensity is given by the following equation:
Therefore, for fixed , fringes at intervals are given by:
When the vibrating object is moved in a direction normal to its face, the fringe pattern moves as changes. The number, , of the fringes that cross the center of the screen when the object surface moves a distance is:
Consider a point on a circular fringe. The optical path difference at is , where represents the distance between the light source and the fringe. P lies on a bright fringe if ( order of the fringe).
When the sample object is vibrating, the interference fringes change simultaneously with the movement of the object surface. The spectral interferogram of a vibrating sample is expressed as follows:
2.2. SAC-OCDMA sensor network
An SAC-OCDMA system assigns a unique spectral amplitude codeword, a binary message bit of zeros and ones, to each network user for coding the amplitude of the light source spectrum.
Walsh-Hadamard codes are used as a (+1, −1) sequence in radio-frequency domains. However, these codes are commonly found in practical direct spread systems in OCDMA systems [15]. Because of the specific characteristic described in the following sections, this code can be applied to an SAC system to eliminate MAI. A Walsh-Hadamard code, also referred to as Walsh code or Hadamard code, is obtained by selecting a row of the Walsh-Hadamard matrix (, where ), except the first row of the matrix, which has all 1 s. Each row, except the first row, contains /2 zeros and /2 ones. An Walsh-Hadamard matrix is generated recursively as follows:
For an Walsh-Hadamard matrix, there exist Walsh-Hadamard code sequences. The auto-correlation value is /2, and the cross-correlation value between different twos is /4. Let the th row of , expressed as , be (0, 1) sequences of length ; the th row of is assigned as the unique codeword of user # where . 0 is deducted because codewords containing all 1 s cannot be used for coding and decoding.
Fig. 2The OCDMA-based Michelson interferometer vibration sensor system
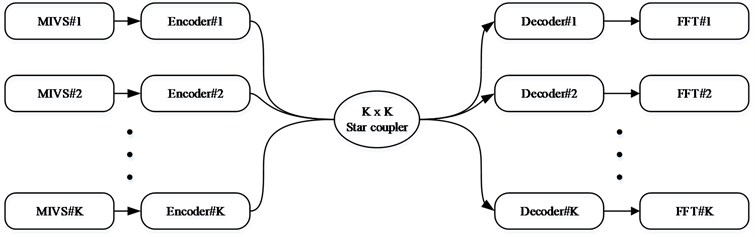
This study used LC-SLMs as codec elements with Walsh-Hadamard code in the OCDMA system, with the MIVS placed ahead of the LC-SLM encoder (Fig. 2). This framework comprises a red light laser, a star coupler, LC-SLM encoders, and LC-SLM decoders. The sensed vibration signals of Eq. (7) and then input into LC-SLM based OCDMA system.
Various grating wavelengths were used for encoding, and the MIVS was used to modulate the reflected spectral intensity. In addition, a matrix pattern was used for coding. Each 4×4 chip is one bit, with a 16-bit bipolar code composed of an 8-bit unipolar code and its complex conjugate [16]. The message bit passed through each transmitting end entered the star coupler. The star coupler accumulates and transmits all message bits from the transmitting ends to each receiving end. The receiving ends use LC-SLM decoders to access the message bits of the correct encoder. The spectrometer uses the interference vibration sensor to facilitate light intensity variations in grating wavelengths, which are converted to photoelectrical signals by a balanced photodetector (BPD). A digitizing oscilloscope (DOS) subsequently presented the frequency of each LC-SLM encoder.
Fig. 3 shows the encoder/decoder setup to code a signal into spectral bipolar codes and vice versa. The 632-nm red laser source output beam is amplified through a collimator and diffracted by the matrix diffraction grating. The diffracted beam is collimated by a lens, and the collimated beam passes through the LC-SLM, that is, between the two crossed polarizers (Polarizer 1 and Polarizer 2). The pixelated LC elements are designed such that each wavelength channel is driven independently. The coded channels are focused by the output lens, recombined by the output grating into a single beam, and coupled with an output fiber by the collimator.
Fig. 3LC-SLM-based encoder/decoder
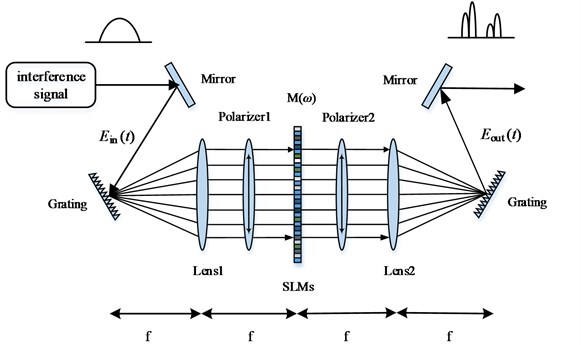
By adjusting the polarization directions of Polarizers 1 and 2 and the holding voltage of the SLM, which determines the LC phase delay. The modulated spectrum power can be flattened using the driving voltages applied on individual pixels of the SLM.
The SAC codeword for MIVS # is , and is set as the light intensity variation after the spectrum is modulated through the MIVS by the vibration source; thus, the following equation is inferred:
where is the SAC codeword for MIVS # under the interference of the vibration source, that is, the spectral light intensity change caused by the influence of the vibration signal on the encoded spectrum.
The polarization of the code is 0° to the axis of the encoder, and the transmitted light of the encoder containing two orthogonal components, 0° and 90°, from the decoder axis produces signals proportional to and , respectively. Subsequently, the beam is focused by the lens and diffracted by the grating into collimated beams. A polarization BS (PBS) then separates the two signals proportional to and into two beams. When a balanced detection scheme is used, the photocurrents are subtracted from each other.
The periodic correlation between and is defined as follows:
Let be the complement of . Thus, the periodic correlation between and is expressed as follows:
If the code family has the property for we compute to reject the MAI influence from other MIVSs. A BPD is often used to realize this computation in SAC-OCDMA systems. For Walsh-Hadamard code, the code properties are written as:
Therefore, a BPD for MIVS # implements Eq. (14) and the MAI from other users is completely cancelled:
where /2 represents the decoded energy of the BPD for the matching signal output when ; 0 indicates zero decoded energy output of the BPD for the mismatched signals.
When Eq. (14) is modulated by the optical power of the MIVS, the decoded energy of the upper and lower arms of the BPD are inferred as:
When optical powers and pass through the decoder and enter the BPD, the BPD conducts a correlation operation during decoding. When the decoder address and encoded signal match, a light intensity variation /2 for the code is created through modulation, and when the decoder address and encoded signal mismatch, the BPD yields no light intensity output.
3. Experimental framework and results
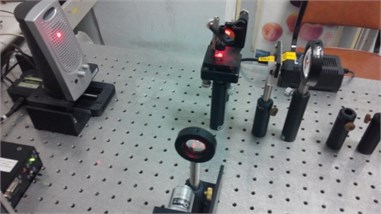
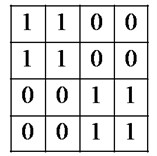
The objective of this experiment is to use LC-SLM-based OCDMA technique [16] to access the vibration frequency of the of the Loud Speaker (sensed by the MIVS). Fig. 4 shows the real setup of our experimental platform for encoding series of transmitting data bits over a Michelson Interferometer-based vibration sensor of OCDMA sensor network system. The 632 nm red laser source output beam is amplified via a beam splitter and split into two beams, then two reflected beam interfered each other as shown in Fig. 1. The distance between the mirror to the beam splitter and the object to the beam splitter are 53.3 mm and 277.5 mm, respectively. In our experiments, the red laser light source within transmitter is diffracted by a grating polarizer set at 0°, so the phase of each diffracted wavelength is in 0°. The LC-SLM for transmitter encoders is set at Walsh codes {1001 1001 0110 0110} and {1100 1100 0110 0110} while that for receiver decoder LC-SLM is programmed into either or . When passing through LC-SLM, the light phase remains at 0° if the received code chip is “1”, but the light phase will change to 90° if the received code chip is “0”. After the light passes through the second polarizer set at 0°, only light signal with phase 0° can pass through such polarizer and launch into the fiber.
The MIVS was placed before the diffraction grating of the LC-SLM encoder and multiple lens array, and the loudspeaker was directly placed on the sensing arm of the various MIVSs as shown in Fig. 4(a). A controller was then used to input different frequencies into the sensing arm of the sensor. After light intensity for the interfering spectrum, which was outputted by the LC-SLM encoder as shown in Fig. 4(b), was modulated by the MIVS, the modulated interfered vibration signal was outputted and transmitted to the LC-SLM decoder (the structure is the same as encoders). A BPD was employed in this study to convert the light output of the LC-SLM decoder into an electrical signal, and a digitizing oscilloscope (DOS) was employed to conduct a Fast Fourier transform on the BPD electrical signal output, thereby acquiring the vibration frequency of the sample object.
Fig. 4Structure of a) Michelson Interferometer-based vibration sensor; b) LC-SLM encoder
a)
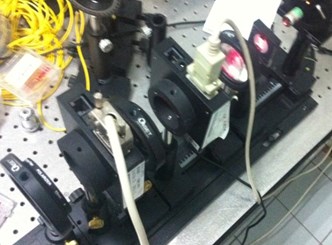
b)
There are two cases of experiment setups in the study, first case is matched codeword condition (i.e., encoder signature codeword of transmitter is and decoder signature coeword of receiver is ) and second case is unmatched codeword condition is presented to verify the MAI can be canceled by BPD (i.e., encoder signature codeword of transmitter is and decoder signature codeword of receiver is ).
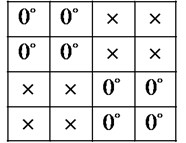
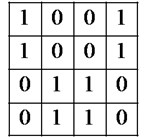
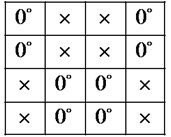
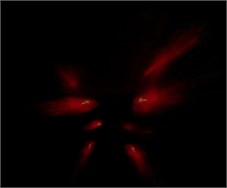
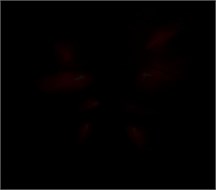
The Figs. 5(a) and 6(a) are LC-SLM programmed pattern, {1100 1100 0011 0011} and {1100 1100 0110 0110}. And Figs. 5(b) and 6(b) are the sensed light signal passing through the LC-SLM, if the chip is 1, the light phase shift is 0°; if the chip is 0, LC-SLM changes the light phase to 90°. When the light passes through the second polarizer (set to 0°), only the signal with phase 0° can pass through polarizer and launch into the fiber. The light dots pattern of signature codewords and after sends vibration signals are shown in Figs. 7(a) and 7(b), respectively.
Fig. 5Polarization pattern at encoder (Transmitter set at signature codeword J)
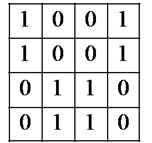
a) Code pattern
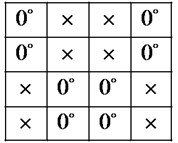
b) Phase changes of the light after LC-SLM encoder
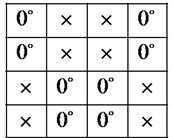
Fig. 6Polarization pattern at encoder (Transmitter set at signature codeword K)
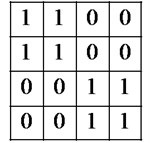
a) Code pattern
b) Phase changes of the light after LC-SLM encoder
Fig. 7Coded light dots pattern of sensed signal
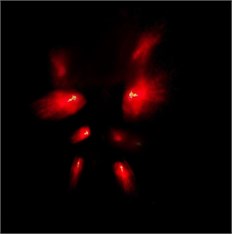
a) For encoder signal
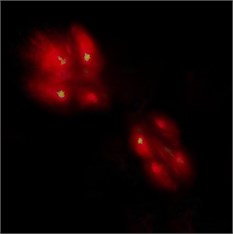
b) For encoder signal
Fig. 8Matched transceiver codes pattern at decoder (i.e., for encoder transmits J while decoder set at J
a) Received signal in the receiver
b) LC-SLM programmed pattern of
c) The decoder result
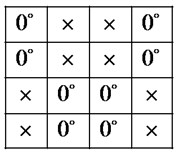
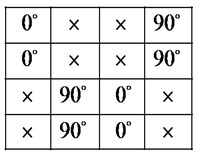
Fig. 8 shows the phase pattern at receiver decoder when transmitter LC-SLM codeword matches receiver LC-SLM (both LC-SLM in the transceiver coder and receiver decoder are set at the same signature code ). In the decoder, Fig. 8(a) shows the received signal from fiber in the receiver. Fig. 8(b) is LC-SLM programmed pattern of {1001 1001 0110 0110}. After LC-SLM, the phase remains constant if the received chip is logic “1”; and the phase shifts to 90° if the received chip is logic “0”. The decoder result is as shown in Fig. 8(c).
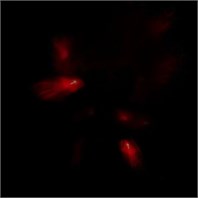
Corresponding to Fig. 8, Fig. 9 depicts the Walsh-Hadamard-coded sensed light signal dots pattern for the matched transceiver pair of transmitter LC-SLM matches receiver LC-SLM, both set at the same signature code . Fig. 9(a) is in a phase of 0°, corresponding to the in-phase correlations of . Fig. 9(b) is in a phase of 90°, corresponding to the quadrature correlations of .
Fig. 9Coded light signal dots for matched encoder and decoder for encoder transmits J while decoder set at J
a) In a phase of 0°
b) In a phase of 90°
In this matched codec condition, the sample vibration is excited by a loud speaker successfully. Fig. 10 shows the Fourier transform of the measured surface displacement. We drive the loud speaker with a complex signal. And vibration frequencies of 700, and 1.1 k Hz were detected from LC-SLM decoder. For the multiple-frequency vibration, the plot of the peak position of the FFT waveform is shown in Fig. 10. The red arrows in Figs. 10 and 13 show the reference coordinates of each measured lines and the blue arrows show the maximum FFT values after decoded vibration signals.
Fig. 10Decoding results for inputting a vibration signal
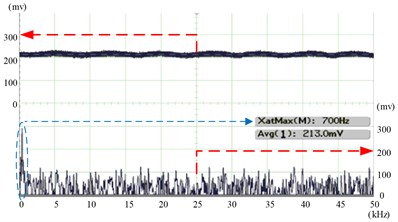
a) Detected for 700 Hz
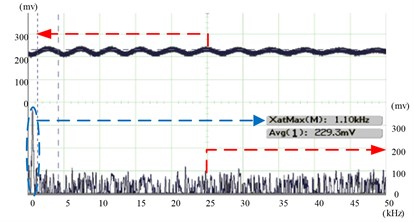
b) Detected for 1.1 kHz
Fig. 11Unmatched transceiver codes pattern at decoder (i.e., for encoder transmits J while decoder set at K)
a) Received signal in the receiver
b) LC-SLM programmed pattern of K
c) The decoder result
Fig. 11 shows the phase pattern at receiver decoder when the transmitter LC-SLM is unmatched to the receiver LC-SLM (signature set in transmitter and signature set in receiver). Fig. 11(a) shows the received signal from fiber into the receiver. Fig. 11(b) is LC-SLM programmed pattern of {1100, 1100, 0011, 0011}. After LC-SLM, if the received chip is “1”, the phase remains constant; the phase shifts to 90° while the received chip is “0”. The decoder result is as shown in Fig. 11(c).
Corresponding to Fig. 11, Fig. 12 depicts the Walsh-Hadamard-coded sensed light signal dots pattern for the unmatched encoder LC-SLM and decoder LC-SLM. In this case, the transmitter encoders LC-SLM are respectively set at codes while receiver decoder LC-SLM set at signature . Fig. 12(a) is in a phase of 0°, corresponding to the in-phase correlations of . Fig. 12(b) is in a phase of 90°, corresponding to the quadrature correlations of .
Fig. 12Coded light dots pattern for unmatched for encoder transmits J while decoder set at K
a) In a phase of 0°
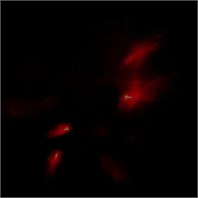
b) In a phase of 90°
When a balanced detection scheme is used, the upper/lower photo-currents are subtracted from each other, and resulting an output level proportional to the bipolar correlations zero. In unmatched codeword condition, it shows the results when transmitter LC-SLM unmatched codeword to receiver LC-SLM. The upper/lower photo-currents are subtracted from each other, and resulting an output level proportional to the bipolar correlations zero. As the results, there is no signal to input into the DOS, and the vibration frequency cannot be detected as shown in Fig. 13.
Fig. 13Decoding result when the code pattern is unmatched
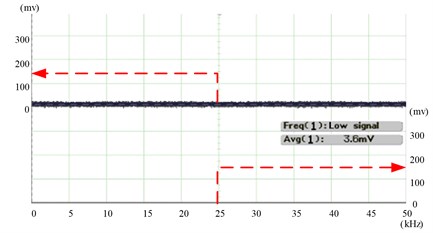
The experimental results indicated that a corresponding frequency peak value was observed in the FFT spectrogram recorded by the DOS. Although interference from other encoders was conspicuous in the FFT spectrograms, the existence of an input frequency from other LC-SLM encoders possessing a level approximate to that of noise (i.e., low signal which means law level amplitude signal output and has no FFT waveform output) was verified. This did not affect the vibration frequency required for access. Thus, the experimental results proved that the experimental settings and arrangement effectively eliminates MAI from other LC-SLM encoders.
4. Conclusions
Due to the rapid development of optical communication technology, data can be transmitted with low distortion to anywhere. By using the optical fiber, the information can be transmitted without the general wired or wireless communications subjected to electromagnetic interference (EMI). We reported the application of a Michelson interferometer-based vibration sensor system in vibration engineering. The developed sensor system quantitatively characterizes vibrations with a frequency up to 1.5 kHz. This sensor is an ideal replacement for conventional electric and mechanical sensors. In this study, an integrated SAC-OCDMA and MIVS was used for multiplex measurements at multiple points. The number of MIVSs increased with code length, thus supporting more MIVSs and rendering the design more flexible.
The experimental results indicated that various LC-SLM decoders were capable of correctly accessing the vibration frequency of the corresponding LC-SLM encoder sensor without experiencing MAI from other MIVS sensor signal. Once an earthquake or strong winds struck the building covered by object deformation due to external environmental factors caused; we can quickly get the warning. Therefore, the proposed LC-SLM-based OCDMA sensor network is highly suitable for developing a sensor network.
References
-
Cheng H. C., Wu C. H., Yang C. C., Chang Y. T. Wavelength division multiplexing/spectral amplitude coding applications in fiber vibration sensor systems. IEEE Sensors Journal, Vol. 11, Issue 10, 2011, p. 2518-2526.
-
M. Udin Harun Al Rasyid, Isbat Uzzin Nadhori, Amang Sudarsono, Yodhista Tulus Alnovinda Pollution monitoring system using gas sensor based on wireless sensor network. International Journal of Engineering and Technology Innovation, Vol. 6, Issue 1, 2016, p. 79-91.
-
Tseng S. P., Yen C. T., Syu R. S., Cheng H. C. Employing optical code division multiple access technology in the all fiber loop vibration sensor system. Optical Fiber Technology, Vol. 19, Issue 6, 2013, p. 627-637.
-
Liang T., Lin Y. Ground vibrations detection with fiber optic sensor. Optics Communications, Vol. 285, Issue 9, 2012, p. 2363-2367.
-
El-Ashi Y., Dhaouadi R., Landolsi T. Modeling and analysis of a wavelet network-based optical sensor for vibration monitoring. IEEE Sensors Journal, Vol. 11, Issue 8, 2011, p. 1657-1668.
-
Zheng J., Fu M. A Reset state estimator using an accelerometer for enhanced motion control with sensor quantization. IEEE Transactions on Control Systems Technology, Vol. 18, Issue 1, 2010, p. 79-90.
-
El-Ashi Y., Dhaouadi R., Landolsi T. Position detection and vibration monitoring system using quad-cell optical beam power distribution. Journal of the Franklin Institute, Vol. 348, Issue 7, 2011, p. 1435-1455.
-
Abbasi N. A., Landolsi T., Dhaouadi R. Vibration characterization using Gaussian laser beam. 5th International Conference on Modeling, Simulation and Applied Optimization (ICMSAO), Hammamet, Tunisia, 2013.
-
Taiwoa A., Seyedzadeha S., Taiwob S., Sahbudina R. K. Z., Yaacoba M. H., Mokhta M. Performance and comparison of fiber vibration sensing using SAC-OCDMA with direct decoding techniques. Optik – International Journal for Light and Electron Optics, Vol. 125, Issue 17, 2014, p. 4803-4806.
-
Johnson K. M., Mcknight D. J., Underwood I. Smart spatial light modulators using liquid crystals on silicon. IEEE Journal of Quantum Electronics, Vol. 29, Issue 2, 1993, p. 699-714.
-
Huang J. F., Chen K. S., Chih P. E., Yen C. T. Experiments on using Spatial Light Modulators to realize optical CDMA network coder/decoders. Information, Communications and Signal Processing (ICICS), Tainan, Taiwan, 2013.
-
Pearce M. B., Aazhang B. Multiuser detection for optical code division multiple access systems. IEEE Transactions on Communications, Vol. 42, Issue 234, 1994, p. 1801-1810.
-
Kizlik B., Nichoga V., Dub P. Group velocity and dispersion coefficient in the distributed sensor of vibration in fibre optic Michelson’s interferometer configuration. Intelligent Data Acquisition and Advanced Computing Systems: Technology and Applications, International Workshop on, Crimea, 2001.
-
Klokoc P., Lujo I., Bosiljevac M., Burum N. Optical sensor system for vibration measuring. ELMAR, 50th International Symposium, Zadar, 2008.
-
Huang J. F., Yang C. C., Tseng S. P. Complementary Walsh-Hadamard coded optical CDMA coder/decoders structured over arrayed-waveguide grating routers. Optics Communications, Vol. 229, Issues 1-6, 2004, p. 241-248.
-
Yen C. T., Huang J. F., Chih P. E. Constructing a two bands optical code-division multiple-access network of bipolar optical access codecs using Walsh-coded liquid crystal modulators. Japanese Journal of Applied Physics, Vol. 53, Issue 8S2, 2014, p. 08MB07.
About this article

This study was supported in part by the Ministry of Science and Technology MOST 105-2221-E-150-031.
