Abstract
Ship cabins are places for the crew to be on duty and have a rest. The convention sets a high limitation for noises of ship cabins. This paper combined finite element method with boundary element method to study and improve the noise of ship cabins. Firstly, this paper established the finite element model of a ship cabin, computed structural response, took the structural response as boundary condition and input it into acoustic software to couple with boundary element model, realize the computation of vibro-acoustic coupling and obtain sound pressure response. Then, the numerically computational sound pressure was compared with experimental results, and a good consistency was presented. It showed that the vibro-acoustic coupling model of the ship cabin in this paper was effective. In addition, this paper also computed the noise contribution of cabin panels to observation points and obtained panels which had a serious contribution to cabin noises. Finally, this paper applied laminated plate structure to these panels and recomputed cabin noises to compare with the original structure. Results showed that peak noises of field points were obviously improved, which ensured that the noise level of ship cabins satisfied the corresponding requirements of the convention.
1. Introduction
Ship cabins are places for crew to be on duty and have a rest. The convention sets a high limitation for noises of this kind of cabins [1-3]. The related researches of sound quality show that noises in the low frequency will annoy people easily. Therefore, it is very important to learn about the characteristics of noises in the ship and propose some noise reduction measures. The key to solving the noise prediction problem of the ship cabin is to consider the impact of different fireproof deck on the vibration and acoustic performance of cabin [4-6]. Song [7] numerically computed the floating floor structure with viscoelastic damping layer, predicted its structural noise, studied the impact of rock wool’s thickness, density and laying direction on the structural noise of floating floor inserting into the viscoelastic damping layer, and established a real model for test and verification. Chai [8] studied the impact of floating floor on the vibration reduction performance of ship cabin, proposed two theoretical models including mass-spring model and volatility model to compute the insertion loss of floating floor, and verified the proposed models through experiments. Xu [9] established ship FEM/BEM model of power system with raft structure and computed the vibration and sound pressure response of ship shell plate based on the coupling effect between ship and fluid mediums, but the researched process lacked the support of corresponding experimental data. Kim [10] pointed out that the most common material for impact absorption in floating floor structure is mineral wool, where high density and sufficient thickness is also needed for fire-resistant requirement in ships. For proper design of floating floors, it is essential to understand how the performance of floating floor is affected by the design parameters such as changes of the mineral wool thickness, density, fiber direction and the use of viscoelastic layer. Kim [11] used floating floor in the ship cabin to reduce vibration and noise. Two theoretical models are presented and predicted insertion losses of floating floor are compared to experimental results, where measurements have been done in mock-up built for simulating typical ship cabin structures.
The mentioned studies indicated that studying the floor of ship cabins could effectively reduce noises. However, the reported researches are not specific enough. They either lack experimental verification or are not systematic. To address this problem, this paper firstly established the finite element model of ship cabin, computed the structural response of ship cabin, took the structural response as an excitation and input it into acoustic software to couple with boundary element model, compute vibro-acoustic coupling and obtain sound pressure response. When the sound pressure response was computed, this paper also computed the contribution of cabin panels and obtained the panels which had a serious contribution to cabin noises. Additionally, this paper covered sound package structure on these panels and recomputed cabin noises to compare with the original structure, and an obvious noise reduction effect was realized.
2. Basic theory of numerical calculation of structural acoustic radiation
In the problem of structural vibration acoustic radiation in engineering practice, the situation of boundaries is quite complicated under normal circumstances. With the constant development of numerical solution technique, however, this kind of problems have been solved. Finite element method was adopted to solve the response of structural vibration; the vibration data of structure surface was taken as boundary condition and boundary element method was adopted to obtain the answer [12-14].
On the premise that normal vibration velocity at the surface of vibration body was known, boundary element method could solve the unknown variables at the surface of vibration. Then, boundary integral formula was used to solve various parameters in the radiated acoustic field. Finally, structural vibration-acoustic radiation was calculated in the form of numerical solution. After the vibration body was dispersed, nodes and units were formed at the boundary. The method of interpolation function was adopted to show the characteristic physics quantities and position parameters of any point at the boundary [15-17]:
In the formula, was any point at the boundary ; and were sound pressure and normal vibration velocity at the boundary node ; was interpolation function at the node . The above formula was substituted into the boundary Helmholtz integral equation to obtain [15]:
In the equation, and were used to stand for the basic solution taking the point as the source point and the value of its normal derivative at the point ; was used to represent normal derivative at the point ; was used to stand for the value of interpolation function at the node at the point . The above equation was adjusted into a discrete equation corresponding to boundary nodes and integral at the whole boundary was transformed into integrals at each unit to obtain:
In the equation, 1, 2, 3,…, ; e was used to stand for unit serial number; was used to represent unit area.
In a real-life situation, vibration body usually had a complex shape and irregular boundary. Under normal circumstances, the method of geometric transformation was adopted to transform the surface element (sub-element) of irregular vibration body into regular plane element (parent element). Namely, in the actual coordinate system was transformed into in the plane coordinate system. Jacobi factor was defined as:
Therefore, the relationship between sub-element and parent element was obtained as follows:
The transforming relationship was substituted into Eq. (3) to obtain:
where, 1, 2, 3,…, ,; was used to represent the corresponding value of the boundary element on the plane after geometric transformation; was used to stand for the corresponding value of the point at the boundary after geometric transformation. The above formula was transformed into a matrix form to obtain:
In the formula, was used to represent dimensional column vector formed by sound pressure at the nodal point of boundary surface; was used to stand for dimensional column vector formed by normal vibration velocity at the nodal point of boundary surface. and were the matrixes of . equation was listed as follows:
Discrete boundary Helmholtz integral equation was applied to select any point in space as the field point and conduct an analysis to obtain:
The method of Jacobi factor was adopted to deal with the above formula and obtain:
In the equation, and were used to represent dimensional row vector; and were used to stand for dimensional column vector formed by sound pressure and normal vibration velocity at the nodal point of the boundary. equation was listed as follows [16-20]:
In the issue of vibration and acoustic radiation, Eq. (1) could be used to obtain the data of sound pressure at boundary nodes and Eq. (2) could be applied to solve and calculate related parameters in sound fields when normal vibration velocity (data obtained usually by experimental measurement and simulation analysis) at the surface of vibration body was known.
3. Establishment of the finite element model of ship cabins
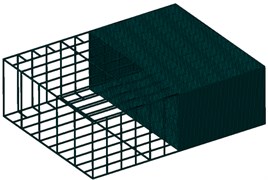
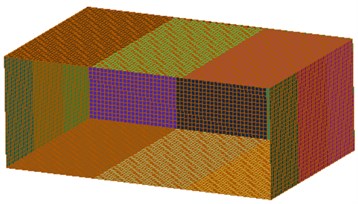
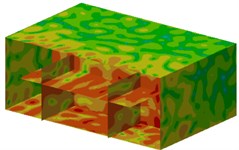
The ship cabin studied is located on the second deck layer of the target ship cabin, with frame #32-#44. At the fore and aft of the cabin are 12 frames longitudinally. The frame space of the main cabin is 0.70 m. The bottom layer of the cabin is 5.55 m away from the datum line. The top layer of the cabin is 8.35 m away from the datum line. The story height is 2.80 m. Apart from machining equipment, the cabin should also be equipped with an operating floor. One source of the cabin noise is structural vibration. The noise can be spread through solid structure. ANSYS software was adopted to establish finite element model of the cabin and parameterized cabin model. According to the structural characteristics of the cabin, the whole cabin was divided into several parts including deck, bulkhead, beam, longitudinal and longitudinal grader. Modeling was separately completed for each part to form the sub-model of cabin structure and combine sub-models into a complete cabin model which was shown in Fig. 1
Fig. 1The section view of finite element model of cabin
In actual work, the cabin is fixed in the ship. Therefore, the cabin floor was constrained to compute the natural modals of top 6 orders. The section view was shown in Fig. 2. As shown from the figure, vibration modals of the first order and the second order were symmetrical horizontally. Vibration was serious at the top and bottom panels of the cabin. Vibration modals of the third order and the sixth order were also symmetrical horizontally. In addition, vibration modals of the third order and the sixth order presented wave nodes. Vibration modals of the fourth order and fifth order were symmetrical vertically.
Fig. 2Modals of ship cabins on top 6 orders
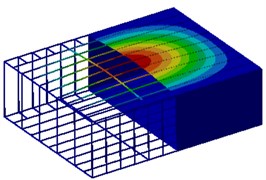
a) 12.5 Hz
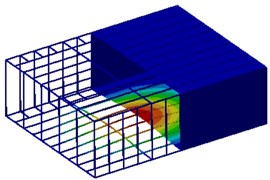
b) 23.2 Hz
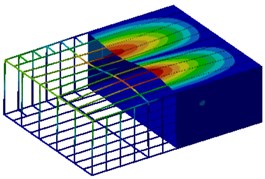
c) 26.1 Hz
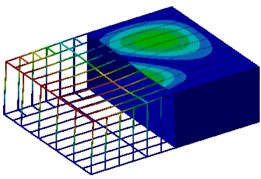
d) 38.2 Hz
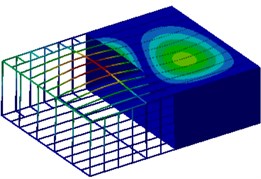
e) 47.3 Hz
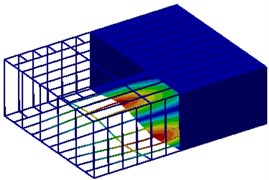
f) 56.8 Hz
4. Experimental test of noises of ship cabins
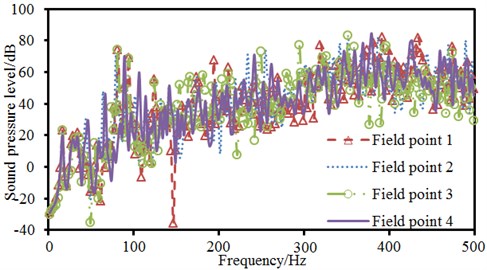
The measuring point should be chosen at the position close to the crew as much as possible. In the process of measurement, the microphone should be placed at a height of 1.2 m (simulation of seated people) and 1.6 m (simulation of standing people) above the deck. The distance between measuring points should be 2 m at least. In a big place without machine, the whole place should be measured according to spacing not more than 10 m (including the position of maximum noise level). The position of the microphone should be more than 1 m away from the reflecting surface and keep away from the reflecting surface as far as possible. The restriction could be appropriately relaxed regarding the narrow places on the ship. However, the microphone should be 0.5 m at least away from the reflecting surface anyhow. The measuring points selected in the machinery room should be close to the main working position of the crew as far as possible, especially those important positions near to telephones, communication and acoustic signal equipment. To learn about the situation of noise in the cabin, site noise test was conducted and the sound level meter of B&K Company was used to test the noise of the observation point on the real ship. The experimental test of noises of ship cabin was shown in Fig. 3. Finally, 4 noise observation points were arranged in the cabin ship, and the corresponding results were shown in Fig. 4. As can be seen from Fig. 4, the values of sound pressure levels of 4 noise observation points in the cabin presented basically the same change trends. Around 100 Hz, the sound pressure levels of 4 observation points had an obvious noise peak. In addition, Noise observation point 1 presented an obvious noise valley at 150 Hz, which was because the vibration modal of the cabin had a wave node at this frequency.
Fig. 3Experimental test of noises of ship cabins
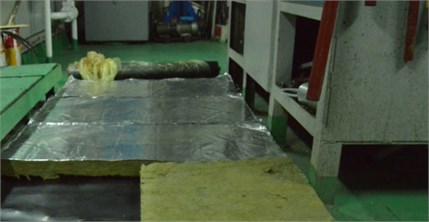
Fig. 4Sound pressure levels of 4 noise observation points in the cabin
5. Numerical computation of noises of ship cabins
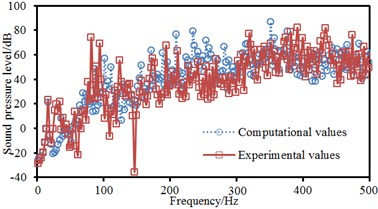
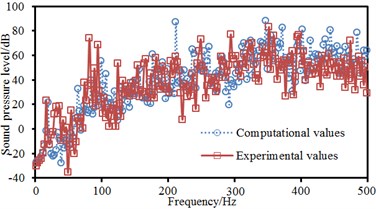
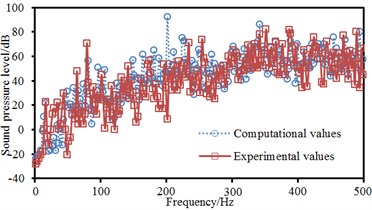
Experimental methods were adopted in section 4 to study the sound pressure levels of different observation points in the ship cabin. However, it was unable to identify the contribution of cabin panels to the sound pressure level of observation points. Therefore, it was necessary to adopt boundary element method to numerically compute cabin noises. This paper could absolutely take previously established finite element mesh model as the mesh of acoustic boundary element model in the case of establishing the acoustic boundary element model of ship cabins. Considering the vibration frequency response characteristics of ship cabins, it should be taken as the excitation condition of acoustic boundary element model in acoustic computation. Therefore, this paper deleted all beam elements and mass point elements in finite element model and conducted no processing for nodes in order to maintain the consistency between nodes of finite element model and boundary element model and ensure the correctness of data input. However, element library in the analysis module of acoustic boundary element did not support three-dimensional beams and mass point elements, and orthotropic material plate elements in acoustic software were not supported. As a result, it was supposed to properly process the finite element model and thus transform it into corresponding acoustic boundary element model. The mesh model was built in Nastran software. The file was put into Virtual. Lab and the material parameters of fluid were added. The vibration velocity of nodes was taken as acoustic input to obtain the acoustic boundary element model of the ship cabin. The ship cabin was symmetrical. To reduce the complexity of computation and improve computational efficiency, a boundary element model with half of the ship cabin was established, as shown in Fig. 5. Finally, the established boundary element mesh model included 23,904 elements and 32,035 nodes. The model of field points included 985 elements and 1,309 nodes. The computational result of the finite element model was imported into acoustic software to be mapped to boundary element meshes. In this way, acoustic meshes could obtain all characteristics of structured meshes to realize acoustic-vibration coupling. To fully study the noise contribution of cabin panels to observation points, the boundary element mesh model of the cabin was divided into 15 panels, as shown in Fig. 6. Finally, the acoustic response and panel contribution of the ship cabin could be obtained through applying vibration excitation and setting computational frequency on the coupling model. In the computational results, the curve of sound pressure response at observation points was extracted to compare with experimental results, as shown in Fig. 7.
Fig. 5Field points and boundary element model of ship cabins
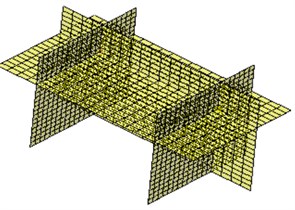
a) Field points
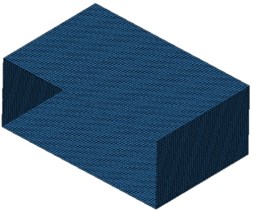
b) Mesh model
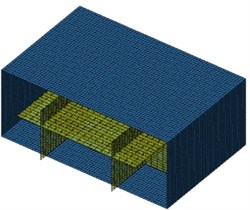
c) Boundary element model
Fig. 6Division of panels of ship cabins
As can be seen from Fig. 7, experimental and computational sound pressure levels of 4 observation points were almost the same and only frequencies of some peak points were different, which indicated that the boundary element model of ship cabins in this paper was effective and able to replace experimental methods to study cabin noises. For field point 1, peak sound pressure was 80.5 dB at 211 Hz, 81.6 dB at 226 Hz and 88.9 dB at 347 Hz. For field point 2, peak sound pressure was 89.1 dB at 211 Hz, 89.3 dB at 347 Hz, 82.3 dB at 365 Hz, 80.2 dB at 394 Hz and 79.3 dB at 446 Hz. For field point 3, peak sound pressure was 96.1 dB at 202 Hz. For field point 4, peak sound pressure was 92.1 dB at 202 Hz and 97.8 dB at 342 Hz. Therefore, 4 field points had 8 obvious peak frequencies, namely 202 Hz, 211 Hz, 226 Hz, 342 Hz, 347 Hz, 365 Hz, 394 Hz and 446 Hz.
Contours of sound pressure at these frequencies were extracted, as shown in Fig. 8. As can be seen from Fig. 8, noises at these observation points of ship cabins were generally larger. In addition, noises at field points were symmetrical.
Fig. 7Comparison of noises of ship cabins between experiments and simulation
a) Field point 1
b) Field point 2
c) Field point 3
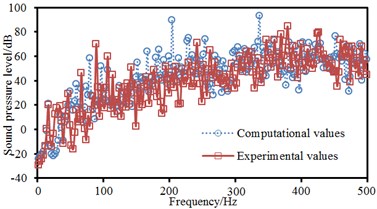
d) Field point 4
Fig. 8Contours of sound pressure at the peak frequencies of ship cabins
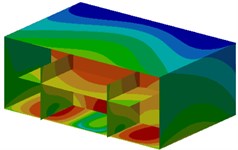
a) 202 Hz
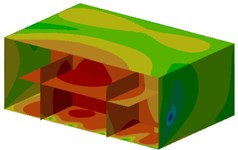
b) 211 Hz
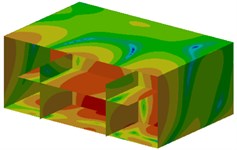
c) 226 Hz
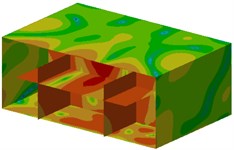
d) 342 Hz
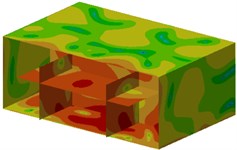
e) 347 Hz
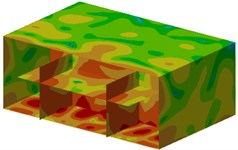
f) 365 Hz
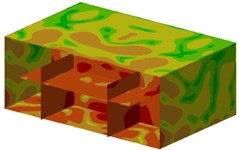
g) 394 Hz
h) 446 Hz
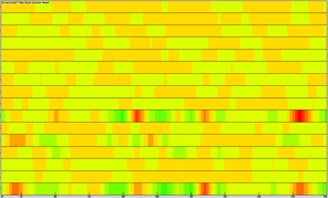
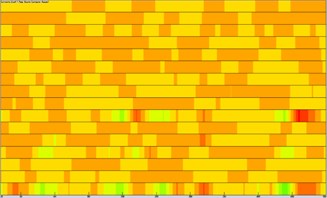
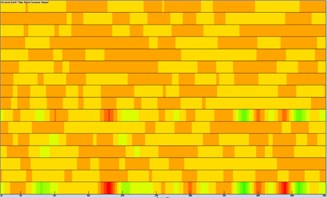
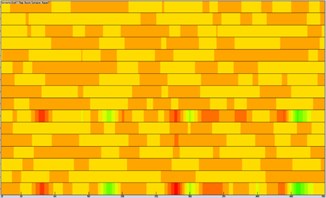
It was still unable to identify these panels which had a serious contribution to the noise of observation points only according to the above analysis. Therefore, this paper computed the acoustic contribution of various panels when boundary element method was used to compute the acoustic response of the cabin. Fig. 9 presented the contribution of various panels at 4 observation points. As shown in Fig. 9, only several panels made greater contributions to the noise of 4 observation points. These panels were mainly at the floor and top of the cabin. To verify the conclusion, field point 1 was taken as an example to extract the contribution coefficient of various panels at different frequencies, as shown in Fig. 10. As can be seen from Fig. 10, only several panels made greater contributions to the noise of 4 observation points. These panels were mainly at the floor and top of the cabin.
Fig. 9Contribution levels of panels of ship cabins at 4 observation points
a) Field point 1
b) Field point 2
c) Field point 3
d) Field point 4
Fig. 10Contribution coefficient of panels of ship cabins

a) 211 Hz

b) 226 Hz

c) 347 Hz

d) 365 Hz
6. Numerical optimization of noises of ship cabins
According to the above analysis on the contribution of acoustic panels, panels at the floor and top of the cabin had the greatest impact on noises in the cabin. Laminated composite plates were adopted to make improvement for these panels. Firstly, rubber and galvanized steel sheets should be used to deal with the constrained damping of steel deck. In addition, the marine fire rock wool with thickness 40 mm and bulk weight 140 kg/m3 was selected for the sandwich layer to satisfy the requirement of fire separation. According to the modeling thought of laminated composite structure, the floating floor was divided into 5 layers along the coordinate of thickness to form surfaces in terms of geometric dimension of outer contour and set the characteristics of various layers of materials on real constants of units. SHELL181 unit was adopted for finite element mesh division. The elastic modulus of steel sheets: 2.10E11Pa; Poisson’s ratio: 0.3; density: 7800 kg·m-3; the elastic modulus of special rubber: 6.50E8; Poisson’s ratio: 0.49; density: 1000 kg·m-3; the elastic modulus of rock wool: 6.20E6; Poisson’s ratio: 0.226; density: 100 kg·m-3; the elastic modulus of composite materials: 8.00E9; Poisson’s ratio: 0.16; density: 1710 kg·m-3.
Fig. 11The construction and location of the laminated cabin panels
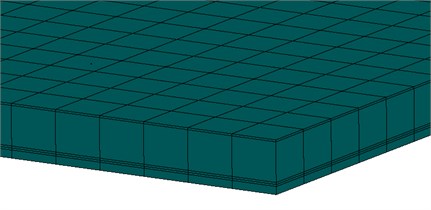
a) Finite element model of cabin panels
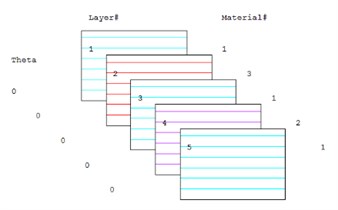
b) The laminated information of cabin panels
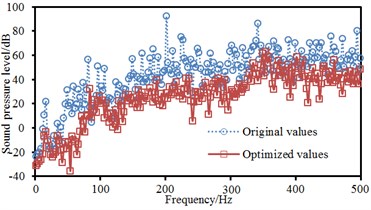
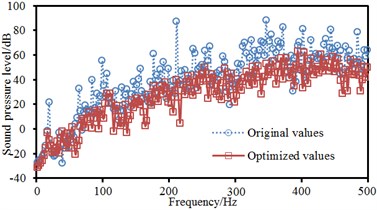
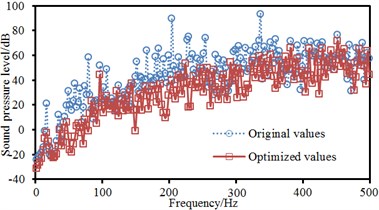
Fig. 12Comparison of noises in the ship cabin before and after optimization
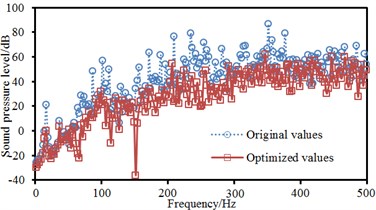
a) Field point 1
b) Field point 2
c) Field point 3
d) Field point 4
The dressing of the floor was composed of special rubber with thickness 2.0 mm and galvanized steel sheet with thickness 2.0 mm from bottom to top. This structure provided an excellent acoustic performance at the lowest height. In addition, rock wool with thickness 40 mm and composite materials with thickness 20 mm were included. This combination not only met the requirement of fire separation in the main deck cabin with serious vibration, but also better guaranteed the comfort of the cabin and effectively reduced the noise resulting from impact and structural vibration which was shown in Fig. 11.
After panels, which had great contributions to noises were treated, an acoustic boundary element model was used to re-compute the sound pressure response of the cabin at 4 field points and compare with original results, as shown in Fig. 12. As can be seen from Fig. 12, improved peak frequencies of the cabin decreased obviously. In addition, noises within the whole frequency band made an obvious improvement.
Contours of sound pressure at peak frequencies after improvement were extracted, as shown in Fig. 13. It could be seen from the figure that contours of sound pressure at observation points were improved obviously. Additionally, sound pressure at the cabin floor was also improved, which indicated that the noise reduction proposal proposed in this paper was effective.
Fig. 13Contours of sound pressure in the ship cabin after optimization
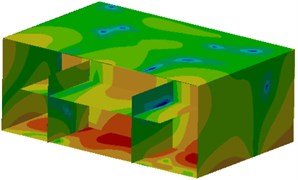
a) 202 Hz
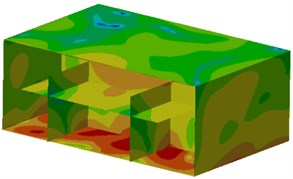
b) 211 Hz
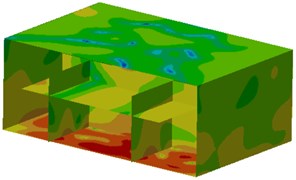
c) 226 Hz
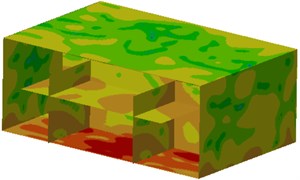
d) 342 Hz
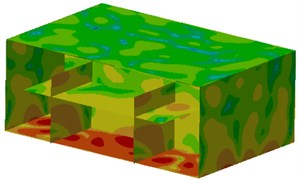
e) 347 Hz
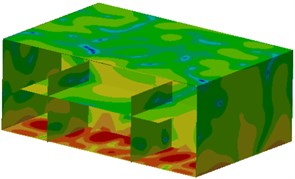
f) 365 Hz
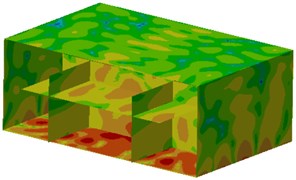
g) 394 Hz
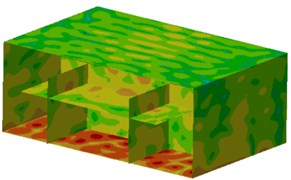
h) 446 Hz
7. Conclusions
A ship cabin was taken as the prototype to establish the finite element model of the cabin and confirm the boundary condition of vibration prediction model. The hanging position of generating diesel engine unit was selected as the exciting point of force to complete the three-dimensional acoustic modeling of the ship cabin. Parametric design was combined with finite element analysis to adjust the structural parameters of complicated models, automatically generate entity models and conduct finite element analysis. Boundary element method was adopted to predict the sound pressure level of a ship cabin. Galvanized steel sheets were used for the surface layer of the cabin floor to endow it with certain hardness and intensity. This combination guaranteed the comfort of the cabin in the main deck cabin with serious vibration and effectively reduced the noise resulting from structural vibration. The simulation calculation model of cabin structure was established. The parameters of vibration reduction achieving the design goal of “staggered frequencies” and aimed at the target spectral characteristics of vibration control in the deck of ship cabin were obtained through calculation and analysis. The floor structure of ship cabin was improved. BEM was adopted to predict noises. A contrastive analysis on the contour of sound pressure level in the cabin was conducted. The influence of the structure of laying floor dressing on the vibration sound environment of the cabin was verified. The most obvious peak frequency was selected as the frequency of concern. Damping coating was laid to control the vibration energy of bulkhead structure at these frequency points and effectively reduce noises in the cabin.
References
-
Borelli D., Gaggero T., Rizzuto E., et al. Analysis of noise on board a ship during navigation and manoeuvres. Ocean Engineering, Vol. 105, 2015, p. 256-269.
-
Han H. S. Psycho-acoustic evaluation of the indoor noise in cabins of a naval vessel using a back-propagation neural network algorithm. International Journal of Naval Architecture and Ocean Engineering, Vol. 4, Issue 4, 2012, p. 374-385.
-
Bouzón R., Costa A. M., Roshan G., et al. Evaluating the consequences of the new standards on noise conditions in ships. Pollution, Vol. 1, Issue 2, 2015, p. 127-138.
-
Hong M., Shun Y. Y. Natural vibration characteristics of stiffened plates and plates with covering layer in ships. Journal of Ship Mechanics, Vol. 12, Issue 2, 2008, p. 311-318.
-
Cho T. Vibro-acoustic characteristics of floating floor system: The influence of frequency-matched resonance on low frequency impact sound. Journal of Sound and Vibration, Vol. 332, Issue 1, 2013, p. 33-42.
-
Cho T. Experimental and numerical analysis of floating floor resonance and its effect on impact sound transmission. Journal of Sound and Vibration, Vol. 332, Issue 25, 2013, p. 6552-6561.
-
Song J. H., Hong S. Y., Joo W. H. Analysis of structure-borne noise in ship cabins using a floating floor with an inserted viscoelastic layer. Journal of Marine Science and Technology, Vol. 14, Issue 1, 2009, p. 127-135.
-
Cha S. I., Chun H. H. Insertion loss prediction of floating floors used in ship cabins. Applied Acoustics, Vol. 69, Issue 10, 2008, p. 913-917.
-
Xu Z., Wang Y., Hua H., et al. Modeling of the ship and numerical simulation of coupled vibro-acoustic behavior by FEM/BEM. Journal of Ship Mechanics, Vol. 6, Issue 4, 2002, p. 89-95.
-
Kim H. S., Kim B. K., Cha S. I., et al. Floor impact noise reduction in ship cabins by means of a floating floor. Noise Control Engineering Journal, Vol. 54, Issue 6, 2006, p. 406-413.
-
Kim H. S., Kim J. S., Kang H. J., et al. A study on the reduction of noise and vibration in ship cabins by using floating floor. Transactions of the Korean Society for Noise and Vibration Engineering, Vol. 16, Issue 9, 2006, p. 949-957.
-
Simpson R. N., Bordas S. P. A., Trevelyan J., et al. A two-dimensional isogeometric boundary element method for elastostatic analysis. Computer Methods in Applied Mechanics and Engineering, Vol. 209, 2012, p. 87-100.
-
Xiaozheng L., Xun Z., Yadong L. Application of boundary element method in study of noise from simply-supported box grider in high speed railway. China Civil Engineering Journal, Vol. 44, Issue 1, 2011, p. 95-101.
-
Herrin D. W., Liu J., Martinus F., et al. Prediction of sound pressure in the far field using the inverse boundary element method. Noise Control Engineering Journal, Vol. 58, Issue 1, 2010, p. 74-82.
-
Chand A. K. B., Viswanathan P. A constructive approach to cubic Hermite fractal interpolation function and its constrained aspects. BIT Numerical Mathematics, Vol. 53, Issue 4, 2013, p. 841-865.
-
Limongelli M. P. Frequency response function interpolation for damage detection under changing environment. Mechanical Systems and Signal Processing, Vol. 24, Issue 8, 2010, p. 2898-2913.
-
Mousa-Pasandi M. E., Plant D. V. Noniterative interpolation-based partial phase noise ICI mitigation for CO-OFDM transport systems. IEEE Photonics Technology Letters, Vol. 23, Issue 21, 2011, p. 1594-1596.
