Abstract
A main cable of a long-span suspension bridge is semi-surrounded by a catwalk during construction. Thus, design parameters of a catwalk may have influences on the galloping stability of a main cable during construction. To study the influence of catwalk design parameters on the galloping of steepled main cables, two main foci have been conducted. Firstly, the aerodynamic coefficients of the catwalk with actual design parameters are obtained by numerical simulation based on computational fluid dynamics (CFD), and the numerical results are compared with those of the previous wind tunnel test. Several typical main cables with different cross sections of a long-span suspension bridge during construction are selected, and their Den Hartog coefficients are obtained based on the numerical simulation considering the aerodynamic influences of the catwalks. Then four typical working conditions of a main cable which have great potential to occur galloping are selected based on the galloping analyze, and their aerodynamic coefficients considering the influence of the catwalk with different design parameters are obtained. The influence of the catwalk design parameters on galloping of the main cables is analyzed based on the Den Hartog criterion. Results indicate that catwalk design parameters have evident influences on aerodynamic coefficients and galloping of the main cables. The parameters of the catwalk which are favorable for suppressing the galloping of the main cables are determined, which establish a good guideline for the galloping-resistant design of the catwalk-main cable system on suspension bridges.
1. Introduction
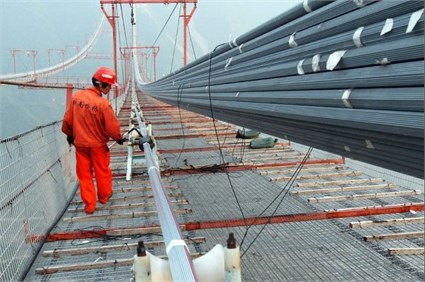
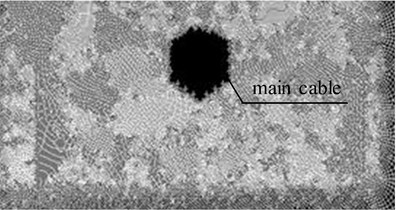
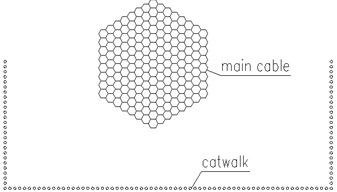
As a kind of long-span and flexible structure, suspension bridge is sensitive to the effect of wind. Wind-resistant stability has become the key control factor for design and construction of suspension bridge. Main cable construction is one of the important contents as to long-span suspension bridge construction. The main cables are made of hundreds of galvanized high strength steel wires (Fig. 1). The shape of main cable section will change significantly with the construction progress. The vibration of transient main cables is with great amplitude [1-4], because the suspender cable and stiffening girders have not yet been built. And the action of the wind leads to many unexpected shutdown, which slows the construction progress of main cable. Such as one cable strand was installed during an average day in a suspension bridge in the East China Sea. So, it is necessary to study the wind resistance of main cable during construction.
Galloping is a dynamic instability of slender nearly prismatic structures caused by the self-excitation due to wind. Once the critical wind speed, obtained by the quasi-steady force criterion has been exceeded, this phenomenon will occur [5]. Due to the low rigidity and non-circular cross-section, a main cable of a long span bridge may occur galloping during construction, which usually have a strong impact on the safety and duration of construction for the bridge [6-8]. A catwalk is a construction scaffold of a main cable in the suspension bridge during construction, and it is very close to the main cable. Previous studies have indicated that adjacent structures usually have aerodynamics interference between each other [9-14]. In addition, geometric parameters of the adjacent structures usually have significant influence on the aerodynamics interference [15]. Thus, design parameters of a catwalk may have some influences on the galloping stability of the main cable during construction. To ensure the safety of the main cable in cross wind during construction, it is necessary to study the influence of catwalk design parameters on the galloping of main cables.
On the basis of theoretical analysis, finite element software can be used to analyze the effects of catwalks on the vibration of suspension bridges [16-20]. Previous studies indicate that drag and lift coefficients are important parameters used to judge whether galloping phenomenon could occur to structure [21, 22]. Due to the large number of main cable strands employed during construction, a strand sets up and the section sharp of main cable changes during the construction process, and the drag and lift coefficients of each section are different. The money and time expenditure associated with wind tunnel experiments could be enormous [1]. Therefore, the combination of wind tunnel experiments and numerical simulations is more efficient and saves money [23]. Finite element soft wares have been used to analyze the design features, wind resistance performance, and the entire construction process of bridges has been analyzed according to the finite element analysis software. Both wind tunnel test and numerical simulation method have been used to study the aerostatic stability of catwalks of the Yang Luo Yangtze River suspension bridge in Wuhan, China. Li et al. [6, 7, 24] have studied the galloping phenomenon of steepled main cables with different cross-sections during construction considering the aerodynamic interference of the designed catwalk. Nevertheless, there are few studies about the catwalk design parameters with which the catwalk could maintain its stability and the wind resistance of the main cable during construction could be improved.
To study the effects of catwalks design parameters on the galloping of the main cable during suspension bridge construction, the main cable of a long-span suspension bridge constructed in the East China Sea is studied by using the computational fluid dynamics (CFD) software FLUENT. The correctness of the numerical model is verified by the comparison between the results of the wind tunnel test and the numerical simulation for the catwalk aerodynamic coefficients. Four typical main cables which have great potential to have galloping performance are selected based on the galloping analyze, and their aerodynamic coefficients considering the influence of the catwalks with different design parameters are obtained. The influence of the catwalk design parameters on galloping of the main cables is analyzed based on the Den Hartog criterion.
Fig. 1The erecting main cable
2. Numerical modeling
2.1. The catwalk-main cable system
Based on the background of a long-span suspension bridge with a main span of 1650 m, the line shape of the catwalk was taken as a center line which paralleled the main cable in its initial construction state. The cross section of the catwalk-main cable is shown in Fig. 2.
2.2. Theory of galloping analysis
Galloping is a type of divergent self-excited behavior. For some kinds of asymmetric circular cross sections of slim-lined construction, galloping will produce the aerodynamic negative damping component in the air when wind speed exceeds a certain critical value. After vibration is produced, it becomes so intense that the structure will fail at great amplitude. This phenomenon is known as cross-wind galloping [25]. Many studies have shown that the Den Hartog criterion is important to judge whether the galloping of a structure occurs. The concept of galloping coefficients has been put forward as follows:
In which the Den Hartog coefficient equals the sum of the drag coefficient and the derivative of the lift coefficient on the wind attack angle.
Below-zero galloping coefficients are necessary requirements for the occurrence of galloping in the structure [24]. In this paper, the galloping coefficients are important to judge whether the main cable galloping occurs during construction.
2.3. Numerical model of the catwalk-main cable system
Previous studies have shown that the SST - turbulence model is widely used in the calculation of catwalk static wind coefficients [7, 8]. Thus, in this study, the SST turbulence model is further used to study the effects of catwalk design parameters on aerodynamic coefficients of a spire-type main cable in a suspension bridge during construction.
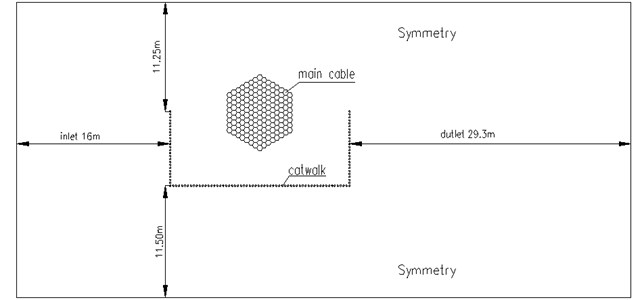
The calculation model of the catwalk-main cable system is shown in Fig. 2 (model scale 1:6). The computational domain is a rectangular region of 46 m×23 m (Fig. 2). The distance between the velocity inlet and the windward side is 16 m, and the distance between the upper and lower boundaries of the computation domain and model are 11.25 m and 11.5 m, respectively. The distance between the lee side and the outlet is 29.3 m. It can avoid reaching the outer boundary of formed separate vortex behind object and reflecting back.
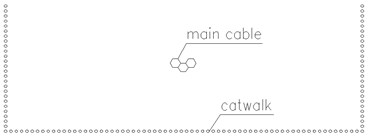
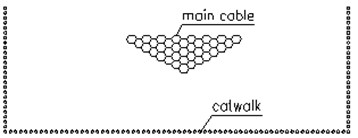
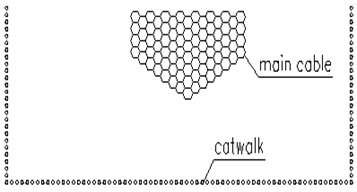
Fig. 2Cross section of the catwalk and main cable
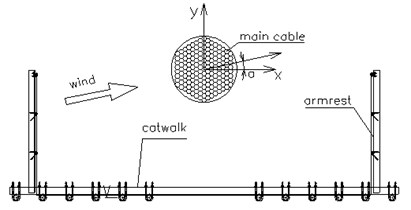
a) Cross section of the catwalk-main cable system
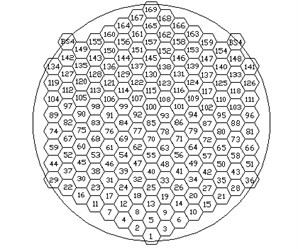
b) The designed cross-section of steepled main cable strands
Meanwhile, the flow field parameter distribution near the outer boundary is compatible with the assumed boundary conditions, and the solution can achieve a very good convergence. The windward boundary condition is defined as the velocity inlet, and the air density is 1.225 kg/m3. The lee side boundary condition is defined as the pressure outlet, and the relative pressure value is zero. The upper and lower boundary is the wall surface and has no slip. The outside surface of the catwalk cross section is defined as the wall surface and has no slip (Fig. 3).
Fig. 3Computational domain of the catwalk-main cable system
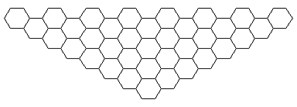
Mesh generation is performed in the calculation domain by unstructured grids. In the cross-section surface of the catwalk, encryption of grids is employed to make the numerical simulation closer to the actual situation. The iterative residual value is controlled at 10−6. Because the quality of mesh directly affects the precision of the simulation results, it should be assessed, and the quality should be optimized before calculation and analysis. In this paper, optimal regulation is used many times when meshing, resulting in a reasonable form of mesh generation (Fig. 4).
The Reynolds numbers of the numerical models for the models vary from 1.34×10⁵ to 2.32×10⁵, which are in the turbulent flow regime. The turbulent intensities in numerical models, which are determined by the Reynolds numbers, are in the range of 3.5 %-4.5 %. The equations RANS (Reynolds Averaged Navier-Stokes) are selected and solved with the SST - model. SIMPLE algorithm is adopted to deal with the pressure-velocity coupling, and the second order interpolation is used in the calculation of the pressure.
Fig. 4Grids around the catwalk main cable cross section
2.4. Experiment
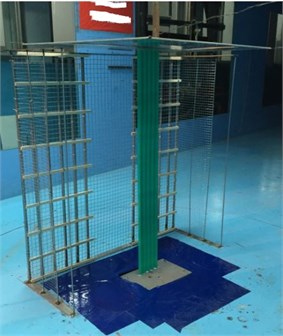
The wind tunnel test was conducted in the high-speed test section of the DUT-1 wind tunnel at the Dalian University of Technology, China. The section model of the main cable 15# was the same as the size adopted in the literature [8] (Fig. 5). The length of the model with 1:4 scale was 1 m, and the catwalk was made of stainless steel tube, wire frame, and batten. To ensure the similarity to the actual structure, the ventilation rate of the model was in line with the practice. The test method and data processing was consistent with those reported in the literature [8]. The test wind speed is 10 m/s.
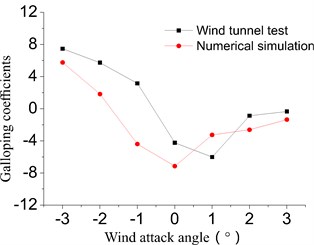
Through the wind tunnel tests, the drag and lift coefficients of the main cable 15# were measured with and without considering the influences of the catwalk respectively. The galloping coefficients were obtained by solving Den’s criterion. Fig. 6 shows the results of wind tunnel test and numerical simulation.
Fig. 5Experimental model in the wind tunnel
The analytical results demonstrate identical distribution and contiguous numerical value of galloping coefficients concluded from the two methods, and also the results suggest that it is feasible to carry out numerical simulation used in this paper. The significant difference of the results shown in Fig. 5 was due to differences between the two methods. In general, the possible error factors are the differences between the experimental and numerical model, and, the effects of boundary layer, which are given detailly in the literatures [8, 26].
Fig. 6The galloping coefficients of main cable 15# based on wind tunnel test and numerical simulation
3. Catwalk parameter analysis on main cable galloping
3.1. Selection for main cables
Different working conditions have different impacts on main cable galloping, and the shape of the main cable can be divided into three typical working conditions during the main cable construction which are shown in Fig. 7 when the effects of catwalks are considered. And the galloping coefficients of the main cables in three typical states with the wind attack angle range of −3° to 3° have been appeared in Fig. 8.
(1) The underside is triangular shape. The galloping coefficients of the 3# condition in the wind attack angle range of −3° to 0° are continuously less than zero, this phenomenon also applies to 15# in the wind attack angle range of −3° to 1° and the absolute value of the galloping coefficients of the 3# condition is greater in Fig. 8(a).
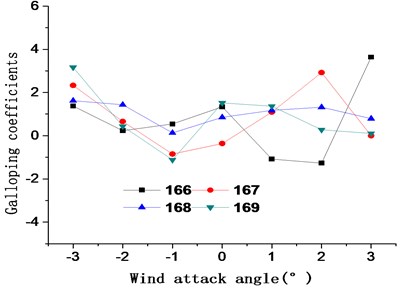
(2) The middle part is pentagonal shape. The galloping coefficients of the 66# condition in the wind attack angle range of –1° to 0° and 3° are obviously less than zero compared with other conditions in Fig. 8(b).
(3) The top part is spire shape. The galloping coefficients of the 167# condition in the wind attack angle range of −2° to 1°are continuously less than zero compared with other conditions in Fig. 8(c).
Thus, the 3#, 15#, 66#, and 167# working conditions of the main cable which are shown in Fig. 9 are the most unfavorable for main cable galloping. And the wind attack angle range when galloping is shown in Table 1.
Based on above analysis, there is only the 15# working condition during construction whose galloping coefficients are all less than zero in the wind attack angle range of −3° to 1°. So, the 15# working condition during construction is selected as for further study in this paper.
Fig. 7Three typical working conditions of the transient main cables
a) Triangle cable
b) Pentagonal cable
c) Spire cable
Fig. 8Galloping coefficients of the main cables with three cross sections
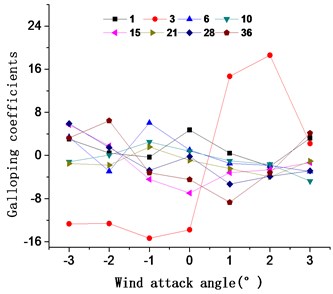
a) Triangle cable
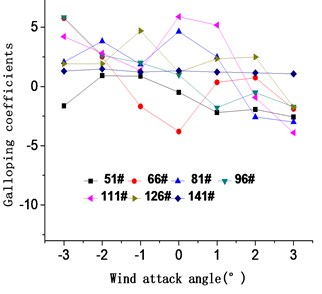
b) Pentagonal cable
c) Spire cable
Table 1The wind attack angle range for the galloping of the transient main cables with catwalks
Working condition of main cable | 3# | 15# | 66# | 167# |
Wind speed (m/s) | 10 | 10 | 10 | 10 |
Wind attack angle range when galloping | –3°-0° | –3°-+1° | –1°-0°, +3° | –2°-0° |
Fig. 9The most unfavorable working conditions of the transient main cables with catwalks
a) 3# condition of main cable
b) 15# condition of main cable
c) 66# condition of main cable
d) 167# condition of main cable
3.2. Influence of the space from the surface layer of the catwalk to the bottom of the main cable
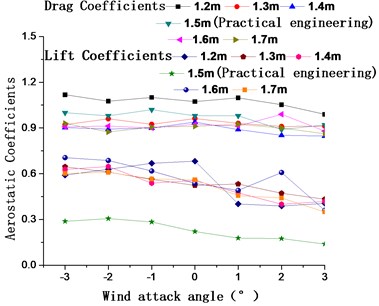
Under the 15# working condition, the aerostatic coefficients for different spacings from the surface layer of the catwalk to the bottom of the main cable (60 cm, 84 cm, 108 cm, and 132 cm) are calculated (Fig 10). Fig. 10(a) shows that all the drag coefficients and their variations are similar in the wind attack angle range of −3° to 3°. However, the lift coefficient of the main cable is greater for spacings of 60 cm, 84 cm, and 132 cm compared with spacing of 108 cm in the practical engineering. Fig. 10(b) shows the galloping coefficients with the different spacings; the galloping coefficients are greater than zero with spacings of 60 cm, 84 cm, and 132 cm at a wind attack angle of 0° while the galloping coefficients for spacing of 108 cm are less than zero in the practical engineering. The galloping coefficients are much less than zero with a spacing of 132 cm at a wind attack angle of 2°-3°. According to the Den Hartog criterion, the galloping coefficients less than zero are necessary for the occurrence of galloping. Thus, they are not conducive to the prevention of galloping in the above case. Considering both the convenience for construction and the galloping coefficients within the scope of the entire wind attack, spacing of 84 cm is selected as the optimal spacing.
Fig. 10Aerostatic coefficients and galloping coefficients of the main cable for spacings of 60 cm, 84 cm, 108 cm, and 132 cm from the surface layer of the catwalk to the bottom of the main cable
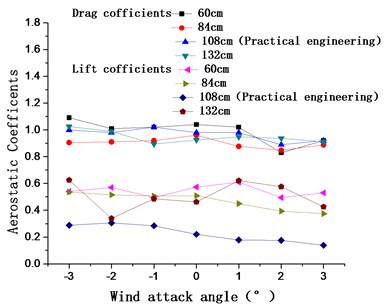
a)
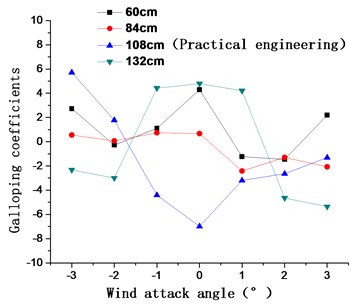
b)
3.3. Influence of catwalk width
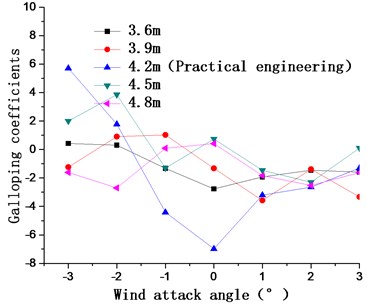
Fig. 11 shows the aerostatic coefficients and galloping coefficients of the 15# condition when catwalk widths are 3.6 m, 3.9 m, 4.2 m, 4.5 m, and 4.8 m, respectively. The catwalk drags coefficients and their changes for wind attack angles from −3° to 3°are similar the five tested catwalk widths; however, the lift coefficients for widths of 3.6 m, 3.9 m, 4.5 m, and 4.8 mare larger than those of the practical engineering width of 4.2 m. Fig. 11(b) shows the galloping coefficients for the different catwalk widths; the galloping coefficients are less than zero for catwalk widths of 3.6 m, 3.9 m, and 4.2 mat a 0° windattack angle. The change in galloping coefficients is relatively larger than catwalk widths of 4.5 m and 4.8 m within the scope of the entire wind attack angle, which is adverse to the prevention of galloping. For a catwalk width of 4.8 m, the galloping coefficients are continuously less than zero at positive wind attack angles, indicating the likely occurrence of galloping. Even though it produced unfavorable galloping coefficients for a catwalk width of 4.5 m, below-zero galloping coefficients at a 0° wind attack angle are chief judgment for the occurrence of galloping in the structure. And galloping coefficients at a 3° wind attack angle are more than zero. Thus, 4.5 m is selected as the optimal catwalk width.
Fig. 11Aerostatic coefficients and galloping coefficients of the main cable for catwalk widths of 3.6 m, 3.9 m, 4.2 m, 4.5 m, and 4.8 m
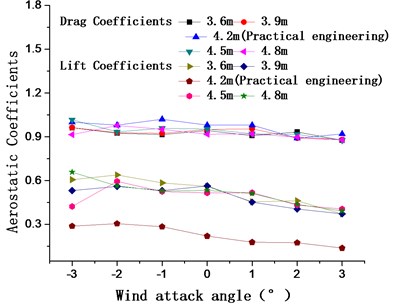
a)
b)
3.4. Influence of catwalk height
Fig. 12 shows the aerostatic coefficients and galloping coefficients of the 15# condition when catwalk heights are 1.2 m, 1.3 m, 1.4 m, 1.5 m, 1.6 m, and 1.7 m, respectively.
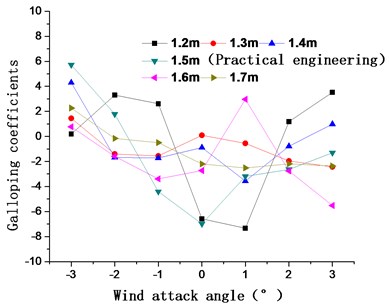
Fig. 12(a) shows that the drag coefficients are relative larger at the catwalk height of 1.2 m relative to the other heights with different attack angles, while the catwalk drag coefficients and their changes are similar for heights of 1.3 m, 1.4 m, 1.5 m, 1.6 m, and 1.7 m with different attack angles. However, the lift coefficients are a little smaller for the width of 1.5 m. The catwalk lift coefficients and their changes are similar for widths of 1.3 m, 1.4 m, 1.6 m, and 1.7 m at all wind attack angles. The galloping coefficients shown in Fig. 12(b) are less than zero for catwalk heights of 1.2 m, 1.4 m, 1.5 m, and 1.7 m with a 0° wind attack angle. For the 1.6 m catwalk height, the galloping coefficient tends toward zero for positive wind attack angles. The change in galloping coefficients is relatively larger than catwalk heights of 1.2 m, 1.3 m, 1.4 m, 1.5 m, and 1.7 m within the scope of the whole wind attack angle, which is adverse to prevention of galloping. For all wind attack angles, the galloping coefficients are greater than zero for a catwalk height of 1.3 m, and the change in galloping coefficient is relatively flat. Thus, the optimal catwalk height is 1.3 m.
Fig. 12Aerostatic coefficients and galloping coefficients of the main cable for catwalk heights of 1.2 m, 1.3 m, 1.4 m, 1.5 m, 1.6 m, and 1.7 m
a)
b)
3.5. Influence of catwalk side mesh ventilation rate
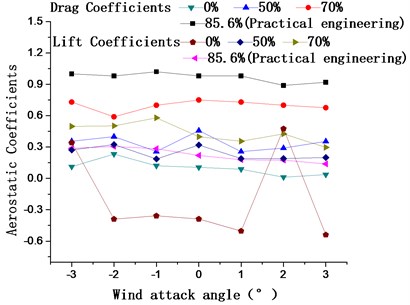
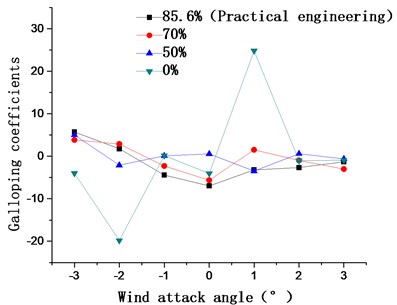
Fig. 13 shows the aerostatic coefficients and galloping coefficients of the 15# condition when catwalk side mesh ventilation rates are 85.6 %, 70 %, 50 %, and 0 %, respectively. Relative to other rates, the drag coefficients shown in Fig. 13(a) are a little bigger for the rates of 85.6 % and 70 % with different attack angles, while the lift coefficients are smaller at a ventilation rate of 0 %, with a larger fluctuation. Fig. 13(b) shows the galloping coefficients are less than zero for ventilation rates of 85.6 %, 70 %, and 0 % with a 0° wind attack angle, while, the galloping coefficients are greater than zero for the ventilation rate of 50 %. Thus, 50 % is chosen as the optimal ventilation rate of the catwalk side mesh.
Fig. 13Aerostatic coefficients and galloping coefficients of the main cable for catwalk side mesh ventilation rates of 85.6 %, 70 %, 50 %, and 0 %
a)
b)
3.6. Influence of the ventilation rate of the bottom web of the catwalk
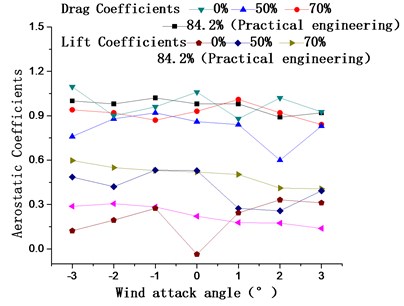
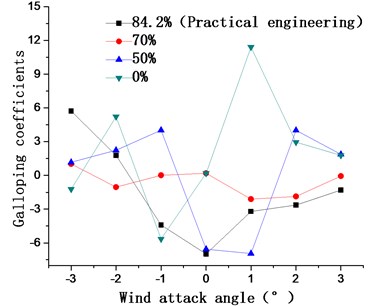
Fig. 14 shows the aerostatic coefficients and galloping coefficients of the 15# condition when catwalk bottom web ventilation rates are 84.2 %, 70 %, 50 %, and 0 %, respectively. the drag coefficients shown in Fig. 14(a) are smaller at the ventilation rate of 50 % compared with the other rates at all wind attack angles, while the lift coefficients are slightly bigger at a ventilation rate of 70 %. At a 0° angle of wind attack, the galloping coefficients Fig. 14(b) are less than zero for rates of 84.2 % and 50 % and greater than zero for rates of 70 % and 0 %. However, the galloping coefficients are much less than zero at a 0 % ventilation rate and a 1° wind attack angle, which is adverse to the prevention of galloping. Thus, a catwalk bottom web ventilation rate of 70 % is selected as the optimal rate.
Fig. 14Main cable aerostatic coefficients and galloping coefficients for catwalk bottom web ventilation rates of 84.2 %, 70 %, 50 %, and 0 %
a)
b)
3.7. Determination of catwalk design parameters
Based on the above analyses, the optimal design parameters under the 15# working condition for the prevention of main cable galloping instability are as follows: space from the catwalk surface layer to the bottom of the main cable = 84 cm; catwalk width = 4.5 m; catwalk height = 1.3 m; ventilation rate of catwalk side mesh = 50 %; and ventilation rate of the bottom web of the catwalk = 70 %.
In order to show more clearly the air motion state of main cable with different parameters of catwalk, Fig. 15 and 16 which are screenshots from the computational fluid dynamics (CFD) software FLUENT, show the contours of the main cable’s pressure based on the original design parameters and the design parameters of catwalk determined in this paper for the 15# condition in the wind speed of 10 m/s with a 0° wind attack angle, respectively.
By comparing Fig. 15 and 16, the common characteristics for the15# condition in the wind speed of 10 m/s with a 0° wind attack angle before and after optimization are that the windward side of the main cable’s pressure is high, but the leeward side pressure is low. As a result, drag coefficients of a section will be bigger by this pressure distribution. While, their different characteristics are that air flow as original design parameters of catwalk separates in front of windward side, and it will form a larger negative pressure area on leeward side, and therefore the air flow is complex and easy to cause spiral. However, in the presence of the design parameters of catwalk determined in this paper, the main cable under the 15# condition is located in the scope of pressure contours, and air flow varies smoothly.
Fig. 15Contours of the main cable’s pressure for the 15# condition based on the former catwalk design parameters in the wind speed of 10 m/s with a 0° wind attack angle
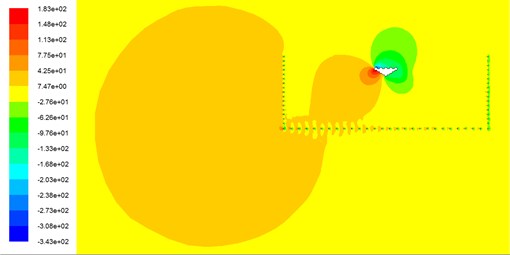
a) Contours of the main cable’s pressure for the 15# condition based on the former catwalk design parameters
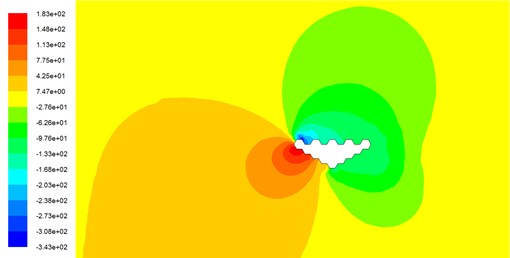
b) The detailed main cable figure of Fig. 15(a)
Fig. 16Contours of the main cable’s pressure for the 15# condition based on the catwalk design parameters determined in this paper in the wind speed of 10 m/s with a 0° wind attack angle
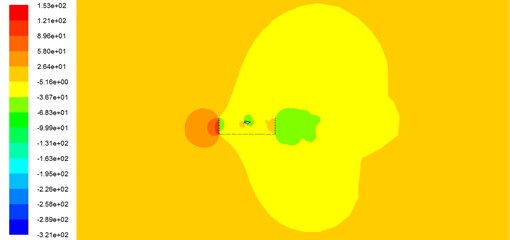
a) Contours of the main cable’s pressure for the 15# condition based on the catwalk design parameters determined in this paper
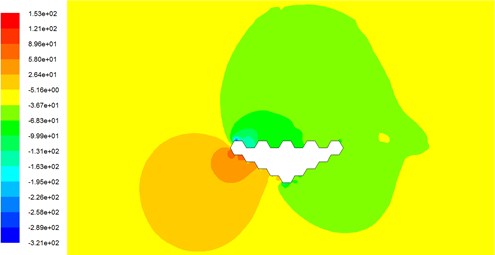
b) The detailed main cable figure of Fig. 16(a)
4. Discussion
According to the above optimal catwalk design parameters for the 15# condition, the calculation model for the catwalk-main cable system is rebuilt for the three other most unfavorable working conditions (3#, 66#, and 167#). The galloping coefficients of the corresponding working conditions are shown in Table 2. The galloping coefficients are all greater than zero at a 0° wind attack angle for the four most unfavorable working conditions, and all of the new galloping coefficients are greater than those calculated for the original catwalk design parameters. Therefore, the defined design parameters in this paper can effectively improve the galloping stability of the main cable during construction. Also, this shows that the defined design parameters in this paper are applicable to not just the 15# condition, but somewhat the three other most unfavorable working conditions.
In this paper, the design parameters for the three other most unfavorable working conditions (3#, 66#, and 167#) are not discussed in detail. However, in the actual construction, the problem whether or not the defined design parameters aimed at the 15# condition in this paper are optimum for the three other most unfavorable working conditions (3#, 66#, and 167#) under various working conditions needs a further discussion and study in order to guide the design and construction preferably, and it can be processed in the same way by as the method described in this paper.
So, the galloping stability of the main cable during construction can be improve by adjusting design parameters of catwalk, and the point and method proposed in this paper brings a new perspective for the study of catwalk design parameters.
Table 2Galloping coefficients of the main cable for different working conditions compared with those of the former catwalk design parameters (0° angle of wind attack)
Working condition of main cable | 3# | 15# | 66# | 167# |
Former design parameters of catwalk | −12.27 | −6.98 | −3.80 | −0.36 |
Defined design parameters of catwalk in this paper | 0.74 | 1.24 | 0.076 | 3.20 |
5. Conclusions
To study the influence of catwalk design parameters on the galloping of steepled main cables under construction, four typical main cables which have great potential to occur galloping are selected based on the numerical galloping analyze, and their aerodynamic coefficients considering the influence of the catwalk with different design parameters are obtained. Influences of the catwalk design parameters on galloping of the main cables are analyzed based on the Den Hartog criterion. Results indicate that the catwalk design parameters have evident influences on aerodynamic coefficients and galloping of the main cables. The parameters of the catwalk which is favorable for suppressing the galloping of the main cables is determine, which establishes a good guideline for the galloping-resistant design of the catwalk-main cable system on suspension bridges.
References
-
Ibarra D., Sorribes F., Alonso G., Meseguer J. Transverse galloping of two-dimensional bodies having a rhombic cross-section. Journal of Sound and Vibration, Vol. 333, Issue 13, 2014, p. 2855-2865.
-
Sumner D. Two circular cylinders in cross-flow: a review. Journal of Fluids and Structures, Vol. 26, Issue 6, 2010, p. 849-899.
-
Grigorjeva T., Juozapaitis A. Revised Engineering Method for Analysis of Behavior of Suspension Bridge with Rigid Cables and Some Aspects of Numerical Modeling. Procedia Engineering, Vol. 57, Issue 1, 2013, p. 364-371.
-
Simiu E., Scanlan R. H. Winds Effects on Structures: Fundamentals and Applications to Design. Wiley, New York, 1996, p. 230-243.
-
Holmes J. D. Wind Loading of Structures. CRC Press, 2015.
-
Li S., Wang C., Wang D., Ou J. Galloping performance of large scale spire type main cable of suspension bridge during construction. Journal of Vibration and Shock, Vol. 34, Issue 22, 2015, p. 156-160, (in Chinese).
-
Li S., An Y., Wang C. Aerodynamic influence of the catwalks sectional dimension on steepled main cables in suspension bridges. The World Congress on Advances in Civil, Environmental, and Materials Research (ACEM16), The Structures Congress, 2016.
-
An Y., Wang C., Li S., Wang D. Galloping of steepled main cables in long-span suspension bridges during construction. Wind and Structures, Vol. 23, Issue 6, 2016, p. 595-613.
-
Li S. Wind Resistance of Large Span Suspension Bridge during Construction. Science Press, Beijing, 2015.
-
Lou W., Lv J., Huang M. F., Yang L., Yan D. Aerodynamic force characteristics and galloping analysis of iced bundled conductors. Wind and Structures, Vol. 18, Issue 2, 2014, p. 135-154.
-
Li Y., Hu P., Xu Y. L., Zhang M., Liao H. Wind loads on a moving vehicle-bridge deck system by wind-tunnel model test. Wind and Structures, Vol. 19, Issue 2, 2014, p. 145-167.
-
Zheng S., Liao H., Li Y. Stability of suspension bridge catwalks under a wind load. Wind and Structures, Vol. 10, Issue 4, 2007. p. 367-382.
-
Li Y., Wang D., Wu C., et al. Aerostatic and buffeting response characteristics of catwalk in a long-span suspension bridge. Wind and Structures, Vol. 19, Issue 6, 2014, p. 665-686.
-
Kwon S., Lee H., Lee S., Kim J. Mitigating the effects of wind on suspension bridge catwalks. Journal of Bridge Engineering, Vol. 18, Issue 7, 2013, p. 624-632.
-
Assi G. R., Bearman P. W. Transverse galloping of circular cylinders fitted with solid and slotted splitter plates. Journal of Fluids and Structures, Vol. 54, 2015, p. 263-280.
-
Hung P. V., Yamaguchi H., Isozaki M., Gull J. H. Large amplitude vibrations of long-span transmission lines with bundled conductors in gusty wind. Journal of Wind Engineering and Industrial Aerodynamics, Vol. 126, 2014, p. 48-59.
-
Keerthana M., Harikrishna P. Application of CFD for assessment of galloping stability of rectangular and H-sections. Journal of Scientific and Industrial Research, Vol. 72, Issue 7, 2013, p. 419-427.
-
Corriols A. S., Morgenthal G. Vortex-induced vibrations on cross sections in tandem arrangement. Structural Engineering International, Vol. 24, Issue 1, 2014, p. 20-26.
-
Wang H., Li A., Hu R. Comparison of ambient vibration response of the Runyang Suspension bridge under skew winds with time-domain numerical predictions. Journal of Bridge Engineering, Vol. 16, Issue 4, 2010, p. 513-526.
-
Li H., Chen W. L., Xu F., Li F. C., Ou J. P. A numerical and experimental hybrid approach for the investigation of aerodynamic forces on stay cables suffering from rain-wind induced vibration. Journal of Fluids and Structures, Vols. 26, Issues 7-8, 2010, p. 1195-1215.
-
Kim S. W., Kim N. S. Dynamic characteristics of suspension bridge hanger cables using digital image processing. NDT&E International, Vol. 59, Issue 7, 2013, p. 25-33.
-
Rocchi D., Rosa L., Sabbioni E., Sbrosi M., Belloli M. A numerical – experimental methodology for simulating the aerodynamic forces acting on a moving vehicle passing through the wake of a bridge tower under cross wind. Journal of Wind Engineering and Industrial Aerodynamics, Vols. 104-106, 2012, p. 256-265.
-
Ewere F., Wang G., Cain B. Experimental investigation of galloping piezoelectric energy harvesters with square bluff bodies. Smart Materials and Structures, Vol. 23, Issue 10, 2014, p. 104012.
-
Li S., Ou J. Galloping analysis of the transient main cables for long-span suspension bridges during construction. China Civil Engineering Journal, Vol. 42, Issue 9, 2009, p. 74-81.
-
Joly A., Etienne S., Pelletier D. Galloping of square cylinders in cross-flow at low Reynolds numbers. Journal of Fluids and Structures, Vol. 28, 2012, p. 232-243.
-
Cai M. Q., Yan B., Lu X., Zhou L. S. Numerical simulation of aerodynamic coefficients of iced-quad bundle conductors. IEEE Transaction on Power Delivery, Vol. 30, Issue 4, 2015, p. 1669-1676.
About this article

The authors are grateful for the financial support from the National Natural Science Foundation of China (51208471, 51778587), Natural Science Foundation of Henan Province of China (162300410255), Outstanding Young Talent Research Fund of Zhengzhou University (1421322059) and Science and Technology Planning Project of Transportation in Henan Province (2016Y2-2).
Pan Guo carried out the numerical simulation, data analysis, and wrote the paper. Shengli Li guided and modified the paper. Chaoqun Wang did the wind tunnel tests. Yanan Hu did the wind tunnel tests. Dongwei Wang guided the paper.
