Abstract
At present, an important slope stability analysis method consists in the evaluation of the bearing capacity of key block, which is located between the joints and fissures in rock mass, and plays the decisive role on the slope stability. Because of the defective equivalent accuracy and elusory mechanical path, the traditional analysis methods have some inevitable errors. However, the energy theory can avoid the above defects easily, in this paper, the analytical input energies are potential energy and blasting vibration energy, and the consumed energies are fractured dissipative energy, friction dissipative energy and kinetic energy of instability. In order to eliminate the size effect problem, it is necessary to emphasize each part of energy expression as the energy density form. And the first four items would be confirmed by different theories and tests, so that the instability kinetic energy could be evaluated by the energy conservation law, and then the instability velocity could be calculated to predict the instability grade of slope.
1. Introduction
Opencast working is a common mining method in shallow resources exploitation with the advantage of the low cost, high production efficiency and high recovery capacity. In recent years, the depth of open pits in mineral exploration has increased significantly in China. Meanwhile, the slope is becoming higher and higher, what seriously threatens the safety of people and machinery. In the interest of predicting the stability of slope, numerous scholars have paid their attention to this problem. Cha and Kim [1] evaluated the effect of shape and length of slope and soil depth for a slope stability analysis with topography; Garevski et al. [2] presented an advanced methodology for predicting the slope stability under a seismic wave by taking into account the uncertainties related to the main input parameters; Pinheiro et al. [3] adopted a new empirical system for assessing the rock slope stability analysis during the exploitation stage; Johari and Khodaparast [4] used an analytical stochastic analysis method to solve the seismic stability of infinite slope problem; Mnzool et al. [5] made a research on the southern slope stability of the Chengmenshan copper mine, China; Li et al. [6] estimated the slope stability uncertainty by using the coupled Markov chain; Li et al. [7] studied the influence of the spatial layout of plant roots on the slope stability; Nian et al. [8] also analyzed the seismic stability of slope reinforced with a row of piles, and optimized the position of the pile in a seismic area. For the slope instability, the inherent joints and fissures are the most important influence factors for the stability. All the analysis methods can be mainly summarized into three kinds. The first kind concerns regarding the rock mass as an isotropic body after adopting some equivalent methods to reduce the strength parameter [9-14]. The second one considers the anisotropic characteristics to accept different mechanical parameters in different directions [15-20]. The third one is related to an analysis of the bearing capacity of key block between the joints or fissures which plays a critical role for the slope stability, and some researchers named this key block as a rock bridge in a rock slope [21-28]. Also, because of a lower cost and high accuracy, the numerical simulation has become a common prediction method in engineering analysis project. The fast development of computer technique makes many scholars use the Finite Difference Method (FDM) [29-32], Finite Element Method (FEM) [33-35] and Discrete Element Method (DEM) [36] to predict slope stability problems. Although, a great deal of research has been done by scholars all over the world, because of the defective equivalent accuracy and elusory mechanical path, the traditional analysis methods have some inevitable errors. In the meantime, the safety factor predicted by the stress method displays the tendency of slope stability, which cannot make sure whether the slope slides or not. Energy analysis will be more simple and accurate because energy is a status variable and doesn’t rely on its path.
In this paper, the slope of the Washan open pit was chosen as the case study, after a large number of in-situ joints and fissures survey, we found that the slope was a typical key block slope. For the key block rock, the mainly acting energies were summarized as potential energy, blasting vibration energy, fractured dissipative energy, friction dissipative energy and kinetic energy of instability. In order to eliminate the size effect problem between rock specimen and rock mass, each part of energies is expressed in the energy density form. Each of the total energy components was assessed by different methods or simulations. For the potential energy, the value could be confirmed by the gravitational potential energy method of the slope elements. The blasting vibration energy was calculated by the vibration velocity field, which was predicted by the accurate blasting load and the equivalent elastic boundary in the FDM software (FLAC3D). The fractured dissipative energy and friction dissipative energy could be fitted from the Split Hopkinson Pressure Bar (SHPB) and uniaxial compressive testing data. At last, the kinetic energy of instability could be calculated by the energy conservation law, and then the instability velocity could be calculated to predict the instability grade of slope.
2. Energy distribution analysis
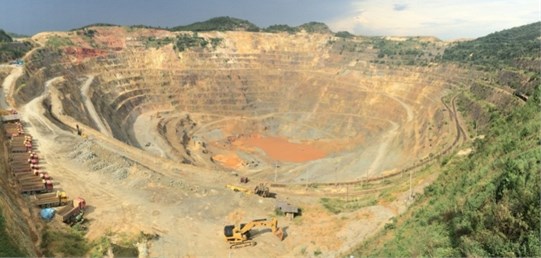
In most of high rock slopes, there is a large number of joints and fissures. By taking in-situ joints and fissures survey, the preponderant joints and fissures’ group could be figured out. In this study, the northern slope of the Washan open-pit mine was chosen as the analysis target. The photograph of Washan open-pit mine was shown in Fig. 1.
Fig. 1Washan open-pit mine in Jiangsu province, China
In order to describe the development status of in-situ joints and fissures in slope, 306 exposed joints and fissures were monitored by a geological compass on the northern slope. After data summarized and analyzed, the preponderant joints and fissures’ groups were determined and drawn in Fig. 2.
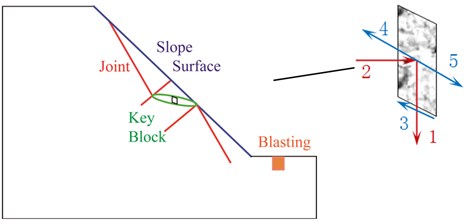
Based on the in-situ survey, the formation rock in the northern slope is tuff breccia, and the joints and fissures’ group indicated in Fig. 2 showed that the preponderant groups were around 120 degrees and 220 degrees respectively. Considering the actual engineering geology, slope structure and in-situ joints and fissures’ monitoring data, a conceptual diagram could be determined as shown Fig. 3. So, for the element body of key block, the applied energy and dissipative energy could be concluded as the potential energy, blasting vibration energy, fractured dissipative energy, friction dissipative energy and kinetic energy of instability, which were reflected in Fig. 3.
Fig. 2Preponderant joints and fissures’ group
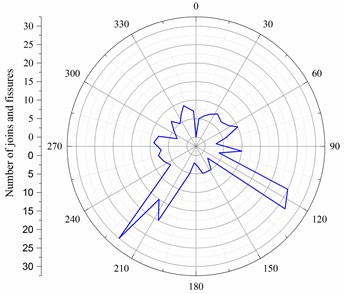
Fig. 3Conceptual diagram of key block form slope (1 – potential energy, 2 – blasting vibration energy, 3 – fractured dissipative energy, 4 – friction dissipative energy and 5 – kinetic energy)
After introducing the energy distribution in the key block of slope, adopting the energy conservation law, each part of energy was determined by different theories or tests in the below section as shown in Eq. (1):
where, is the total potential energy of the key block and its overlying rock; is the vibration energy of the key block, caused by the blasting at the far field; is the fractured dissipative energy during the key block rock, fractured by the input energy, this fractured dissipative energy includes the cut-through dissipative energy between the joints or fissures and the new surface formed energy by the fracture mechanics theory; is the friction dissipative energy between the structural surface in the key block rock after it is fractured by the input energy; is the instability kinetic energy, which is the energy resource of the instability, so, after this kinetic energy calculated, the status of slope, and even the sliding velocity can be represented.
In order to eliminate the size effect problem between rock specimen and rock mass, each part of energies would be expressed as the energy density form. The equation can be shown as:
where, the series of symbols in Eq. (2) are the corresponding energy density form in Eq. (1).
3. Energy conservation analysis
3.1. Potential energy
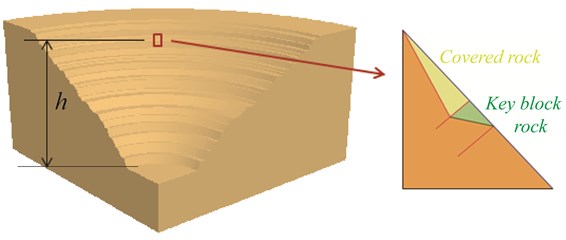
For the potential energy, its value can be confirmed by the gravitational potential energy method of the slope. During the potential energy analysis, it must be noticed that the potential energy should include the key block rock and its overlying rock together. The conceptual diagram was shown clearly in Fig. 4.
Fig. 4Conceptual diagram of potential energy
Gravitational potential energy formula is:
where, is the sum mass of key block rock and the overlying rock; is the gravitational acceleration; is the height between analysis element and bottom of open pit mine.
So, the potential energy density is:
where, is the volume of overlying rock, and is the volume of key block rock.
3.2. Blasting vibration energy
For the blasting vibration, the vibration velocity on the slope surface can be monitored by the blasting vibration velocity recorder. Considering the different distance from explosive source, the attenuation and propagation law of slope surface in the blasting field could be fitted. However, this superficial velocity would not satisfy the blasting vibration energy in a key block rock very well. With the fast development of computer technique, many scholars use the numerical simulation software to predict vibration velocity. However, most of these simulations adopted traditional triangular loading, trapezoidal loading or exponential loading. These loadings are too simplified to analyze the blasting problem. Li et al. divided the whole blasting process into four stages (earlier stage, middle stage, later stage and last stage), and adopted the Chapman-Jouguet model, high pressure gas law, gas kinetic theory and instant dissipation assumption to deduce the equations as [37]:
After fitting the above equations by MATLAB, the accurate blasting load model was obtained and shown in Fig. 5.
Fig. 5Accurate blasting load model [37]
![Accurate blasting load model [37]](https://static-01.extrica.com/articles/18382/18382-img5.jpg)
Meanwhile, for the blasting vibration energy, if the key block is located in the far side of blasting field, and it is due to the multiple superposition of blasting sequences and complicated rock fragmentation mechanism, it is not necessary to analyze the explosive rock fragmentation mechanism by employing the equivalent elastic boundary method [37]. This equivalent elastic boundary considered the blasting loading only when the elastic vibration is produced beyond the crushed and fractured zone around the blasting hole. Then, the attenuation rule could be confirmed, at the same time, by using the dynamic Saint-Venant’s principle [38], the dynamic loading applied on the equivalent elastic boundary was:
The 3D slope model was built in the FDM software (FLAC3D) with accepting the accurate blasting loading, equivalent elastic boundary and physical and mechanics parameters of rock, the velocity field can be predicted to calculate the blasting vibration energy by Eq. (9):
where, is the predicted velocity by numerical simulation.
So, the blasting vibration energy density is:
3.3. Fractured dissipative energy
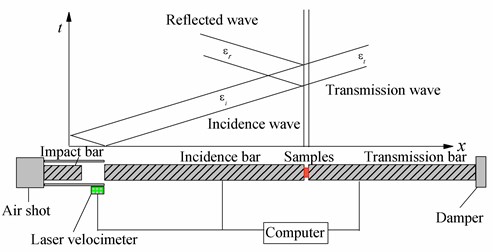
According to the fracture mechanics theory, when the rock was fractured by the dynamic energy, such as the blasting energy, the cut-through between the joints or fissures and the new formed surface would consume some energy. This energy was the fractured dissipative energy, so it contained the cut-through dissipative energy and new surface forming energy. There is a threshold value for the dynamic loading to fracture rock, that is to say, only the input energy is more than this threshold value, the rock will be damaged. On the contrary, the rock is undamaged. The fractured dissipative energy and damaged threshold value could be estimated by conducting the Split Hopkinson Pressure Bar (SHPB) test. The typical SHPB system was shown in Fig. 6.
After a large number of SHPB tests under different strain rates, the damaged threshold value was confirmed. After the analysis on the energy distribution of the whole test, the fractured dissipative energy was also calculated by Eq. (11):
where, is the total input energy equal to the initial input kinetic energy of impact bar; is the rebounding energy of the impact bar, and the initial input velocity and rebounding velocity could be monitored by the laser velocitmeter; is the kinetic energy of rock samples’ fragment, which can be reflected by the high-speed camera; is the elastic wave energy in the rock sample, which can be calculated by equations; is the fractured dissipative energy; is the elastic displacement energy in the impact bar, incidence bar and transmission bar, and it can be ignored due to high stiffness; is the residual energy, which includes the heat energy, sound energy and so on. The research shows that this part of the energy is less than 2 % of total energy, so it can also be ignored.
Fig. 6Typical SHPB system in laboratory
At the same time, with processing the monitoring strain curves in an incidence bar and transmission bar, the dynamic mechanical parameters could be obtained:
3.4. Friction dissipative energy
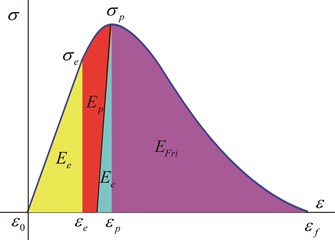
The friction dissipative energy was the energy consumed during relative motion between different structural surfaces in the rock after it was fractured by the energy. It can be evaluated by the analysis of the compressive test. The typical compressive test curve and its partition were expressed in Fig. 7.
As shown in Fig. 7, the areas with different colors illustrated the different energy partition during the compressive test: the yellow area means the elastic displacement energy under the elastic state; under the plastic state, the red and yellow areas both demonstrate the plastic dissipative energy, and the light blue area diplays the elastic displacement energy under the plastic state; when the stress go through the peak stress that means that the rock is damaged completely, in the behind stage, the main energy consumes during relative motion between different structural surfaces, the purple color area displays the friction dissipative energy. So, the expression of the friction dissipative energy is:
where, is the expression of the stress-strain curve between the peak strain and final strain .
Fig. 7Typical compressive test curve and its energy partition
3.5. Kinetic energy of instability
Instability kinetic energy is the energy resource of the slope instability. It can make the rock mass of slope slide till cause disaster. After estimating the input energy and dissipative energy, the residual energy is the kinetic energy of instability, and the velocity of the slide mass is:
The calculated velocity was used to evaluate the stability and landslide grade of the slope, and this mouth was more visual and certain for the prediction.
4. Slope stability analysis of Washan open pit mine
4.1. Laboratory test
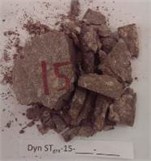
The formation of key block rock mainly is tuff breccia in the Washan open pit mine. In order to obtain the damage threshold value, fractured dissipative energy and dynamic characteristics, 20 tuff breccia rock samples with 50 mm diameter and 25-32 mm length were tested by the SHPB system. The ratio between length and diameter of rock samples were from 0.5 to 0.64 as shown in Fig. 8.
Fig. 8Rock samples before SHPB impact test
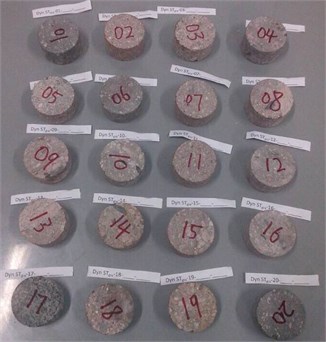
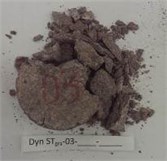
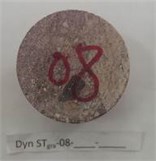
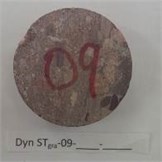
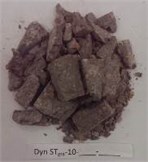
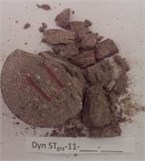
After SHPB impact tests under different strain rates, the rock samples were crushed into different rock fragments. The higher the strain rate is, the more complete damage is. The crushed rock samples are shown in Fig. 9.
As shown in Fig. 9, the rock sample Nos. 8, 9, 14 and 18 are undamaged after the SHPB impact test, and the input strain rate were 80s-1, 111s-1, 140s-1 and 137s-1 respectively; for the samples Nos. 6 and 19, there is a local crack on them, who’s the input strain rates were 155s-1 and 146s-1 respectively, and the average strain rate is 150.5s-1. So, in this paper, the damage threshold strain rate was confirmed as 150s-1.
By using the above calculating formulas in section 3.3, the fractured dissipative energy and the dynamic characteristics with different strain rate could be fitted as shown in Fig. 10 and Fig. 11.
Fig. 9Rock samples after SHPB impact test

a)

b)
c)

d)

e)

f)

g)
h)
i)
j)
k)

l)

m)

n)
o)

p)

r)

s)

t)

u)
In Fig. 10, the total energy is the input energy of impact bar, it can be calculated by the strain rate, so the fractured dissipative energy could be obtained by analyzing the data from Fig. 10.
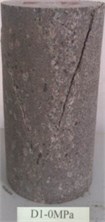
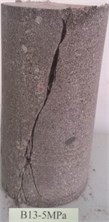
For the friction dissipative energy, 3 groups of 9 rock samples with different confining pressures were carried out by the compressive tests with the triaxial apparatus, and the typical rock samples before and after test were shown in Fig 12.
After testing, typical test curves with different confining pressures were shown in Fig. 13.
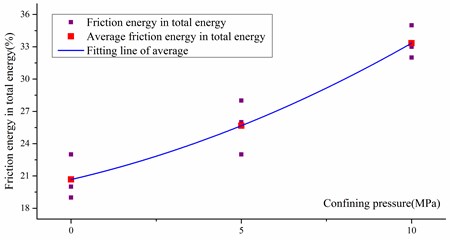
The friction dissipative energy in the total input energy can be calculated using Eq. (15), which was introduced in Section 3.4. The fitting results were shown in Fig. 14.
Fig. 10Rate between fractured energy and total energy
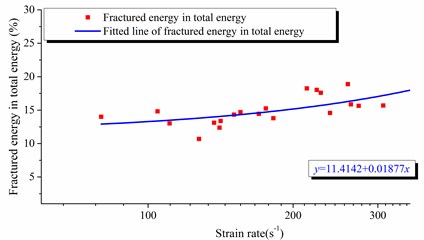
Fig. 11Dynamic parameters of rock and its fitting curves
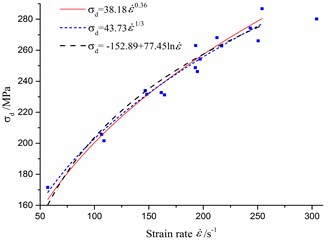
Fig. 12Typical rock samples before and after compressive tests

a)

b)

c)
d)
e)

f)
In Fig. 14, the total energy is the whole area of the stress-strain curves, which is obtained from the compressive test with different confining pressures. It can be calculated with the help of integral formulas, so, the friction dissipative energy can be obtained by analyzing the data from Fig. 14.
Fig. 13typical test curves with different confining pressures
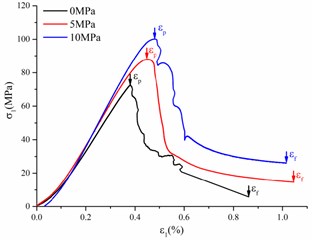
Fig. 14Rate between friction energy and total energy
4.2. 3D simulation model and input parameters
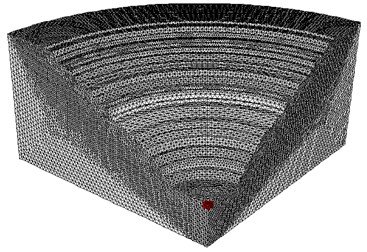
The blasting vibration energy could be predicted by a numerical simulation. Based on the actual engineering geology and structures, a 3D model was built in the FLAC3D finite difference software to accept the constitutive parameters, blasting load, equivalent elastic boundary and physical and mechanics parameters as shown in Fig. 14. The geometrical dimensions were: 1100 m length ( direction), 1100 m width ( direction), 620 m height ( direction). The finite element mesh consists of 123752 nodes and 665283 elements. The blasting zone was between 175 m and 200 m ( direction) at the open pit bottom with 30 m radius, and the blasting zone was meshed as 77 elements (red zone), as shown in Fig 15.
Fig. 153D model in numerical simulation
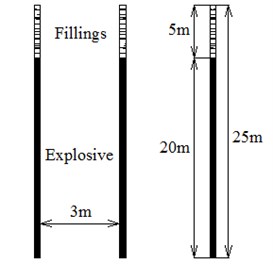
Blasting zone were designed as the columns of blast holes, the particular size of the blast hole was depicted in Fig. 16, and the arrangement of blast holes is also indicated in Fig. 16. The blasting parameter was shown in Table 1 and Table 2.
Fig. 16Charge structure of blast hole and its arrangement
a)

b)
Table 1Time interval of every multistage
MS1 | MS2 | MS3 | MS4 | MS5 | MS6 | MS7 |
0 ms | 50 ms | 110 ms | 200 ms | 310 ms | 460 ms | 650 ms |
Table 2Blasting parameters
Charge diameter (mm) | Blast hole diameter (mm) | Holes number | Explosive density (kg/m3) | Detonation velocity (m/s) |
82 | 90 | 900 | 1000 | 3200 |
From the top to the bottom, there are 3 layers that consist of artificial miscellaneous filled soil, tuff breccia, and mixed granite, which constitutive parameters were obtained from the lab test as shown in Table 3.
Table 3Particular constitutive parameters of rock
Layer | Density (kg/m3) | E(MPa) | Bulk modulus (MPa) | Shear modulus (MPa) | Friction angle (°) | Cohesion (MPa) | |
Filled soil | 2000 | 20 | 0.300 | 16.7 | 7.69 | 18 | 0.013 |
Tuff breccia | 2570 | 9512 | 0.26 | 6605 | 3774 | 39 | 0.485 |
Granite | 2604 | 7130 | 0.24 | 4570 | 2880 | 49 | 0.646 |
4.3. Numerical simulation analysis
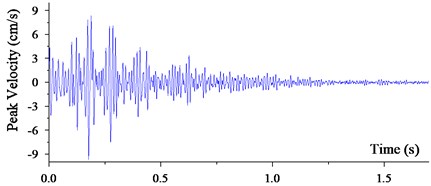
In this simulation, the solution age was set to 1.6s. After 138912 calculation steps, the simulation velocity curves with the peak velocity of 9.23 cm/s at the 300 m distance from the explosive source was shown in Fig. 17. At the same position, the monitoring velocity curves were shown in Fig. 18 with 9.28 cm/s peak velocity.
Fig. 17Prediction velocity curves in FLAC3D
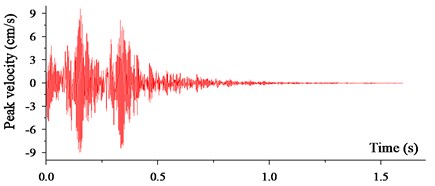
Fig. 18Monitoring velocity curves by in-situ recorder
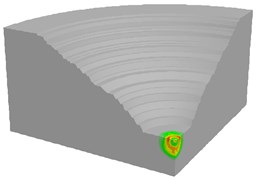
As per the contrastive analysis of Fig. 17 and Fig. 18, it is easy to know that two velocity curves have a similar peak value and the same attenuation law. It can be verified that the numerical simulation is accurate enough to predict the blasting vibration energy. After extracting the blasting velocity field in the simulation model, the contours at different solution age were shown in Fig. 19.
Fig. 19Contours of blasting velocity field at different solution age
a) 50 ms
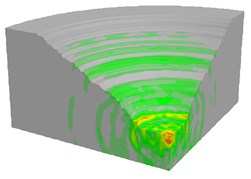
b) 110 ms
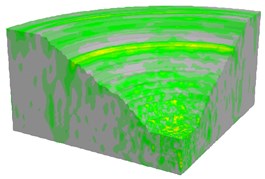
c) 310 ms
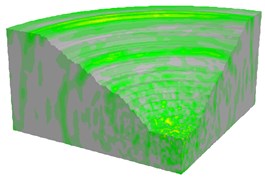
d) 650 ms
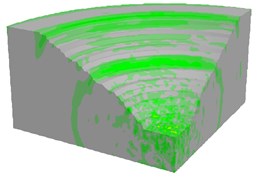
e) 1000 ms
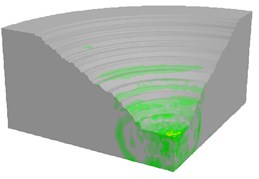
f) 1500 ms
As shown in Fig. 18, the blasting vibration wave propagated as a spherical wave from the explosion center to a distant position, which depended on the setting of equivalent elastic boundary. Due to the millisecond delay blasting method and superposition of blasting segments, there was an obvious interval of wave strength. Also, the largest vibration field occurred at the time of four or five segments blasting by analyzing the blasting velocity contour versus time.
In this simulation, 15 monitoring points were set at the site of key block in the slope, thereby, 15 historical curves were predicted to provide the value of peak velocity with different distances from the explosive source. The fitted curve was shown in Fig. 20,
4.4. Safety criterion of slope stability
Considering the heights from the open pit bottom and volume ratio between the overlying rock and key block rock, and calculating each part energy by using the above introduced method and equations, the safety criterion of slope stability could be provided as shown in Fig. 21.
In Fig. 21, if the input energy density is larger than the damaged threshold energy density, which was obtained by the SHPB impact test, the key block rock would be fractured. So, it is easy to know that the key block under fourfold status will be fractured at 260 m above the open pit bottom elevation. This situation would appear at 345 m from the elevation for the threefold status.
Fig. 20Predicted peak velocity value and its fitted curve
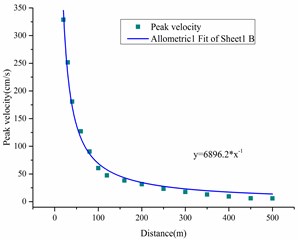
Fig. 21Predicted peak velocity value and its fitted curve
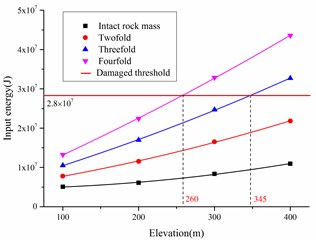
Also, after deducting the friction dissipative energy, which was confirmed in Section 4.1, the instability velocity could be predicted. Taking the fourfold status at 400 m elevation as example, the remainder energy density after key block damaged is 1.5×10⁷ J. Taking out the friction dissipative energy density 1.1×10⁷ J, the kinetic energy density is 0.4×10⁷ J. According to the theorem of kinetic energy, the initial velocity of slip rock mass could be calculated, and the value is 0.195 m/s.
5. Conclusions
With adopting the theoretical analysis, laboratory test and numerical simulation methods, the instability kinetic energy could be evaluated by the energy conservation law, and then the instability velocity could be calculated to predict the instability grade of slope in this paper.
Based on large quantities of exposure joints and fissures monitored, the tendency of the preponderant joints and fissures’ group were 120 degrees and 220 degrees. Considering the actual engineering geology and slope structure and the in-situ joints and fissures’ monitoring data, it can be confirmed that the Washan open pit slope is a key block controlling slope.
Taking an advantage of the energy conservation law, the applied energy and dissipative energy of key block can be concluded as the potential energy, blasting vibration energy, fractured dissipative energy, friction dissipative energy and kinetic energy of instability. Each part of energy could be obtained by using the above methods and lab test.
After analyzing each part energy density, the safety criterion of slope stability could be presented. Even the velocity of slip rock mass could be calculated. It can be seen that this energy analysis method is more accurate and clearer than the traditional safety factor.
References
-
Cha K. S., Kim T. H. Evaluation of slope stability with topography and slope stability analysis method. KSCE Journal of Civil Engineering, Vol. 15, Issue 2, 2011, p. 251-256.
-
Garevski M., Zugic Z., Sesov V. Advanced seismic slope stability analysis. Landslides, Vol. 10, 2013, p. 729-736.
-
Pinheiro M., Sanches S., Miranda T., Neves A., Tinoco J., Ferreira A., Correia A. G. A new empirical system for rock slope stability analysis in exploitation stage. International Journal of Rock Mechanics and Mining Sciences, Vol. 76, 2015, p. 182-191.
-
Johari A. Khodaparast A.R. Analytical stochastic analysis of seismic stability of infinite slope. Soil Dynamics and Earthquake Engineering, Vol. 79, 2015, p. 17-21.
-
Mohammed M., Wan L., Wei Z. A. Slope stability analysis of southern slope of Chengmenshan copper mine, China. International Journal of Mining Science and Technology, Vol. 25, 2015, p. 171-175.
-
Li D. Q., Qi X. H., Cao Z. J., Tang X. S., Phoon K. K., Zhou C. B. Evaluating slope stability uncertainty using coupled Markov chain. Computers and Geotechnics, Vol. 73, 2016, p. 72-82.
-
Li Y. P., Wang Y. Q., Ma C., Zhang H. L., Wang Y. J., Song S. S., Zhu J. Q. Influence of the spatial layout of plant roots on slope stability. Ecological Engineering, Vol. 91, 2016, p. 477-486.
-
Nian T. K., Jiang J. C., Wang F. W., Yang Q., Luan M. T. Seismic stability analysis of slope reinforced with a row of piles. Soil Dynamics and Earthquake Engineering, Vol. 84, 2016, p. 83-93.
-
Zhang K., Cao P., Bao R. Progressive failure analysis of slope with strain-softening behaviour based on strength reduction method. Journal of Zhejiang University – Science A (Applied Physics and Engineering), Vol. 14, Issue 2, 2013, p. 101-109.
-
Lin H., Zhong W. W., Cao P., Liu T. Y. Variational safety factors and slip surfaces of slope using three-dimensional strength reduction analysis. Journal Geological Society of India, Vol. 82, 2013, p. 545-552.
-
Yang G. H., Zhong Z. H., Fu X. D., Zhang Y. C., Wen Y., Zhang M. F. Slope analysis based on local strength reduction method and variable-modulus elasto-plastic model. Journal of Central South University, Vol. 21, 2014, p. 2041-2050.
-
Tschuchnigg F., Schweiger H. F., Sloan S. W. Slope stability analysis by means of finite element limit analysis and finite element strength reduction techniques. Part I: Numerical studies considering non-associated plasticity. Computers and Geotechnics, Vol. 70, 2015, p. 169-177.
-
Jiang Q. H., Qi Z. F., Wei W., Zhou C. B. Stability assessment of a high rock slope by strength reduction finite element method. Bulletin of Engineering Geology and the Environment, Vol. 74, 2015, p. 1153-1162.
-
Kelesoglu M. K. The Evaluation of three-dimensional effects on slope stability by the strength reduction method. KSCE Journal of Civil Engineering, Vol. 20, Issue 1, 2016, p. 229-242.
-
Petit C., Mouthereau F. Steep topographic slope preservation by anisotropic diffusion: An example from the Neogene Têt fault scarp, Eastern Pyrenees. Geomorphology, Vol. 171, Issue 172, 2012, p. 173-179.
-
Han C. Y., Chen J. J., Xia X. H., Wang J. H. Three-dimensional stability analysis of anisotropic and non-homogeneous slopes using limit analysis. Journal of Central South University, Vol. 21, 2014, p. 1142-1147.
-
Stead D., Wolter A. A critical review of rock slope failure mechanisms: the importance of structural geology. Journal of Structural Geology, Vol. 74, 2015, p. 1-23.
-
Aghajani H. F., Salehzadeh H., Shahnazari H. Application of artificial neural network for calculating anisotropic friction angle of sands and effect on slope stability. Journal of Central South University, Vol. 22, 2015, p. 1878-1891.
-
Yang T. H., Shi W. H., Wang P. T., Liu H. L., Yu Q. L., Li Y. Numerical simulation on slope stability analysis considering anisotropic properties of layered fractured rocks: a case study. Arabian Journal of Geosciences, Vol. 8, 2015, p. 5413-5421.
-
Aghajani H. F., Salehzadeh H., Shahnazari H. Stability analysis of sandy slope considering anisotropy effect in friction angle. Sādhanā, Vol. 40, Issue 6, 2015, p. 1955-1974.
-
Liu Y. R., He Z., Leng K. D., Huang Y. Q., Yang Q. Dynamic limit equilibrium analysis of sliding block for rock slope based on nonlinear FEM. Journal of Central South University, Vol. 20, 2013, p. 2263-2274.
-
Greif V., Vlčko J. Key block theory application for rock slope stability analysis in the foundations of medieval castles in Slovakia. Journal of Cultural Heritage, Vol. 14, 2013, p. 359-364.
-
Zheng J., Kulatilake P. H. S. W., Shu B., Sherizadeh T., Deng J. H. Probabilistic block theory analysis for a rock slope at an open pit mine in USA. Computers and Geotechnics, Vol. 61, 2014, p. 254-265.
-
Bonilla-Sierra V., Scholtès L., Donzé F. V., Elmouttie M. DEM analysis of rock bridges and the contribution to rock slope stability in the case of translational sliding failures. International Journal of Rock Mechanics and Mining Sciences, Vol. 80, 2015, p. 67-78.
-
Zheng J., Kulatilake P. H. S. W., Deng J. H. Development of a probabilistic block theory analysis procedure and its application to a rock slope at a hydropower station in China. Engineering Geology, Vol. 188, 2015, p. 110-125.
-
Al-Defae A.H., Knappett J. A. Newmark sliding block model for pile-reinforced slopes under earthquake loading. Soil Dynamics and Earthquake Engineering, Vol. 75, 2015, p. 265-278.
-
Sun G. H., Zheng H., Huang Y. Y. Stability analysis of statically indeterminate blocks in key block theory and application to rock slope in Jinping-I Hydropower Station. Engineering Geology, Vol. 186, 2015, p. 57-67.
-
Zhang J., Huang H. W. Risk assessment of slope failure considering multiple slip surfaces. Computers and Geotechnics, Vol. 74, 2016, p. 188-195.
-
Mehdipour I., Ghazavi M., Moayed R. Z. Numerical study on stability analysis of geocell reinforced slopes by considering the bending effect. Geotextiles and Geomembranes, Vol. 37, 2013, p. 23-34.
-
Zhang Z., Han J., Ye G. B. Numerical investigation on factors for deep-seated slope stability of stone column-supported embankments over soft clay. Engineering Geology, Vol. 168, 2014, p. 104-113.
-
Li W. X., Qi D. L., Zheng S. F., Ren J. C., Li J. F., Yin X. Fuzzy mathematics model and its numerical method of stability analysis on rock slope of opencast metal mine. Applied Mathematical Modelling, Vol. 39, 2015, p. 1784-1793.
-
Li X. Y., Zhang L. M., Jiang S. H. Updating performance of high rock slopes by combining incremental time-series monitoring data and three-dimensional numerical analysis. International Journal of Rock Mechanics and Mining Sciences, Vol. 83, 2016, p. 252-261.
-
Cheng H. H., Zhang H., Zhu B. J., Shi Y. L. Finite element analysis of steep excavation slope failure by CFS theory. Earthquake Science, Vol. 25, 2012, p. 177-185.
-
Hsieh P. G., Ou C. Y., Lin Y. L. Three-dimensional numerical analysis of deep excavations with cross walls. Acta Geotechnica, Vol. 8, 2013, p. 33-48.
-
Bhandari T., Hamad F., Moormann C., Sharma K. G., Westrich B. Numerical modelling of seismic slope failure using MPM. Computers and Geotechnics, Vol. 75, 2016, p. 126-134.
-
Tang C. A., Li L. C., Xu N. W., Ma K. Microseismic monitoring and numerical simulation on the stability of high-steep rock slopes in hydropower engineering. Journal of Rock Mechanics and Geotechnical Engineering, Vol. 7, 2015, p. 493-508.
-
Li Q. W., Qiao L., Dasgupta G., Ma S. W., Wang L. P., Dong J. H. Blasting vibration safety criterion analysis with equivalent elastic boundary: based on accurate loading model. Shock and Vibration, Vol. 2015, 2015, p. 10.
-
He L., Ma G. W., Karp B., Li Q. M. Investigation of dynamic saint-venant’s principle in a cylindrical waveguide – experimental and numerical results. Experimental Mechanics, Vol. 55, 2015, p. 623-634.
About this article

This work is supported by the National Natural Science Foundation of China (Nos. 51704014, 51674013) and China Postdoctoral Science Foundation (Nos. 2016M600044, 2017T100039).
