Abstract
Studying the changes of the natural frequencies due to intermediate elastic support of laminated composites is usually need a lot of computational processes or difficult to estimate. The present study employs a new high performance method for natural frequency estimating in basalt fiber reinforced polymer (FRP) laminated, variable thickness plates with intermediate elastic support based on the finite strip transition matrix (FSTM) with response surfaces (RS) method. Author has found that the FSTM method is very effective. However, a large error of estimation remains for estimation of natural frequency due to the large number of an iteration implemented in FSTM algorithm to estimate the natural frequency. In the present study, a new data processing procedure is proposed to improve performance of estimations of natural frequency. The estimation responses for four of classical boundary conditions at the plate ends with different elastic restraint coefficients () are computed to obtain the first six frequency parameters (). As a result, the method reveals excellent performance of estimations of natural frequencies.
1. Introduction
The classical and non-classical plates (i.e. Continuous and with intermediate stiffeners plates) are most common in a wide range of engineering fields such as aerospace, structures, vehicles and marine industries. In general, the approximate [1-10] or numerical [11-14] method must be used to compute the natural frequencies and find mode shapes for different boundary conditions for plate ends.
The author has investigated applicability of the FSTM method through a semi-analytical; natural frequency was estimated for basalt FRP laminated, variable thickness plates [15] and with intermediate elastic support. However, a large error of estimation remains due to a lot of computational processes must be performed for estimation of natural frequency. This is the main drawback of the FSTM method. Author also has already applied a predictive model for natural frequency in terms of fiber orientations is then developed using artificial neural networks (ANNs) to improve the estimations performance of FSTM by decreasing the effort to obtain frequency parameters in order to treatment the main drawback of the FSTM method [16]. The developed model via ANNs is trained and tested with a number of the FSTM results then used this predictive model for predicting non- FSTM data not included in FSTM evaluation. An ANNs model is shown to be very effective for predicting the natural frequency of basalt FRP laminated, variable thickness plates with intermediate elastic support.
In light of those difficulties, the present study uses RS method of various elastic restraint coefficients () of basalt FRP laminated, variable thickness plates with intermediate elastic support (Fig. 1) to investigate effect of intermediate elastic support on the natural frequencies; furthermore, an improvement to obtain higher estimation performance is proposed for the FSTM method before making response surfaces. This new method is applied to estimate natural frequencies of plate type under four different ends of the plate; performance of the new estimation method is evaluated analytically herein.
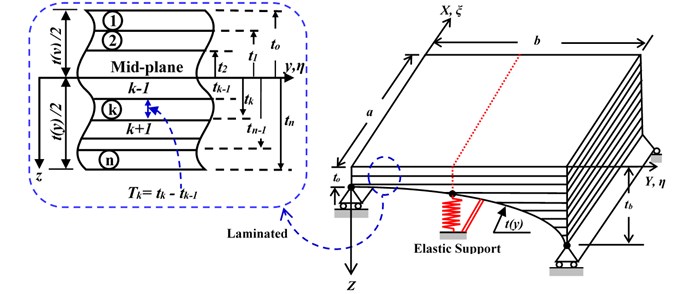
Fig. 1The geometrical model of Basalt FRP laminated variable thickness rectangular plate with intermediate elastic support
2. Governing equations
The formula that governing the dynamics of presented plate model in this study using the classical deformation theory in terms of the plate deflection after normalized to non-Dimensional variables and can be written as: [15, 17]:
where: is the aspect ratio, and:
is the material density, is the flexural rigidities matrix are present by:
where as shown in Fig. 1 is measuring between the middle-plane approbating to to the layer bottom . And are the plane stress transformed reduced stiffness coefficients, they can be computed in terms of the longitudinal and transverse Young’s moduli , , plane shear modulus of elasticity and Poisson coefficients and as:
2.1. Boundary conditions
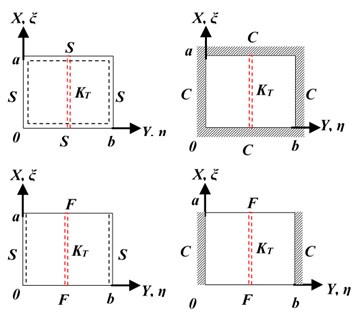
In this study, author applied new method to estimate natural frequencies of plate type under four different classical boundary conditions at the ends of the plate are SSSS, CCCC, SSFF and CCFF (see Fig. 2).
Since the treatment of the intermediate elastic line support conditions are the goal of the present study we can see in Fig. 1, the intermediate elastic line support, , the solution of the governing must be continuous at this line, i.e. [2]:
Fig. 2Schematic representation of different plate ends
3. Finite strip transition matrix (FSTM) with response surfaces (RS) method
3.1. Finite strip transition matrix (FSTM) method
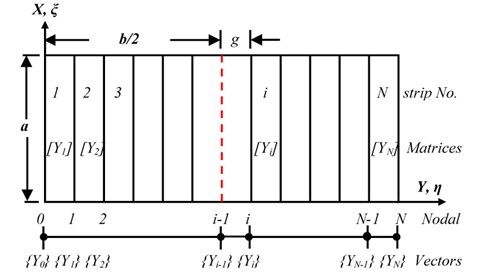
In this approach, the plate is divided into space of strips between the ends of the plate as shown in Fig. 3. Each plate strips are considered as beam strip, and we can represent the displacement between individual strips by solve the shape function , this shape function can be assumed after normalized to non-Dimensional variables and depending on the unknown function to be determined and basic function in -direction, in the form:
3.2. Response surface (RS) method
The RS is more dependent tool for quality engineering areas [18, 19]. The methodology of the RS have two benefits, the approximately of the inverse problems can be solved without take in your account the engineering modeling, and the approximately results of RS can be estimated using powerful statistical tools. In this estimation work, the methodology of the RS was applied to predict the from Eigen function. For widly applications of the RS, the functions for the approximately of the inverse problems are polynomials, in order to simplify. For the cases of quadratic polynomials, the RS is addressed as follow:
where: is the number of strips. In this case, there are discrete longitudinal strips spanning (beam strips), is the estimation results of the by RS method and the coefficients are obtained with the least square errors method [18, 19]. The estimations of the by RS function in Eq. (6) is expressed as follow:
where: , are a standard eigenvalue can be obtained from the shape function by FSTM, 1, 2, 3,…, , 1, 2, 3,…,
Fig. 3FSTM model on plate
In the case that varies , the total number of parameters is , the RS can be computed as follows using matrix expression:
where:
where: is an error vector. The unbiased estimator of the coefficient vector is obtained using the well-known least square error method as follows:
The variance-covariance matrix of the is obtained as follows:
where: the is the error of . The estimated value of is obtained as follows:
is a square sum of errors, and expressed as follows:
In order to judge the goodness of the approximation of the RS, the adjusted coefficient of multiple determination is used:
where: is the total sum of squares:
The value of is equal to or lower than 1.0. A higher value of implies a better fit. When the RS shows a very good fit, approaches 1.0. A good fit of the RS means that the RS gives good estimations for the FSTM technique used for the regression. Lower values means poorer estimations and the error band of the estimated result is wider.
4. Results and discussion
In this part, the present method is used to estimate the natural frequency of the plate was presented in Fig. 1. The intermediate elastic line support at one direction and we can be expressed as follow, , is translational stiffness. The plate model was designed of five symmetrically, angle-ply, laminates with the fiber angles is [45°/–45°/45º/–45°/45°] and has linear variable thickness, as form , is the tapered ratio (see Fig. 1). The physical and mechanical properties of the basalt FRP laminate composite plate are shown in Table 1. The frequency parameter is evaluated in non-dimensional form, expressed as: .
Table 1Physical and mechanical properties of the basalt FRP
96.74 GPa | 22.55 GPa | 10.64 GPa | 8.73 GPa | 0.3 | 0.6 | 2700 kg/m3 |
4.1. The presented study verification
It is very important from the author to verify for the proposed method to decide whether his suggested method is suitable or not by compute the first six frequencies and compared with available results in literatures.
Table 2 shows a comparison between the first six frequency parameters from presented study and the corresponding results from literatures [5, 20-22]. literatures are used isotropic, square 1.0), uniform thickness (0) plates with a mid-line support in each direction, the physical and mechanical properties of the plate material are As results we can see a very close agreement is observed with a high value of adjusted coefficient .
Table 2Comparison between the first six frequency parameters Ω=ρtω2a4/D1/2
SSSS | 78.957 | 94.590 | 94.590 | 108.240 | 197.392 | 197.392 | |
Ref. [5] | 1.0 | 78.957 | 94.590 | 94.590 | 108.240 | 197.392 | 197.392 |
Ref [20] | 0.98 | 78.96 | 94.68 | 94.72 | 108.44 | 197.40 | 198.96 |
Ref [21] | 0.99 | 78.958 | 94.826 | 94.826 | 108.41 | 197.50 | 197.50 |
Ref [22] | 1.0 | 78.957 | 94.585 | 94.585 | 108.22 | 197.39 | 197.33 |
CCCC | 108.229 | 127.417 | 127.417 | 144.109 | 242.818 | 242.778 | |
Ref [5] | 1.0 | 108.299 | 127.417 | 127.417 | 144.109 | 242.818 | 243.778 |
4.2. The proposed technique results
Fig. 4 presents the amount of changes of the natural frequencies due to intermediate elastic support of laminated, the plate has the aspect ratio 0.5 and tapered ratio 0.5. As shown in the figure, for each frequency of six frequencies, we can observe the increases in the frequency with the increasing of the value of elastic restraint coefficient ()
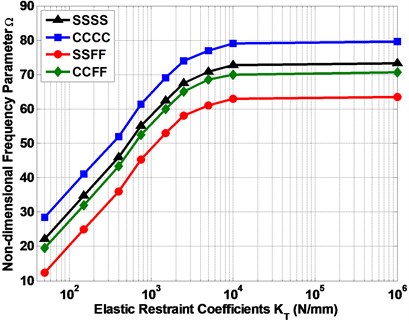
Fig. 5 presents changes of the vibration behavior due to variation in the types of the plate ends (SSSS, CCCC, SSFF and CCFF). As shown in the figure, we can see the variation of the frequencies values, where, the plate with ends of fully clamped (CCCC) and semi-simply supported (SSFF) have been recorded the higher and lower values of the frequencies respectively, and the other types of the plate ends (SSSS and CCFF) are located in intermediate.
Fig. 6 represents the estimation results of the first six frequencies by RS. The of estimation results are 0.999, 0.996, 0.987 and 0.964 for SSSS, CCCC, SSFF and CCFF plate respectively.
Fig. 4The relation between non-dimensional frequencies parameter (Ω) and elastic restraint coefficient (KT)
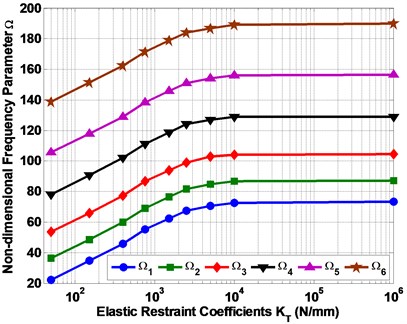
Fig. 5The effect of the variation boundary conditions on non-dimensional frequencies parameter (Ω)
All of the estimation results are plotted on the diagonal line (Fig. 6) to observe the performances of the present RS method to estimate non-dimensional frequencies (). The error band is defined as the maximum error of the estimated . The error band from the diagonal line is less than 0.01 for all types of boundary conditions. The results of the estimated is presented in Table 3. As a result, the RS gave good estimations for FSTM to calculate in composite plate.
Table 3The first six frequencies of Basalt FRP rectangular plate with intermediate elastic line support
SSSS | 50 | 22.2 | 36.2 | 53.6 | 78.2 | 105.6 | 138.7 | 0.999 |
150 | 34.7 | 48.7 | 66 | 90.8 | 118 | 151.3 | 0.999 | |
400 | 45.9 | 59.9 | 77.3 | 102 | 129 | 162.4 | 0.999 | |
750 | 55.1 | 69.2 | 86.6 | 111.2 | 138.5 | 171.6 | 1.0 | |
1500 | 62.5 | 76.5 | 94 | 118.6 | 146 | 179 | 1.0 | |
2500 | 67.5 | 81.6 | 99 | 124 | 151 | 184 | 1.0 | |
5000 | 70.8 | 84.9 | 103 | 127 | 154 | 187 | 1.0 | |
10000 | 72.7 | 86.8 | 104 | 129 | 156.2 | 189 | 1.0 | |
1E+06 | 73.2 | 87.2 | 104.6 | 129 | 156.6 | 190 | 1.0 | |
CCCC | 50 | 28.5 | 46.5 | 68.9 | 100.5 | 135.6 | 178 | 0.988 |
150 | 41 | 59 | 81.4 | 113 | 148 | 190.6 | 0.992 | |
400 | 52 | 70 | 92.5 | 124 | 160 | 201 | 0.995 | |
750 | 61.4 | 79.4 | 101.7 | 133.4 | 168.5 | 212 | 0.998 | |
1500 | 69 | 87 | 110 | 141 | 176 | 218.5 | 0.999 | |
2500 | 74 | 92 | 114 | 146 | 181 | 223.6 | 0.999 | |
5000 | 77 | 95 | 117.6 | 149 | 184.3 | 227 | 1.0 | |
10000 | 79 | 97 | 119.4 | 151 | 186.2 | 229 | 1.0 | |
1E+06 | 79.5 | 97.5 | 120 | 151.5 | 187 | 229.4 | 1.0 | |
SSFF | 50 | 12.3 | 20.1 | 29.7 | 43.4 | 58.5 | 77 | 0.967 |
150 | 25 | 32.6 | 43 | 56 | 71 | 89.5 | 0.973 | |
400 | 36 | 43.8 | 53.5 | 67 | 82.5 | 100.7 | 0.979 | |
750 | 45.2 | 53.1 | 62.6 | 76.3 | 91.4 | 109.8 | 0.987 | |
1500 | 53 | 60.5 | 70 | 83.8 | 99 | 117 | 0.991 | |
2500 | 58 | 65.7 | 75 | 89 | 104 | 122 | 0.994 | |
5000 | 61 | 69 | 78.6 | 92 | 107.6 | 125.6 | 0.997 | |
10000 | 63 | 71 | 80 | 94 | 109 | 127.7 | 0.999 | |
1E+06 | 63.5 | 71.4 | 81 | 94.8 | 109.5 | 128 | 1.0 | |
CCFF | 50 | 19.6 | 32 | 47.4 | 69.2 | 93.4 | 122.7 | 0.899 |
150 | 32 | 44.8 | 60 | 82 | 106 | 135.4 | 0.926 | |
400 | 43.4 | 55.7 | 71 | 93 | 117 | 146.8 | 0.94 | |
750 | 52.5 | 65 | 80.4 | 102.2 | 126.4 | 155.7 | 0.958 | |
1500 | 60 | 72.7 | 88 | 110 | 133.8 | 163 | 0.972 | |
2500 | 65 | 77.9 | 93 | 114.8 | 139 | 168 | 0.989 | |
5000 | 68.6 | 81 | 96 | 118 | 142 | 171.7 | 0.999 | |
10000 | 70 | 83 | 98 | 120 | 144 | 173.5 | 1.0 | |
1E+06 | 70.6 | 83.4 | 98.7 | 121 | 144.6 | 174 | 1.0 |
Fig. 6The estimation results of non-dimensional frequency parameter Ω
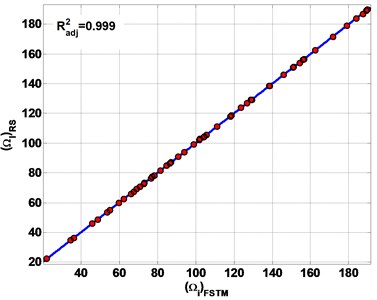
a) SSSS
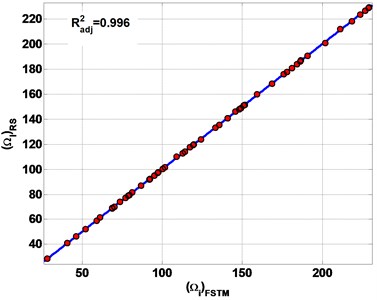
b) CCCC
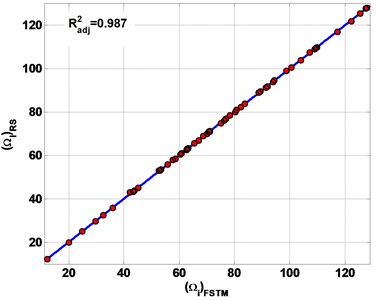
c) SSFF
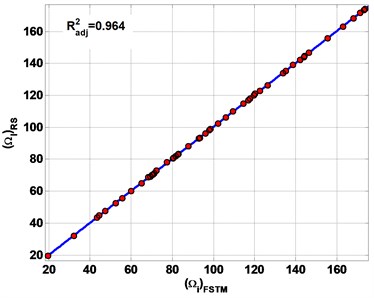
d) CCFF
5. Conclusions
In the present study, the FSTM with RS approach is applied. The method has successfully estimation of the natural frequency () in one step of computing using the FSTM output of standard eigenvalue, in order to eliminate the iteration that implemented in FSTM algorithm to compute the natural frequency and decrease the error of estimation. Based on the FSTM results and the results estimated by RS, the following conclusions are drawn for basalt FRP laminated variable thickness rectangular plates with intermediate elastic support.
1) The RS data are provided excellent estimations of the natural frequency of basalt FRP plates for each case of boundary conditions and different .
2) The increases in the frequency with the increasing of the value of elastic restraint coefficient () is observed.
3) On other hand, the variation of the frequencies values, where, the plate with ends of fully clamped (CCCC) and semi-simply supported (SSFF) have been recorded the higher and lower values of the frequencies respectively, and the other types of the plate ends (SSSS and CCFF) are located in intermediate.
4) The RS technique could estimate with high adjusted coefficient for 50 are 0.999, 0.988, 0.967 and 0.899 for SSSS, CCCC, SSFF and CCFF plate respectively, for 1E+06 are 1.0 for each boundary conditions.
5) It is observed that the adjusted coefficient increases with increasing values of of intermediate elastic support.
6) The boundary condition SSSS has the highest performance of estimate , the boundary condition CCFF has the lowest performance of estimate , while the other boundary conditions are laid in between, with descending order of CCCC and SSFF respectively.
7) As a result, the method reveals excellent performance of estimations of natural frequencies.
8) Finally, author have revealed that the response surfaces are better than artificial neural networks for this inverse problem.
References
-
Xiang Y., Wei G. W. Exact solutions for multi-span rectangular Mindlin plates. Journal of Vibrations and Acoustics, Vol. 124, 2002, p. 545-551.
-
Abrate S., Foster E. Vibration of composite plates with intermediate line supports. Journal of Sound and Vibration, Vol. 179, 1995, p. 793-815.
-
Cheung Y. K., Zhou D. Vibration of rectangular plates with elastic intermediate line-supports and edges constraints. Journal of Thin-walled Structures, Vol. 37, 2000, p. 305-331.
-
Liew K. M., Wang, C. M. Vibration studies on skew plates: treatment of internal line supports. Journal of Computer and Structures, Vol. 49, Issue 6, 1993, p. 941-951.
-
Cheung Y. K., Zhou D. Vibration analysis of symmetrically laminated rectangular plates with intermediate line supports. Journal of Computer and Structures, Vol. 79, 2001, p. 33-41.
-
Xiang S., Jiang S., Bi Z., Jin Y., Yang M. A nth-order meshless generalization of Reddy’s third order shear deformation theory for the free vibration on laminated composite plates. Journal of Composite Structures, Vol. 93, 2011, p. 299-307.
-
Thai H., Kim S. Free vibration of laminated composite plates using two variable refined plate theory. International Journal of Mechanical Sciences, Vol. 52, 2010, p. 626-633.
-
Ovesy H. R., Fazilati J. Buckling and free vibration finite strip analysis of composite plates with cutout based on two different modeling approaches. Journal of Composite Structures, Vol. 94, 2012, p. 1250-1258.
-
Dozio L. In-plane free vibrations of single-layer and symmetrically laminated rectangular composite plates. Journal of Composite Structures, Vol. 93, 2011, p. 1787-1800.
-
Asadi H., Aghdam M. M., Shakeri M. Vibration analysis of axially moving line supported functionally graded plates with temperature-dependent properties. Journal of Mechanical Engineering Science, Vol. 228, Issue 6, 2014, p. 953-969.
-
Thinh T. I., Binh B. V., Tu T. M. Bending and vibration analysis of multi-folding laminate composite plate using finite element method. Vietnam Journal of Mechanics, Vol. 34, Issue 3, 2012, p. 185-202.
-
Ducceschi M. Nonlinear Vibrations of Thin Rectangular Plates: A Numerical Investigation with Application to Wave Turbulence and Sound Synthesis. Ph.D. Thesis, ENSTA-Paris Tech, UME, Palaiseau, 2014.
-
Yadav D. P. S., Sharma A. K., Shivhare V. Free vibration analysis of isotropic plate with stiffeners using finite element method. Journal of Engineering Solid Mechanics, Vol. 3, 2015, p. 67-176.
-
Küçükrendeci I., Morgül Ö. K. The effects of elastic boundary conditions on the linear free vibrations. Journal of Scientific Research and Essays, Vol. 6, Issue 19, 2001, p. 3949-3958.
-
Al Tabey W. A. Vibration analysis of laminated composite variable thickness plate using finite strip transition matrix technique and MATLAB Verifications. InTech, 2014, p. 283-620.
-
Altabey W. A. Prediction of natural frequency of basalt fiber reinforced polymer (FRP) laminated variable thickness plates with intermediate elastic support using artificial neural networks (ANNs) method. Journal of Vibroengineering, Vol. 19, Issue 5, 2017, p. 3668-3678.
-
Chakraverty S. Vibration of Plates. CRC Press, Taylor and Francis Group, 2009.
-
Myers R., Montgomery D. C. Response Surface Methodology Process and Product Optimization Using Designed Experiments. 2nd Ed., Wiley-Interscience, New York, 2002.
-
Jiang S., Li D., Zhou C., Zhang L. Capabilities of stochastic response surface method and response surface method in reliability analysis. Structural Engineering and Mechanics, Vol. 49, Issue 1, 2014, p. 111-128.
-
Wu C. I., Cheung Y. K. Frequency analysis of rectangular plates continuous in one or two directions. Journal of Earthquake Engineering Structure Dynamics, Vol. 3, 1974, p. 3-14.
-
Kim C. S., Dickinson S. M. The flexural vibration of line supported rectangular plate systems. Journal of Sound Vibration, Vol. 114, 1987, p. 29-42.
-
Leissa A. W. The free vibration of rectangular plates. Journal Sound Vibration, Vol. 31, 1973, p. 257-93.
Cited by
About this article

