Abstract
This paper presents an experimental method for damage detection of bridge piers as the basic and strategic elements in such engineering structures. Definition of percentage and location of damage are considered as initial data to solve damage detection problems. Nowadays, regarding the development of inverse methods for damage detection such as definition of objective functions and optimization approaches, the present experimental study can be utilized as initial stage of such methods. In this study, three 1/3 scaled test specimens of RC bridge piers are casted. Spacing of transverse reinforcements is considered as the main variable parameter for test specimens. The constant vertical loads and low vibrations as cyclic loads are applied to the specimens and the results including the hysteresis behavior of specimens and the backbone curves are investigated. The damage percentage per first four steps is also extracted to utilize the results using Banon-Veneziano method. Also increase in lateral displacement during first steps initiated micro cracks propagated along nearly one tenth of the piers length (0.1L) above the foundation. The cracks were propagated after an increase in displacement from fourth step and were separately observed. Finally, the ultimate failures were observed along nearly one fifth of the piers length (0.2L). Finally, the results revealed that the proposed method is an appropriate method to determine the severity of damage and its location as the primary information in reverse-optimization methods.
1. Introduction
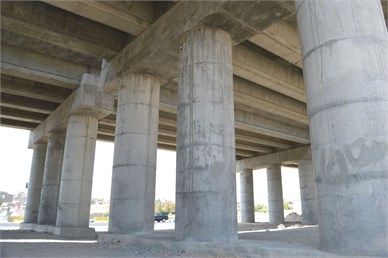
Bridges are the essential and strategic elements in structural engineering that undergo vibrations under operational conditions like the effects of traffic, wind and other low vibrations called ambient vibrations. It has been estimated that about 2.5 million bridges are operated by global transportation network all over the world [1]. Therefore, the required maintenance shall be applied during the life time of the bridges (Fig. 1) after the structural efficiency or structural imperfection of the bridges is defined by technical inspections. Lack of structural efficiency means that some elements of the bridges require periodic control or repair and the structural non-efficiency does not mean the lack of safety or the probability of the total collapse of the bridges but indicate the necessity of the structural monitoring, periodic inspections and rehabilitation of the bridges.
The process of identification and damage detection in structures especially like bridges is based on dynamic characteristics of structure as functions of physical properties. Therefore, variation in structural physical properties due to applied damages can change the dynamic characteristics. Health monitoring and performance integration of bridges are implemented by behavior monitoring and records of dynamic characteristics. Damage detection is performed directly and based on detected variations in dynamic characteristics while the determination of damage level and intensity is generally expressed as an inverse problem. The structural damages can be essentially linear (variation in structural material properties under linear elastic response) or nonlinear (Opening and closing of cracks proportional to structural deformations) [2]. When the damages are applied to a structure, the structural stiffness is decreased while the mass of the structure remains constant; the displacements at different parts of the structure are increased due to a decrease in stiffness under applied loads. On the other hand, variation in stiffness and ductility of the structure can make changes in dynamic characteristics such as natural frequencies and mode shapes. Generally, the damage modeling methods can be divided into three global categories: local stiffness degradation, application of separate spring element and also complicated models based on fracture mechanics. The local stiffness degradation method is the most convenient modeling method applied by shear modulus or elastic modulus degradation, reduction in moment of inertia of the section or applying a split as non-continuity in finite element model. Based on a previous research, variation in modal parameters of the structure on RC frames due to propagation of cracks in concrete revealed that observation threshold of the initial cracks corresponds to 15 % reduction in system stiffness showing realistic and good performance of such a method to be applied assuming monotonic stiffness degradation in concrete elements [3].
Fig. 1View of a RC bridge requiring periodic inspections and maintenance operations
Generally, the structural damages are considered as stiffness degradation in accordance with Eq. (1) [4]:
where, is the stiffness of the damaged structure, is the stiffness of the intact structure and is stiffness degradation coefficient. Additionally, the damage can be modeled by elastic modulus degradation in numerical equations or reduction in structural cross section in experimental equations. Kourehli et al. widely used this method to model the damages imposed to the beams, frames and trusses [5, 6]. Rasouli et al. also used this method for steel and RC beams and frames [7, 8]. Constant stiffness degradation in damages has been the similar assumption in all of these studies.
The experimental studies have been based on model geometry and various loading conditions. Hindi et al. tested 12 column specimens with cross and regular spiral reinforcements under vertical and horizontal cyclic loads and investigated different failures such as failure of longitudinal and transverse reinforcements and crushing of concrete. The influence of spacing and types of transverse reinforcements on failure of longitudinal and transverse reinforcements was included in the study finally concluding the superiority of cross spiral rather than other types of transverse reinforcements [9].
Wang et al. experimentally studied the flexural-torsional effects of 12 specimens of bridge piers under seismic loads. Using eight specimens with spiral transverse reinforcements, one specimen with cross spiral and one specimen with circular transverse reinforcements, they determined the values and locations of cracks in three modes including only flexural loads, torsions and hybrid effects. While the flexural loads were only applied, the damage was initiated from bottom of the pier and when the torsion was coincided with flexural loads, the damage moved up and extended due to an increase in torsions and will continue until the damage is only propagated in mid-span element and not at the bottom of the pier due to only torsion (no flexural load) [10].
No damage output has been presented in experimental studies to be used in optimization inverse problems. The present paper tries to conduct experimental work to obtain appropriate outputs to be applied in optimization inverse problems such that the behavior of specimens is experimentally investigated under cyclic loads and the results comprising hysteresis curves and backbone curves are extracted. Then these data are used as input data to determine damage index based on conditions while damage percentage and location are obtained in initial cycles to be utilized as initial data to use damage detection inverse method such as optimization methods. For a better comparison with previous experimental results, this study used only the circular transverse reinforcements with different three types of spacing.
2. Experimental program
2.1. Design and construction of pier specimens
All specimens were designed based on AASHTO [11] standard calculating the values of longitudinal and transverse reinforcements and then 1/3 scale specimens were casted due to experimental limitations. The spacing of transverse reinforcements was considered as main test parameter of specimens. According to Fig. 2, each specimen consists of foundation, pier and cap. At the first part, the foundation with geometrical dimensions (length, width and thickness) of 600 mm, 600 mm and 300 mm, respectively reinforced with two reinforcement mesh Ø12 with spacing of 150 mm at the top and bottom was considered. The fixed joint of the foundation to the laboratory floor was considered with four bolts having diameter of 30 mm with axis spacing equal to 360 mm along lateral loads and 130 mm perpendicular to the loading. Fig. 3 shows the details of foundation connection to the floor. At the second part, the piers having length and dimeter of 900 mm and 250 mm respectively were implemented. The longitudinal reinforcements comprising six rebar Ø12 (longitudinal reinforcement to cross section ratio equal to 0.014) having yield stress of 400 MPa and circular transverse reinforcements comprising rebar Ø6 having yield stress of 300 MPa were applied. At the third part, the cap having length, width and height equal to 1000 mm, 400 mm and 300 mm, respectively was designed and reinforced for loading applications.
Fig. 2Properties and cross section of bridge pier test specimens
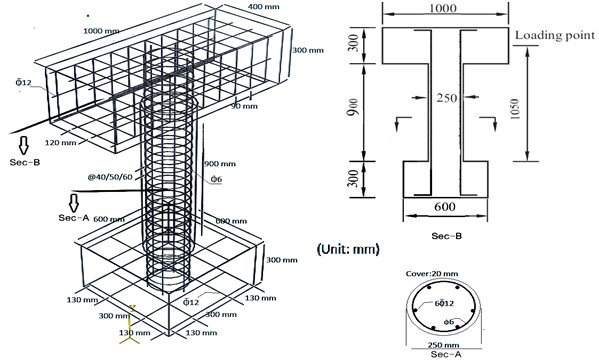
Considering the spacing of transverse reinforcements as the test parameter, the piers were designed and tested in three modes to show the behavior of the specimens and applied damages. Table 1 shows the nominations of the specimens based on spacing of circular stirrups in first, second and third cases equal to 40 mm, 50 mm and 60 mm, respectively. As mentioned above, the diameter of designed full-scale main piers was 750 mm but 1/3 scaled specimens were designed and casted due to economical and experimental limitations. The thickness of concrete cover of RC core structures based on typical scale is equal to 20 mm.
Fig. 3Properties of fixed connection of foundation to the floor
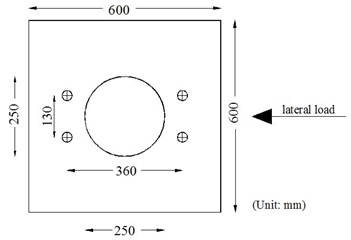
Table 1Details of tested piers
No | Pier ID | Type of transverse reinforcements | Spacing of transverse reinforcements (mm) |
1 | p4 | Circular | 40 |
2 | p5 | Circular | 50 |
3 | p6 | Circular | 60 |
2.2. Properties of materials
The grading of concrete materials was prepared in accordance with allowable limit of ASTM-C33 [12] and the required concrete was casted based on target strength of 18 MPa. The cylinder specimens having diameter and height of 150 mm and 300 mm, respectively, were prepared from all casted piers and compression tests were implemented after 28 days leading to the mean values of approximately 18.2 MPa. Considering the workability, the concrete slump was obtained 60 mm.
2.3. Testing instrumentations
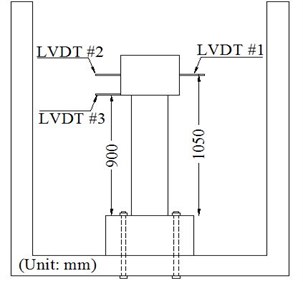
Three linear variable differential transformers (LVDT) having length of 100 mm were installed. Two of them were located at the height of 1050 mm above the foundation (LVDT#1 and LVDT#2) as the main LVDTs and the other was installed at the height of 900 mm above the foundation for additional monitoring (LVDT#3). The locations of LVDTs are shown in Fig. 4.
Fig. 4Test instrumentation used for casted specimens
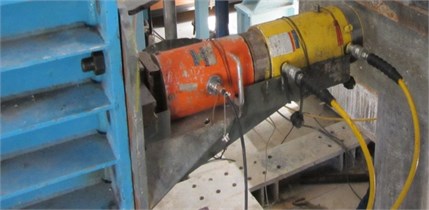
After fixing the specimens to the floor, a vertical constant load equal to 17 kN was applied to the specimens using 1000 kN hydraulic jack according to loading protocol as shown in Fig. 5. The specimens were tested within two days at Tarbiat Modares University in Tehran. The test set up and loading of specimens are shown in Fig. 6 while Fig. 7 shows the hydraulic jack with capacity of 1000 kN used in the tests.
Fig. 5Protocol of lateral loading [10]
![Protocol of lateral loading [10]](https://static-01.extrica.com/articles/18997/18997-img5.jpg)
Fig. 6Test set up and loading of test specimens
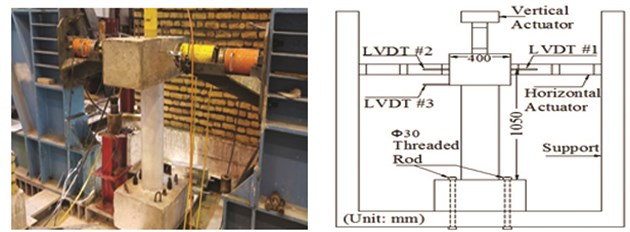
Fig. 7Hydraulic jack with capacity of 1000 kN used in the tests
2.4. Test results
2.4.1. General behavior
Crushing of the concrete due to lack of confinement or the failure of the transverse reinforcements and buckling of the longitudinal reinforcements may cause failure of the concrete columns [13]. Firstly, the damages were observed as micro cracks due to incremental loading to the piers during the first cycle and the crack width was increased after higher cycles. Finally, the plastic hinge and total failure were developed at the piers and then the stiffness of piers reduced. Generally, it was revealed that the piers with closer spacing of transverse reinforcements show better ductility.
2.4.2. Hysteretic behavior
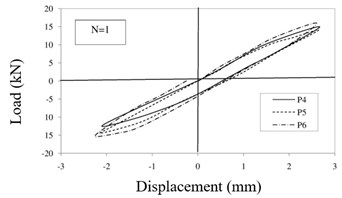
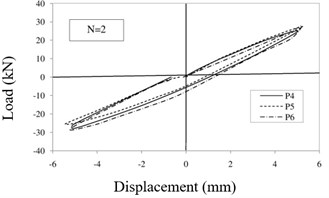
While the ambient vibration was considered as one of the factors causing the slight damages and also the necessity of structural health monitoring and appropriate prediction of damages, this paper tried to investigate the initial loading stages and first steps based on specific protocols to be applied to solve the damage detection and localization which is generally considered as stiffness degradation percentage such as elastic modulus degradation. Therefore, this research investigated on the four first steps of displacements equal to 2.5, 5, 10 and 15 mm which initiated micro cracks propagated to identify the damage detection and localization based on obtained results and experimental data of this research and proportionate to types of problems using inverse damage indexes. The hysteresis curves of specimen p4, p5 and p6 for each step are shown in Fig. 8 to properly judge the results. Considering the protocol, only the first four steps are investigated in this research for damage detection. Fig. 8(a) shows that the enclosed area by hysteresis loop during the first step for specimen p4, p5 and p6 is equal to 26.64 kN.mm, 35.72 kN.mm, 37.52 kN.mm, respectively. while the calculated the enclosed area by hysteresis loop during the second step (Fig. 8(b)) is equal to 79.32 kN.mm, 82.32 kN.mm, 94.08 kN.mm, respectively and during the third step (Fig. 8(c)) is equal to 406.08 kN.mm, 429.68 kN.mm, 543.72 kN.mm, respectively and finally during the fourth step (Fig. 8(d)) is calculated equal to 1129.24 kN.mm, 1219.76 kN.mm, 1459.6 kN.mm, respectively. Here, is used to represent the number of loading steps.
Fig. 8Hysteresis curves of specimens: a) first step, b) second step, c) third step, d) fourth step
a)
b)
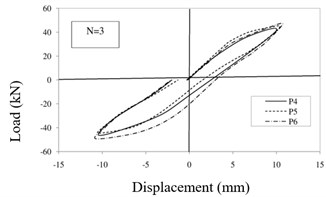
c)
d)
Requiring structural capacity such as ultimate displacement and also ultimate dissipated energy for damage detection and localization in most of the used indexes, the hysteresis curves of p4, p5 and p6 specimens were shown for 10, 9 and 8 steps, respectively (Fig. 9), Then the push was applied until the piers failed and the ultimate cumulative dissipated energy was extracted. While the yielding occurs, the yield point (see Fig. 10) is defined based on equivalent elastoplastic energy dissipation [14]. Then the enclosed area by hysteresis loop of structure is calculated using Eq. (7) in ATC40; Where, and are the coordination of yield point and and are the coordination of performance point (favorable steps) (See Fig. 11). The enclosed area by hysteresis loop is shown as in ATC40 reference [15]. and according to Eq. (2-7), gives values of dissipated energy in different steps and in final loop (ultimate capacity):
Finally, the enclosed area by hysteresis loops (ultimate cumulative energy) for specimen P4, P5 and P6 is equal to 61049.72 kN.mm, 47044.36 kN.mm and 30546.04 kN.mm respectively.
Fig. 9Hysteresis loops of three test specimens
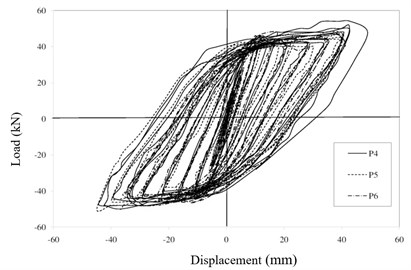
Fig. 10Defining yield point based on equal areas [14]
![Defining yield point based on equal areas [14]](https://static-01.extrica.com/articles/18997/18997-img13.jpg)
Fig. 11Calculating the values of ED[15]
![Calculating the values of ED[15]](https://static-01.extrica.com/articles/18997/18997-img14.jpg)
![Calculating the values of ED[15]](https://static-01.extrica.com/articles/18997/18997-img15.jpg)
2.4.3. Backbone curves of hysteresis loops
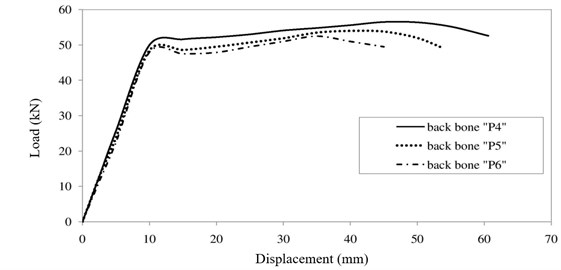
In accordance with ASCE-13, a smooth “backbone” curve shall be drawn through each point of peak displacement during the first cycle of each increment of loading (or deformation) [16]. The point of maximum displacement is adopted and connected to obtain hysteresis loop envelopes and draw backbone curves (hysteresis envelope) of specimen p4, p5 and p6. The area under envelope diagrams of specimen p4, p5 and p6 are obtained 2989.24 kN.mm, 2505.5 kN.mm and 1973.62 kN.mm, respectively which show an increase about 26.95 % in specimen p5 compared to p6 and about 19.31 % in specimen p4 compared to p5 and also about 51.46 % in specimen p4 compared to p6. The maximum displacement and maximum load of specimen p4, p5 and p6 is 60.6, 54 and 45 mm, and also 58, 54 and 53 kN, respectively. Comparing backbone curves of specimens in Fig. 12 revealed corresponding increases in strength of specimen p4 rather than p5 and p6 is 7.41 % and 9.43 % and also corresponding increase in ultimate displacement of specimen p4 rather than p5 and p6 is 12.22 % and 34.67 %, respectively. The values of ductility of specimen p4, p5 and p6 are obtained 5.05, 4.43 and 3.66, respectively showing corresponding increases in ductility (ratio of ultimate displacement to yield displacement) of specimen p4 compared to those of p5 and p6 is 13.99 % and 37.98 %, respectively (Table 2).
Table 2Details of ductility
Specimen | Yield displacement (mm), | Ultimate displacement (mm), | Ductility |
P4 | 12 | 60.6 | 5.05 |
P5 | 12.2 | 54 | 4.43 |
P6 | 12.3 | 45 | 3.66 |
Fig. 12Comparing backbone curves of specimens
2.4.4. Formation of cracks and failure
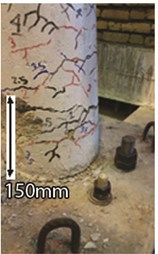
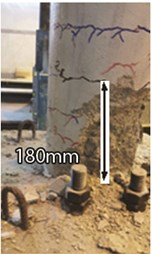
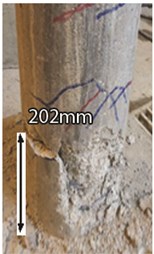
Increase in lateral displacement during first steps initiated micro cracks propagated along nearly one tenth of the piers length (0.1) above the foundation. The cracks were propagated after an increase in displacement from fourth step and were separately observed as shown in Fig. 13. Finally, the ultimate failure as crushing of concrete and failure of reinforcements were observed in distance of 150, 180 and 202 mm from top of the foundation nearly one fifth of the piers length (0.2) above the foundation for specimen p4, p5 and p6 (Table 3).
Table 3Details of cracking zoon length
Specimen | Cracking zoon length (mm), initial steps | Failure zoon length (mm), ultimate step |
P4 | 89 (0.098) | 150 (0.16) |
P5 | 94 (0.1) | 180 (0.2) |
P6 | 102 (0.11) | 202 (0.22) |
3. Application of experimental results in damage detection
The Banon and Veneziano analysis is based on probabilistic context and twenty nine different tests on RC structural elements calibrated in the model and selected from the most representative ones in cyclic behavior in past research studies. Particularly, the damage parameters as the ratio of stiffness at yielding point to secant stiffness at failure and the plastic dissipated energy normalized with respect to the absorbed energy at the elastic limit are determined. The value d1 is equal to the ratio of the maximum displacement to the displacement at the elastic limit in the elastic-plastic model that has been applied in the analyses; theoretical and experimental analyses [17, 18], have revealed that the correlation coefficient of both parameters (ratio of stiffness and ratio of displacements) is very high (approximately 0.95). Thus, according to above mentioned notation, parameters and can be expressed as Eq. (8):
Fig. 13Failure region of the specimens: a) p4, b) p5, c) p6
Additionally, modified damage parameters and are defined as Eq. (9):
where and are two parameters which specify the structural problem and are defined based on experimental results. In the plane , , the circumferences of circles with their center at the origin define the lines with equal collapse probability. Therefore, the damage functional can be defined as Eq. (10) [19]:
Dividing the expression by the value at failure point in a monotonic test, the corresponding normalized value can be derived. Values of 1.1 and 0.38 are represented for optimum choice of the model parameters for RC elements [19].
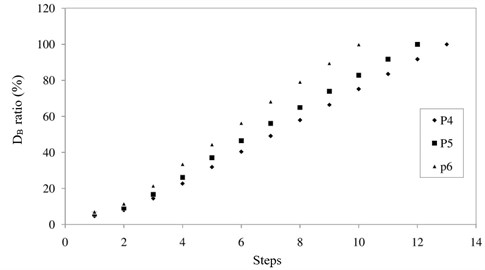
The values of in the failure stage, as shown in Table 4, as well as the details of the calculation of the ratio , for the four first steps are shown in Table 5. ratio () varies between zero (no damage) and one (full damage condition) in accordance with Fig. 14.
Table 4Required data to calculate the values of DB in failure
Specimen | P4 | P5 | P6 |
Yield displacement (mm), | 12 | 12.2 | 12.3 |
Yield force (kN), | 58 | 54 | 53 |
Ultimate displacement (mm), | 60.6 | 54 | 45 |
(Ultimate Cumulative dissipated energy) (kN-mm), | 61049.72 | 47044.36 | 30546.04 |
Value at failure in monotonic test, | 8.799 | 8.017 | 6.723 |
Considering the aim of this paper is to investigate the low-frequency ambient vibrations, the severity of damage was obtained using the presented relationships. Also, by identifying the location of the damage (experimental observation), the field of modeling of the finite element piers for optimization methods is provided. In fact, the information obtained using this method is used as a predictive damage scenario for use in reverse optimization problems.
Since the application of damage percentage was not proper after fourth step due to propagation of separated cracks, the damage percentage was used as initial final stages of inverse detection only for four first cycles which showed slight damages.
Table 5Defining damages based on Banon-Veneziano method
Step | Specimen | (mm) | (kn-mm) | (cumulative energy) (kn-mm) | ( ratio) (%) | |
1 | P4 | 2.5 | 26.64 | 26.64 | 0.414 | 4.70 |
2 | P4 | 5 | 79.32 | 105.96 | 0.700 | 7.96 |
3 | P4 | 10 | 406.08 | 512.04 | 1.274 | 14.48 |
4 | P4 | 15 | 1129.24 | 1641.28 | 1.999 | 22.72 |
1 | P5 | 2.5 | 35.72 | 35.72 | 0.472 | 5.89 |
2 | P5 | 5 | 82.32 | 118.04 | 0.744 | 9.28 |
3 | P5 | 10 | 429.68 | 547.72 | 1.334 | 16.64 |
4 | P5 | 15 | 1219.76 | 1767.48 | 2.095 | 26.13 |
1 | P6 | 2.5 | 37.52 | 37.52 | 0.484 | 7.20 |
2 | P6 | 5 | 94.08 | 131.6 | 0.779 | 11.59 |
3 | P6 | 10 | 543.72 | 675.32 | 1.451 | 21.58 |
4 | P6 | 15 | 1459.6 | 2134.92 | 2.257 | 33.57 |
Fig. 14Damage values in all steps until failure of specimens
4. Conclusions
This paper presents a simple experimental method for damage detection of bridge piers. The location and percentage of damage as initial data were considered to solve damage detection and localization. Regarding the recent development of inverse methods for damage detection such as definition of objective functions and optimization methods, the present experimental study can be utilized as initial stage of such methods. This research applied the low vibrations as cyclic loads and investigated the results including hysteresis behavior of the specimens and backbone curves. Extracting hysteretic loops, the value of ultimate cumulative dissipated energy in specimen p4 is obtained 61049.72 kN.mm and an increase equal to 29.77 % and 99.86 % is observed in this specimen comparing specimen p5 and p6, respectively. Comparing back bone diagram of specimens shows corresponding increases in strength of specimen p4 rather than p5 and p6 is 7.41 % and 9.43 % and also corresponding increase in ultimate displacement of specimen p4 rather than p5 and p6 is 12.22 % and 34.67 %, respectively. The values of ductility of specimen p4, p5 and p6 are obtained 5.05, 4.43 and 3.66, respectively that shows corresponding increases in ductility (ratio of ultimate displacement to yield displacement) of specimen p4 rather than p5 and p6 is 13.99 % and 37.98 %, respectively.
Regarding to experimental results in load steps, this paper finally extracted the damage percentages using the Banon-Veneziano method for four first steps to be used in damage detection methods. The damage values in the four first steps were obtained equal to 4.7 %, 7.96 %, 14.48 % and 22.72 % for specimen p4, 5.9 %, 9.28 %, 16.64 % and 26.13 % for specimen p5 and 7.2 %, 11.59 %, 21.58 % and 33.57 % for specimen p6, respectively which show an increase in damage values for specimens with transverse reinforcements having more values of spacing. Also, using experimental observations, in the initial steps, the cracking regions were observed at a distance of about one tenth of the piers length above the foundation. Then, with increasing steps, failures were observed at a distance of about one fifth of the piers length. Finally, it could be concluded from the results that the proposed method is an appropriate method to determine the severity of damage and its location as the primary information in reverse-optimization methods. In general, while the flexural loads are only applied, the damage is initiated from bottom of the pier and when the torsion is coincided with flexural loads, the damage moves up and is extended due to an increase in torsions and will continue until the damage is only propagated in mid-span element and not at the bottom of the pier due to only torsion (no flexural load). In this paper, in fact, the test results approached the authors to the exact data for piers under flexural loads for structural health monitoring.
References
-
Naderpour H., Ezzodin A., Kheyroddin A., Ghodrati Amiri Gh Signal processing based damage detection of concrete bridge piers subjected to consequent excitations. Journal of Vibroengineering, Vol. 19, Issue 3, 2017, p. 2080-2089.
-
Doebling S. W., Farrar C. R., Prime M. B., Shevitz D. W. Damage Identification and Health Monitoring of Structural and Mechanical Systems from Change in Their Vibration Characteristics. LA-13070-MS.US-900, Los Alamos National Laboratory, New Mexico, 1996.
-
Zembaty Z., Kowalski M., Pospisil S. Dynamic identification of a reinforced concrete frame in progressive states of damage. Engineering Structures, Vol. 28, Issue 5, 2006, p. 668-681.
-
Meruance V., Heylen W. An hybrid genetic algorithm to detect structural damage using modal properties. Mechanical Systems and Signal Processing, Vol. 25, Issue 5, 2011, p. 1559-1573.
-
Kourehli S. S. Structural damage diagnosis using incomplete static responses and LS-SVM. Inverse Problems in Science and Engineering, Vol. 24, Issue 3, 2016, p. 418-433.
-
Kourehli S. S. Damage assessment in structures using incomplete modal data and artificial neural network. International Journal of Structural Stability and Dynamics, Vol. 15, Issue 6, 2015, p. 1450087.
-
Rasouli A., Ghodrati Amiri Gh, Kheyroddin A., Ghafory Ashtiany M., Kourehli S. S. A new method for damage prognosis based on incomplete modal data via an evolutionary algorithm. European Journal of Environmental and Civil Engineering, Vol. 18, Issue 3, 2014, p. 253-270.
-
Rasouli A., Kourehli S. S., Ghodrati Amiri G. H., Kheyroddin A. A two-stage method for structural damage prognosis in shear frame based on story displacement index and modal residual force. Advances in Civil Engineering, Vol. 2015, 2015, p. 527537.
-
Hindi R., Turechek W. Experimental behavior of circular concrete columns under reversed cyclic loading. Construction and Building Materials, Vol. 22, Issue 4, 2008, p. 684-693.
-
Wang P., Han Q., Du X. Seismic performance of circular RC bridge columns with flexure-torsion interaction. Soil Dynamics and Earthquake Engineering, Vol. 66, Issue 1, 2014, p. 13-30.
-
AASHTO LRFD Bridge Design Specifications. American Association of State Highway and Transportation Officials, AASHTO Publication, United States, 2014.
-
ASTM C33/C33M-16, Standard Specification for Concrete Aggregates. American Society for Testing and Materials, United States, 2016.
-
Priestley M. J. N., Seible F., Calvi G. M. Seismic Design and Retrofit of Bridges. Wiley-Interscience Publication, United States, 1996.
-
Elnashai A. S., Di Sarno L. Fundamentals of Earthquake Engineering. 1st Edition, John Wiley and Sons, United Kingdom, 2008.
-
ATC-40, Seismic evaluation and retrofit of concrete buildings. Applied Technology Council, United States, 1996.
-
ASCE Standard [ASCE/SEI 41-13], Seismic evaluation and retrofit of existing buildings. American Society of Civil Engineers, United States, 2013.
-
Banon H., Biggs J., Irvine H. Seismic damage in reinforced concrete frames. Journal of the Structural Division, Vol. 107, Issue 9, 1981, p. 1713-1729.
-
Banon H., Veneziano D. Seismic safety of reinforced concrete members and structures. Earthquake Engineering and Structural Dynamics, Vol. 10, Issue 2, 1982, p. 179-193.
-
Cosenza E., Manfredi G., Ramasco R. The use of damage functionals in earthquake engineering: a comparison between different methods. Earthquake Engineering and Structural Dynamics, Vol. 22, Issue 10, 1993, p. 855-868.
About this article

