Abstract
A technique in measuring torsional vibration signal based on an optical encoder and a discrete wavelet transform is proposed for the extraction of gear meshing characteristics. The method measures the rotation angles of the input and output shafts of a gear pair by using two optical encoders and obtains the time interval sequences of the two shafts. By spline interpolation, the time interval sequences based on uniform angle sampling can be converted into angle interval sequences on the basis of uniform time sampling. The curve of the relative displacement of the gear pair on the meshing line (initial torsional vibration signal) can then be obtained by comparing the rotation angles of the input and output shafts at the interpolated time series. The initial torsional vibration signal is often disturbed by noise. Therefore, a discrete wavelet transform is used to decompose the signal at certain scales; the torsional vibration signal of the gear can then be obtained after filtering. The proposed method was verified by simulation and experimentation, and the results showed that the method could successfully obtain the torsional vibration signal of the gear at a high frequency. The waveforms of the torsional vibration could reflect the meshing characteristics of the teeth. These findings could provide a basis for fault diagnosis of gears.
1. Introduction
Torsional vibration, which is the rotational vibration induced by torque fluctuation of rotary parts, is commonly observed in all kinds of rotating machinery. As torsional vibration occurs, the stress state of rotary parts changes periodically which can easily cause fatigue, damage, and even catastrophic accidents. Therefore, the measurement and monitoring of torsional vibration is significant for the safety of the rotary system. Meanwhile, the torsional vibration signal is not as susceptible to interference as the transverse vibration signal, and the torsional vibration signal is more sensitive to fault signals and has a higher signal-to-noise ratio [1]. Numerous studies about using the torsional vibration signal for the fault diagnosis have been published. Fan [1] extracted the torsional vibration signal from the measured signal using time-averaging method and detected the eccentricity of test gears. Li [2] detected the electrical faults in turbine generator sets by monitoring torsional vibrations of shafts based on wavelet packet analysis. Charles [3] identified the faults and the particular faulty cylinder of two medium-speed diesel engines via instantaneous angular speed waveform (torsional vibration signal). Feng [4] presented explicit equations to model torsional vibration signals, considering both distributed gear faults and local gear faults, and validated experimentally the signal models and the effectiveness of joint amplitude and frequency demodulation analysis in extracting planetary gearbox fault symptoms. Fundamental to the experimental study of rotary machinery characteristics and fault diagnosis is the accurate measurement and extraction of the torsional vibration signals.
Generally speaking, the measurement method of torsional vibration signal can be divided into two categories: the direct method and the indirect method [5]. The direct method includes contact measurement and non-contact measurement [6]. Sensors (e.g., encoder, strain gauge, etc.) are directly installed on the rotating surface in contact measurement, and the measured signal is transmitted to the receiver by slip rings or wireless transmission [7]. In non-contact measurement, however, sensors do not need to contact the rotating surface, which is suitable for the situation where sensors are hard to install. The non-contact measurement mainly includes tooth measuring method, infrared method, and laser method. As for the indirect method, torsional vibration signal is obtained by measuring other physical quantities related to it [6]. For example, the torsional vibration signal of the shaft can be obtained by measuring the stator current of the motor. It needs to be pointed out that each measurement method has its limitations.
Owing to stability of operation, high precision, easy installation, and good economic performance, encoders have been widely used to measure the torsional vibration of the shaft and its parts [1, 3, 6, 8-10]. However, many of the current encoder-based techniques in measuring gear torsional vibration are carried out at a low rotating frequency. For instance, the shaft frequencies in references [3, 6] are only 12.5 and 3.3 Hz respectively. In addition, most of them are typically low-pass filtered. As a result, the vibration signals cannot accurately reflect the gear meshing characteristics. Gear dynamic characteristics at a high frequency domain are the new focus of active research. However, many of the published studies focus on the theoretical analysis. Experimental studies about observing gear torsional vibration waveforms at the meshing frequency are rare. Kang and Kahraman [11] presented an effective method to measure the torsional vibration waveforms at a high frequency using two diametrically opposed linear accelerometers which are mounted tangentially on a flange very near the gears. The torsional vibration time histories at the rotation speed up to 4000 rpm have been recorded. However, this method could only be realized in the specific mechanism, and is unsuitable for the usual situation in gearboxes where accelerometers are quite difficult to be attached to gear wheels.
On the other hand, the vibration signals are unavoidably disturbed by all kinds of noises in the actual measurement. Torsional vibration signals with early fault signatures are usually non-stationary. Thus, the traditional Fourier based signal-processing techniques are not quite suitable for the extraction of torsional vibration signal. Hilbert transform has been shown to be useful for demodulation, but it cannot reveal early fault signatures buried in non-stationary signals [12]. The short-time Fourier transform is useful for non-stationary signals, but its resolution is often unsatisfactory because of poorly matched windows in signal analysis [13]. Wavelet transform has the advantage of a variable time–frequency window, which exhibits low resolution in the low-frequency band of the signal and high resolution in the high-frequency band. Moreover, wavelet transform decomposes a signal into a series of independent frequency bands, which meets the requirement of analyzing gear meshing characteristics within specific frequency bands. It is actually quite suitable for analysis of non-stationary signals in gear dynamic characteristics and fault detection [14]. Morsy [15] used an adaptive wavelet filter to detect fault symptoms from a gearbox with early tooth cracks and experimentally proved the effectiveness of the adaptive wavelet filter. Goumas [16] used discrete wavelet transform to analyze the transient signals of the vibration in washing machines and fault features were extracted from the wavelet coefficient. Hambaba and Huff [17] decomposed the vibration signals from gears in a helicopter with discrete wavelet transform and extracted the fault features.
In this study, a measurement method based on optical encoder and discrete wavelet transform is proposed to extract the torsional vibration signal of a gear pair within high frequency bands, aiming at providing a convenient and effective method for the experimental studies of gear meshing characteristics and gear diagnostics in gearboxes. The optical encoders are used to gauge the rotation angles of the input and output shafts of a gear pair, whereas the discrete wavelet transform is used to extract the torsional vibration signal of the gear from the measured signals within the specific frequency band. This paper is organized as follows: in Section 2, the measurement method of torsional vibration signal is introduced in detail. In Section 3, a model of a gear system with manufacturing and assembly errors is built and the proposed method is verified by simulation. In Section 4, a gear test bench is established to validate the proposed method. Finally, a conclusion is drawn.
2. Measurement method
The torsional vibration signal of a gear can be represented with the relative displacement of a gear pair on the meshing line, expressed as follows:
where TVS represents the torsional vibration signal, and are the base radius of gear 1 and gear 2, respectively, and and are the rotating angles of gear 1 and gear 2, respectively.
The method can be divided into two parts: signal acquisition and signal processing. Signal acquisition involves collecting and preserving the pulse signals generated by optical encoders. Signal processing involves processing the pulse signals of the input and output shafts of the gear pair into the initial torsional vibration signal and extracting the torsional vibration signal of the gear from the initial signal with the use of a discrete wavelet transform.
2.1. Signal acquisition
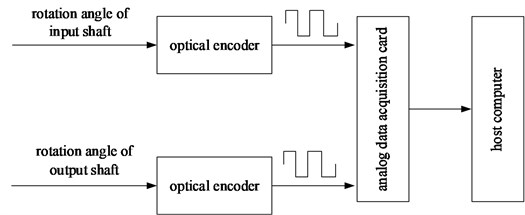
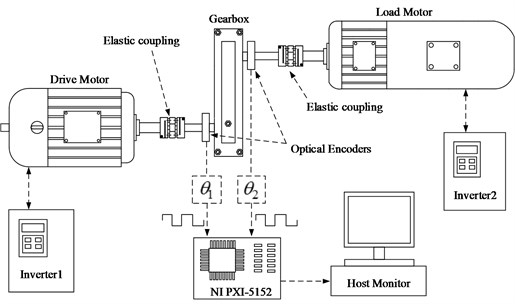
The signal acquisition system is composed of two optical encoders, an analog data acquisition card and a host computer, as shown in Fig. 1. One of the two optical encoders is installed on the input shaft of the gear pair, whereas the other is installed on the output shaft, both of which rotate with the shafts and output pulses every revolution, where represents the number of optical encoder segments. The pulse signals generated by the two optical encoders are collected using the analog data acquisition card and preserved to the host computer; the signals are then processed in MATLAB to obtain the torsional vibration signal of the gear (the signal processing will be described in detail later).
The measurement accuracy of the signal acquisition system depends on the number of optical encoder segments and sampling precision of the analog data acquisition card. The rotation angles of the shafts are essentially sampled on a uniform angular interval basis, and each output of a pulse indicates that the shaft has rotated 360°/. Thus, the larger the , the higher the angular resolution of the optical encoder is. The sampling precision of the analog data acquisition card depends on its clock frequency; the higher the clock frequency, the more sampled points of the pulse signal are collected in the same time so that a higher time resolution is obtained.
To accurately measure the rotation angles of the input and output shafts of the gear pair at a high frequency, an incremental optical encoder with 2500 segments is selected, with a maximum speed of 3000 rpm. The angular resolution of the optical encoder can reach 0.144°. Given a shaft rotation speed of 3000 rpm, the sampling frequency of the analog data acquisition card should satisfy the condition Eq. (2), in accordance with the Nyquist-Shannon sampling theorem:
For the time-domain waveforms of the torsional vibration signal to accurately reflect the meshing characteristics of the teeth, a high-precision analog data acquisition card NI PXI-5152 with two analog input channels has been selected; the sampling rate of each channel can reach 1 Gs/s. The PXI-5152 is embedded into the NI PXI-1031 chassis, equipped with NI PXI-8106 real-time controller.
Fig. 1Block diagram of a signal acquisition system
2.2. Signal processing
In the measurement method, the pulse signals of the input and output shafts are firstly counted and interpolated to obtain the initial torsional vibration signal in MATLAB. Subsequently, on the basis of the MATLAB wavelet toolbox, the initial torsional vibration signal is subjected to a discrete wavelet transform to obtain the torsional vibration signal of the gear. This method avoids using the complex hardware counting circuit and the demodulation circuit, which is in accord with the development trend of the measurement technique to virtual instrumentation.
2.2.1. Counting and spline interpolation
The ouput pulse signal of the selected optical encoder has a theoretical amplitude of 5 V. Assumed that represents the th sampled point of the pulse signal, it indicates that a rising edge is detected if . When the number of the rising edges of pulse signals counted in MATLAB is , it indicates that the shaft has rotated 360°/. By saving the values of the time and rotation angle at each rising edge, the time-rotation angle curve of the shaft can be obtained; the abscissa is the rotation angle. However, the output pulse signal of an optical encoder inevitably contains glitches in the actual measurement. A glitch whose amplitude is sufficiently large is mistaken as a pulse if no processing occurs, which will affect the correct counting of the pulse signal. When the gear rotates at a constant speed, the time interval of the adjacent rising edge of the pulse signal is a constant. If the time interval is smaller than the constant value, it indicates that a glitch is detected. Therefore, the signal glitches can be effectively removed by the comparison of the time intervals of the adjacent rising edge. In addition, when the shaft is in its initial position, the reference of the optical encoder does not normally lie in a certain groove of the encoder disk; thus, the angle corresponding to the first rising edge (initial angle) is usually not equal to 360°/. By comparing the time required to turn the initial angle with the time required to turn 360°/, the initial angle can be determined.
To obtain the curve of the relative displacement of the gear pair on the meshing line, spline interpolation has to be conducted to transform the time-rotation angle curve into a rotation angle-time curve whose abscissa is the time interval, according to (1). The time step of spline interpolation is fixed at 10-5 s, which indicates that the frequency of resampling is 100 kHz.
2.2.2. Discrete wavelet transform
The study by [18] assumed that the Fourier transform of the function satisfies , and the function cluster , which represents the translation and dilation of the function , is called the wavelet function:
where is called the mother wavelet, represents the scale parameter, and is the translation parameter.
The continuous wavelet transform of the signal can then be defined as:
where is the conjugate function of .
To fit with the requirements of numerical computation by computer, the scale parameter and the translation parameter are generally discretized. Given and , the discrete wavelet transform of the signal can be expressed as:
In practical engineering, signals are often discrete, which can be represented by , . The discrete wavelet transform of the signal is:
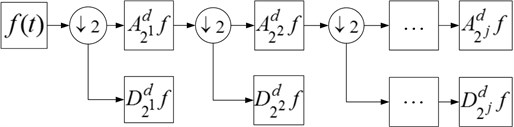
For any signal, the discrete wavelet transform first decomposes the signal into the approximate part and the minutiae part. The approximate part is further decomposed into the new approximate part and the new minutiae part, iteratively decomposed up to scale . The decomposition process is shown in Fig. 2. The discrete wavelet transform decomposes a signal into a series of independent frequency bands, whereas the torsional vibration signal of a gear behaves as the meshing frequency and the frequency multiplication in the frequency domain. Therefore, as long as the appropriate decomposition layer is selected, the torsional vibration signal of the gear can be extracted from the initial signal. Notably, the “db44” wavelet is selected as the mother wavelet to extract the meshing characteristic of the gear in this study because it is similar to the torsional vibration signal of the gear.
Fig. 2Discrete wavelet transform
3. Simulation verification
In this section, the feasibility of extracting the torsional vibration signal of the gear at a high frequency is verified by the simulation of a gear system. The dynamic model of the gear system with manufacturing and assembly errors is first established, and the simulation is carried out at a high frequency, based on the Simulink platform. During simulation, spline interpolation is applied to sample the angular signal of the input and output shafts of the gear pair, which can produce two pulse signals (the sampling simulation of an optical encoder). Ultimately, the torsional vibration signal of the gear at a high frequency can be obtained using the aforementioned signal processing method to deal with the two pulse signals.
3.1. Modeling
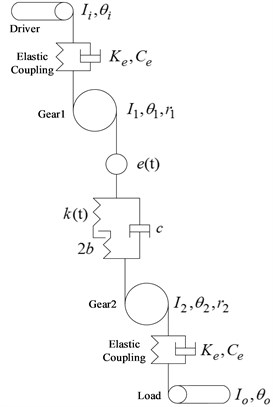
In accordance with the reference [19, 20], the dynamic model of the gear system is established, as shown in Fig. 3. The system includes a drive motor, a load motor, a spur gear pair, and two elastic couplings. The gears are perfect involute spur gears with no modifications. The nonlinear characteristic of the gear meshing process is represented by the elastic element with backlash and the damping element, whereas the elastic coupling is represented by the elastic element and the damping element. Both the mass moments of inertia of the elastic couplings and friction on the gear meshing surface are neglected.
In Fig. 3, , , and represent the mass moments of inertia of the diver, load, gear 1 and gear 2, respectively; , , , and represent the rotation angles of the diver, load, gear 1 and gear 2, respectively. The base radii of gear 1 and gear 2 are and , respectively. and are the mesh stiffness and the damping coefficient of the gear pair. Meanwhile, and denote the mesh stiffness and the damping coefficient of the elastic couplings. represents the manufacturing and assembly errors of the gear system, and the backlash of the gear pair is denoted by 2.
When the drive motor and the load motor apply torques and , respectively, the dynamic equation of the gear system is:
where and are the torques transferred by elastic coupling 1 to gear 1 and by elastic coupling 2 to the load, which can be expressed as:
Fig. 3Dynamic model of the gear system
Gear backlash nonlinearity is modeled as a piecewise linear function:
As gears rotate, the fluctuation of the number of tooth pairs in contact leads to the variation in mesh stiffness. The time-varying mesh stiffness can be represented with the multi-order fitting stiffness model proposed in [19], which is defined as:
where is the average mesh stiffness; is the mesh frequency; ICR is the involute contact ratio; and are the th Fourier coefficient and the phase angle of , respectively .
The damping coefficient c of the tooth mesh is determined using Eq. (10):
where is the damping ratio.
In accordance with [21], the harmonic function can be used to represent the manufacturing and assembly errors :
where and represent the constant value and the amplitude of error, with and 2×10⁻⁴ m, and is the rotation speed of shafts.
The simulation parameters of the gear system are shown in Table 1, where gear1 has the same parameters as gear 2.
Table 1Gear system parameters
Parameters (unit) | Value |
Number of teeth | 61 |
Module (mm) | 2 |
Pressure angle (deg.) | 20 |
Face width (mm) | 25 |
Backlash (μm) | 200 |
Mass of gear (kg) | 2.1 |
Involute contact ratio ICR | 1.787 |
Average mesh stiffness (N/m) | 588.87×10⁶ |
Damping ratio of gear pair | 0.07 |
Damping coefficient of elastic coupling | 16.05 |
Stiffness of elastic coupling (N·m/rad) | 3560 |
Mass moment of inertia of driver (kg·m2) | 0.14 |
Mass moment of inertia of load (kg·m2) | 0.046 |
3.2. Simulation results analysis
Fig. 4 presents the simulation curve of the initial torsional vibration signal obtained by simulating the dynamic model of the gear system on the basis of the Simulink platform and by using the aforementioned measurement method under the rotation speed of 2040 rpm and torque of 60 N·m. As shown in the Fig. 4, the initial torsional vibration signal has a low-frequency signal with large amplitude induced by manufacturing and assembly errors, making it difficult to directly observe the waveforms of torsional vibration (high-frequency signal).
To extract the torsional vibration signal of the gear, the discrete wavelet transform is used to decompose the initial torsional signal at the scale of five in the MATLAB wavelet toolbox. After filtering the approximate part of the signal and the first three layers of detail signals, the time-domain waveforms of the remaining detail signal is shown in Fig. 5(a). At the rotation speed of 2040 rpm, the theoretical value of the first-order mesh frequency of the gear is 2074 Hz, whereas the theoretical value of the second-order mesh frequency of the gear is 4148 Hz. Fig. 5(c) shows that the FFT spectrum of the remaining detail signal contains the first-order and the second-order mesh frequency of the gear. Therefore, the remaining detail signal can be regarded as the torsional vibration signal of the gear, verifying the feasibility of the proposed measurement method.
The time-domain waveforms of gear rotary cycle have been shown in Fig. 5(a), while Fig. 5(b) presents the zoomed area of the time-domain waveforms with each meshing cycle shown clearly. The meshing waveforms of the gear pair should theoretically be equal in amplitude and consistent in shape. However, the amplitudes of the meshing waveforms of the gear pair in Fig. 5(a) and Fig. 5(b) change periodically, and the shape is not uniform. In addition, on both sides of the mesh frequency is a side-band modulation; the modulation frequency is the rotation frequency of shafts, as shown in Fig. 5(c). The fault information on the gear (manufacturing and assembling errors) is included in its torsional vibration signal. Therefore, the meshing waveforms of the gear can be used to evaluate the meshing state of the gear and provide a basis for the fault diagnosis of the gear or the quality assessment of gear machining.
Fig. 4Simulation curve of initial torsional vibration signal
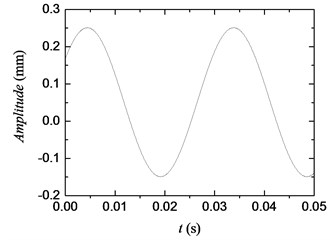
Fig. 5Simulation results after filtering with the use of discrete wavelet transform
a) Waveforms of the remaining detail signal
b) Zoomed area of a)
c) FFT spectrum of the remaining detail signal
4. Experimental verification
4.1. Experimental bench
To verify the feasibility of the proposed measurement method, an experimental bench was set up, as shown in Fig. 6. The experimental bench mainly consists of a drive motor, a load motor, a gearbox with a spur gear pair, two elastic couplings, two optical encoders and two inverters. The experimental bench can be used under different working conditions by controlling the output speed of the drive motor and the output torque of the load motor with the use of inverters (not shown in Fig. 6). The two gears are involute spur gears with no modifications, and both have 61 teeth. The measuring principle of the experimental bench is shown in Fig. 7. The software aspect of the measurement system is based on the graphical programming software LabVIEW.
Fig. 6Experimental bench of the gear system
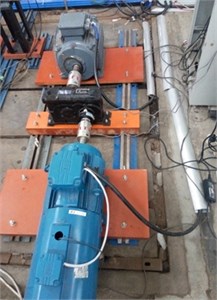
Fig. 7Measuring principle of the experimental bench
4.2. Experimental results analysis
The curve of the initial torsional vibration of the experimental bench at the rotation speed of 2040 rpm and torque of 60 N·m was obtained using the aforementioned measurement method, as shown in Fig. 8. The signal also contains a low-frequency signal with large amplitude owing to manufacturing and assembly errors, impeding direct observation of the meshing characteristics of the gear.
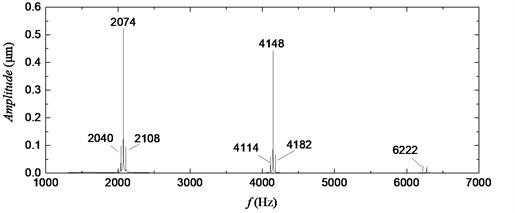
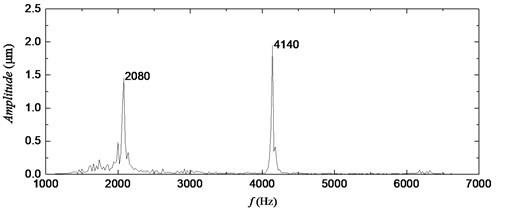
As shown in Fig. 9(c), the first-order mesh frequency and the second-order mesh frequency of the remaining detail signal are very close to the theoretical value. The small difference in frequency indicates that the remaining detail signal is the torsional vibration signal of the gear, thus verifying the feasibility of the proposed method for extracting the torsional vibration signal of gears at a high frequency. Notably, to ensure the accuracy of the final meshing waveforms, the selected sampling frequency of each channel of NI PXI-5152 is 500 MHz, and the number of sampled points reaches the maximum of 25 M. In this case, the frequency resolution of the FFT spectrum of the signal is only 20 Hz. Therefore, the difference between the mesh frequency of the measured signal and the theoretical value is within the acceptable range.
Fig. 8Measured curve of initial torsional vibration signal
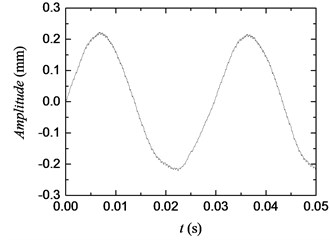
Fig. 9Experimental results after filtering with the use of discrete wavelet transform
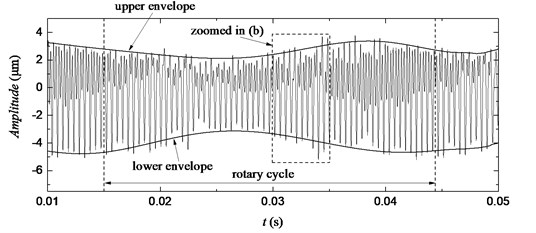
a) Waveforms of the remaining detail signal
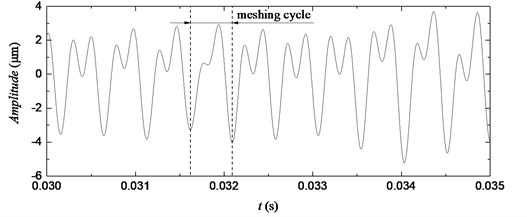
b) Zoomed area of a)
c) FFT spectrum of the remaining detail signal
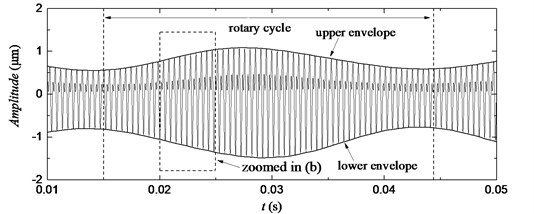
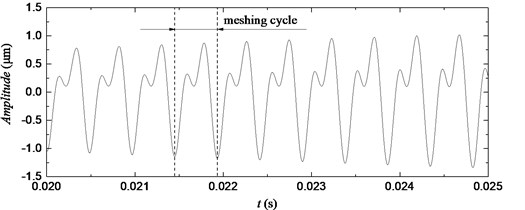
The experimental time-domain waveforms of gear rotary cycle have been shown in Fig. 9(a), while Fig. 9(b) presents the zoomed area of the time-domain waveforms with each meshing cycle shown clearly. The meshing waveforms of the gear pair in Fig. 9(a) and Fig. 9(b) show periodical amplitudes, indicating the eccentricity (uneven machining quality) of the test gears. The gear meshing waveforms obtained by the proposed method correspond to the teeth, which could reflect the meshing state of each tooth.
The upper/lower envelopes of the simulated signal and the experimental signal have been respectively shown in Fig. 5(a) and Fig. 9(a). The envelopes in the two figures have the similar trends and their fluctuation periods are similar with the corresponding rotary cycle respectively, verifying the feasibility of the proposed method further. The more specific fault signal of gears can be further obtained by the Hilbert transform, wavelet packet analysis, or other processing on the torsional vibration signal, but this subject will not be discussed in this study, which focuses on the convenient and effective measurement of the torsional vibration signal of gears.
5. Conclusions
A convenient and effective measurement method of torsional vibration signal based on an optical encoder and a discrete wavelet transform is proposed for the extraction of gear meshing characteristics. The technique gauges the rotation angles of the input and output shafts by using two optical encoders and outputs the pulse signals; the torsional vibration signal of the gear can then be obtained by counting the two pulse signals, spline interpolation, and discrete wavelet transform on the basis of the MATLAB platform. The feasibility of the measurement method within high frequency bands has been verified by simulation and experimentation. The waveform of the torsional vibration signal of the gear corresponds to each tooth, which provides a basis for the further studies of gear meshing characteristics and gear diagnostics in gearboxes, where accelerometers are quite difficult to be attached to gear wheels.
References
-
Fan K. Q., Qu L. S. Research on gear fault diagnosis based on torsional vibration signal. China Mechanical Engineering, Vol. 10, Issue 4, 1999, p. 430-433.
-
Li X., Qu L., Wen G., Li C. Application of wavelet packet analysis for fault detection in electro-mechanical systems based on torsional vibration measurement. Mechanical Systems and Signal Processing, Vol. 17, Issue 6, 2003, p. 1219-1235.
-
Charles P., Sinha J. K., Gu F., Lidstone L., Ball A. D. Detecting the crankshaft torsional vibration of diesel engines for combustion related diagnosis. Journal of Sound and Vibration, Vol. 321, Issue 3, 2009, p. 1171-1185.
-
Feng Z. P., Zuo M. J. Fault diagnosis of planetary gearboxes via torsional vibration signal analysis. Mechanical Systems and Signal Processing, Vol. 36, Issue 2, 2013, p. 401-421.
-
Meroño P. A., Gómez F. C., Marín F. Measurement techniques of torsional vibration in rotating shafts. CMC, Vol. 44, Issue 2, 2014, p. 85-104.
-
Xiong X. Y. High resolution torsional vibration measurement method and its application. Journal of Vibration, Measurement and Diagnosis, Vol. 23, Issue 1, 2003, p. 41-43.
-
Xu H. Z. Study on Torsional Vibration Measurement of Rotational Machinery’s Shafting. Master Thesis, Tsinghua University, Beijing, 2005.
-
Zhang X. L., Tang X. K. Research on testing techniques of torsional angle and torsional vibration. Journal of Tsinghua University (Science and Technology), Vol. 37, Issue 8, 1997, p. 83-86.
-
Resor B. R., Trethewey M. W., Maynard K. P. Compensation for encoder geometry and shaft speed variation in time interval torsional vibration measurement. Journal of Sound and Vibration, Vol. 286, Issue 4, 2005, p. 897-920.
-
Remond D. Practical performances of high-speed measurement of gear transmission error or torsional vibrations with optical encoders. Measurement Science and Technology, Vol. 9, Issue 3, 1998, p. 347-353.
-
Kang M., Kahraman A. Measurement of vibratory motions of gears supported by compliant shafts. Mechanical Systems and Signal Processing, Vol. 29, Issue 5, 2012, p. 391-403.
-
Fan X., Zuo M. J. Gearbox fault detection using Hilbert and wavelet packet transform. Mechanical Systems and Signal Processing, Vol. 20, Issue 4, 2006, p. 966-982.
-
Jones D. L., Parks T. W. A resolution comparison of several time-frequency representations. IEEE Transactions on Signal Processing, Vol. 40, Issue 2, 1992, p. 413-420.
-
Wang W. J., Mcfadden P. D. Application of orthogonal wavelet to early gear damage detection. Mechanical Systems and Signal Processing, Vol. 9, Issue 5, 1995, p. 497-507.
-
Morsy M. E., Seoud S. A., Rabeih E. A. Gearbox damage diagnosis using wavelet transform technique. International Journal of Acoustics and Vibrations, Vol. 16, Issue 4, 2011, p. 173-179.
-
Goumas S., Zervakis M., Pouliezos A., et al. Intelligent on-line quality control of washing machines using discrete wavelet analysis features and likelihood classification. Engineering Applications of Artificial Intelligence, Vol. 14, Issue 5, 2000, p. 655-666.
-
Hambaba A., Huff E. Multiresolution error detection on early fatigue cracks in gears. IEEE Aerospace Conference Proceedings, Vol. 6, 2000, p. 367-372.
-
Li S. M., Li X. L. Modern Analysis Techniques and Application of Vibration Signals. 1st Edition, National Defense Industry Press, Beijing, 2008.
-
Cheon G. J. Nonlinear behavior analysis of spur gear pairs with a one-way clutch. Journal of Sound and Vibration, Vol. 301, Issue 3, 2007, p. 760-776.
-
Tamminana V. K., Kahraman A., Vijayakar S. A. Study of the relationship between the dynamic factors and the dynamic transmission error of spur gear pairs. Journal of Mechanical Design, Vol. 129, Issue 1, 2005, p. 75-83.
-
Li R. F., Tao Z. G., Lin T. J. Numerical simulation of internal dynamic excitation in gear meshing. Journal of Mechanical Transmission, Vol. 25, Issue 2, 2001.
Cited by
About this article

This work was supported by the National Natural Science Foundation of China (Grant No. 51405087), and the Natural Science Foundation of Guangdong Province (Grant No. 2016A030313517), and the Foundation for Distinguished Young Talents in Higher Education of Guangdong, China (Grant No. 2014KQNCX062).
Yanwei Liu conceived the study and designed the experiments. Zhihao Liang performed the experiments and wrote the manuscript. Jie Ye performed the data analyses and manuscript preparation. Huibin Lin helped perform the analysis with constructive discussions. Kegang Zhao approved the final version of the manuscript.
