Abstract
Aiming at the problem that the complex parts are difficult to process precisely, a flexible processing method, abrasive flow technology, is proposed. Based on the FLUENT software, a realizable - model was adopted and a Z-tube was used as the research object for numerical analysis. Parameters such as turbulence intensity, turbulent kinetic energy, and flow field pressure under different inlet pressures were simulated and discussed. The simulation results show that with the increase of inlet pressure, the turbulence intensity, turbulent kinetic energy and fluid pressure also increase, and the turbulent effect of the fluid is more obvious, which indicates that the processing effect of the abrasive flow will be better, and the final experiment will be performed. The experimental results are consistent with the simulation results, and the accuracy of the numerical simulation is proved. The abrasive grain flow processing technology is effectively verified.
Highlights
- Abrasive flow machining
- Ultra-precision machining
- Micro-cutting removal
- Numerical simulation analysis
- Experimental exploration
1. Introduction
Abrasive flow processing technology is a new surface processing technology, which can achieve rounding, deburring, reducing residual stress, etc. The basic working principle is to use the numerous hard particles in the liquid and flow to the processing surface under the action of external pressure. Through the collision and shear between the particles and the wall, so as to achieve the purpose of precision machining [1-5]. Li Chen et al. [6] applied the Preston equation to carry out force analysis of solid particles in the flow field, and then analyzed the polishing mechanism of the abrasive flow and verified the use of complex parts in automobiles. Li Junye et al. [7, 8] used the common rail tube as the research object to study the effect of particle volume fraction and particle size on the polishing effect of the abrasive flow. The best particle volume fraction and particle size were obtained through simulation analysis and verified through experiments. S. Singh et al. [9] added a magnetic field during the processing of the abrasive flow and found that the magnetic field would significantly affect the material removal rate and conducted a Taguchi experimental design. J. Kenda et al. [10] used the electrical discharge pre-machined hardened tool steel AISI D2 samples to investigate the effect of process parameters on surface roughness and induced residual stress. The results show that the abrasive flow can remove the damaged surface produced by EDM and improve greatly the surface quality.
2. Fluid control equation
All problems in the flow range must follow the law of conservation of mass and the law of conservation of momentum. The equations are:
where: is the static pressure, is the stress tensor, is the gravity in the direction, and is the external volumetric force in the direction.
The abrasive flow is turbulent in the machining process. Therefore, the turbulence model needs to be selected. At present, the standard - model is commonly used. However, since this model assumes that the turbulent flow is an isotropic turbulent flow, there is a large error. In this paper, the turbulence model for realizable - model was chosen, because the turbulent model can achieve better performance for the flow of jets and mixed flows, as well as the flow within pipes and boundary layer flows. In the realizable - model, the transport equation for and is as follows [11]:
where: is the fluid density; is the Prandtl number of the turbulent kinetic energy , 1.0; is the Prandtl number of the dissipation rate , 1.2; is the turbulent kinetic energy caused by the average velocity gradient; is the molecular viscosity coefficient; is the turbulent viscosity coefficient; 1.9, .
3. Calculation objects and boundary conditions
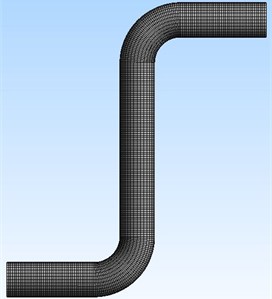
The Z-shaped flow channel is selected as the research object. The specific geometric dimensions are shown in Fig. 1. The right side is the inlet and the left are the outlet. Mesh software is used to divide the calculation area into grids. The divided grids are shown in Fig. 2.
Fig. 1Diagram of Z-tube geometry
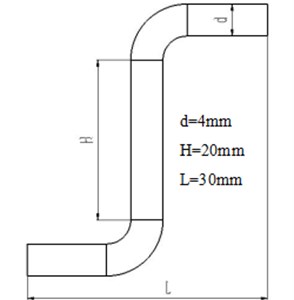
Fig. 2Mesh diagram
The boundary condition and basic parameters of this simulation are as follows: Using FLUENT software, the realizable - model is applied with the combination of the MIXTURE model and adopt the pressure-base solver and SIMPLE algorithm to solve. The boundary conditions are set to pressure-inlet and pressure-outlet, the inlet pressure is 1 MPa, 3 MPa and 5 MPa, respectively. The first phase is aviation hydraulic oil, the second phase is silicon carbide particles, and the volume fraction is set to 20 %. The standard of wall surface is used for the near wall surface. The force between the particles is not considered. The momentum and turbulent flow energy are in the second-order upwind. The score uses a first-order upwind.
4. Simulation analysis
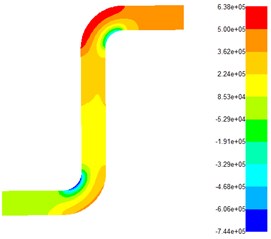
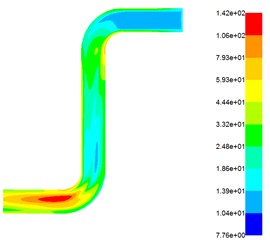
The pressure distribution has a great influence on the polishing effect of the abrasive flow. The greater the pressure, the greater the contact force between the abrasive flow and the wall, and the greater the shear force of the particles on the wall. The pressure distribution under different inlet pressures is shown in Fig. 3.
Fig. 3Flow field pressure distribution under different pressure
a) Pressure-inlet = 1 MPa
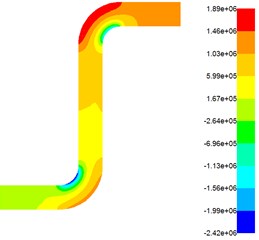
b) Pressure-inlet = 2 MPa
c) Pressure-inlet = 3 MPa
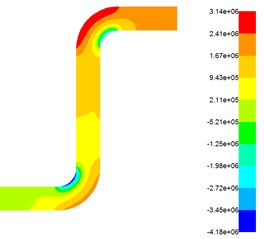
From Fig. 3, it can be seen that under the same inlet pressure, the pressure has a trend of increasing-decreasing-increasing. This is because when the flow of the abrasive particles just enters the flow channel, it hits the right angle-1, and the fluid encounters a violent collision with the wall and causes pressure increased instantaneously. But it was found that the pressure inside and outside at the right angle-1 is not the same, there is a pressure difference, because the fluid will produce centrifugal force at the right angle-1, resulting in a pressure difference; Between the right angle-1 and the right angle-2, there are pressure decays in a stepwise manner, because in this section, the fluid makes frictional contact with the wall, the pressure slowly decreases; when the right angle-2 is reached, the pressure increases again, just like the right angle-1. And when the outlet is reached, the pressure is also attenuated. The entire simulation shows that the polishing effect at the right angle-1 and the right angle-2 is better, and the polishing effect of the upper half of the Z-shaped tube is better than the lower half. So, in the actual processing, the outlet should be taken as an inlet, and then polished it once, it will get a uniform surface. When under different inlet pressures, the fluid pressure increases with the increase of the inlet pressure, and there will produce a greater pressure and friction force between fluid and surface. Numerous particles generate cyclic shearing and collision on the wall surface, the grinding efficiency will be improved. The turbulent kinetic energy is a indicator of turbulent flow development or decline. The greater the turbulent kinetic energy, the more severe the turbulent flow, the better the processing effect of abrasive flow, and the turbulent kinetic energy at different inlet pressures is shown in Fig. 4.
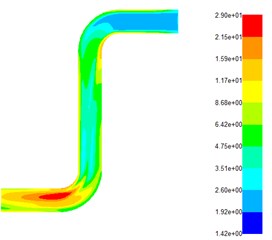
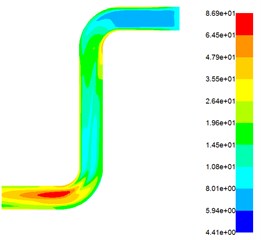
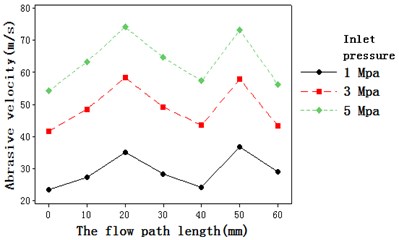
Fig. 4 shows that when the abrasive flow is at the same inlet pressure, the turbulent flow energy from the inlet to the right angle-1 is a slowly increasing process, because the fluid encounters a violent impact at the right angle-1, resulting in an increase in the turbulent flow energy, but It can be seen that the increasing turbulent kinetic energy is not too obvious, which also indicates that turbulence has not been fully developed. From the right angle-1 to the right angle 2, the turbulent kinetic energy slowly decreases. When reaching the right angle-2, the turbulent flow energy increases rapidly, the turbulence is fully developed, the turbulent flow effect is good, and the fluid is in close contact with the wall and a strong friction occurs to increase the material removal rate. When the fluid is at different pressures, the turbulent intensity increases as the inlet pressure increases. The greater the turbulence intensity, the better the polishing effect. To further analyze the change trend of the abrasive flow during processing, the turbulence intensity and fluid velocity at different inlet pressures were analyzed, as shown in Fig. 5 and Fig. 6.
Fig. 4Distribution of turbulent kinetic energy at different inlet pressures
a) Pressure-inlet = 1 MPa
b) Pressure-inlet = 2 MPa
c) Pressure-inlet = 3 MPa
Fig. 5 shows that there are two inflection points corresponding to the right angle-1 and the right angle-2 of the Z-shaped flow channel, respectively. At these two inflection points, the turbulent intensity reaches its maximum. At two right angles, when the flow channel changes drastically, the collision of the fluid with the wall causes the velocity to increase, and the turbulence intensity also increases. There is a slight decrease in turbulent intensity due to velocity decay after the fluid hits the wall. As shown in Fig. 6, there are two inflection points, and the formation process is similar to Fig. 5.
Fig. 5Trend of turbulence intensity
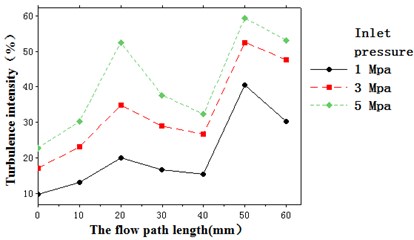
Fig. 6Trend of fluid velocity
5. Experimental analysis
Through the above simulation analysis, it is found that the inlet pressure is directly proportional to the material removal rate. The appropriate pressure can not only improve the grinding speed and efficiency, but also obtain a relatively smooth surface. To verify the accuracy of the simulation results, a self-developed abrasive flow polishing machine was used to polish the Z-shaped tube. The inlet pressures were 1 MPa, 3 MPa, and 5 MPa, respectively, and the experimental workpieces were marked as 1#, 2# and 3#, respectively, and the unprocessed workpiece is marked as 0#. A surface roughness test was performed on the four positions of the Z-shaped tube using a grating surface roughness measuring instrument, and the positions was inlet, right angle-1, right angle-2 and an outlet. And these were respectively marked as position-1, position-2, position-3, and position-4.
In order to facilitate analysis and comparison, the above test data is organized as shown in Table 1 and Fig. 11.
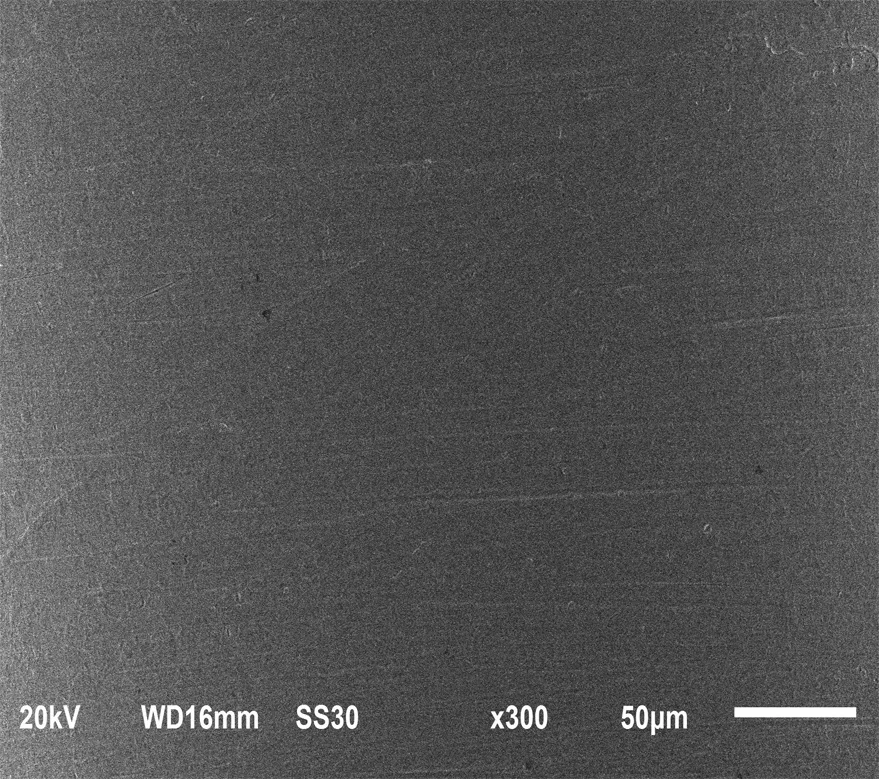
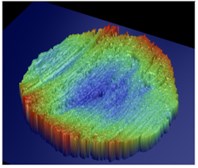
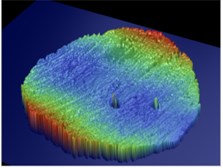
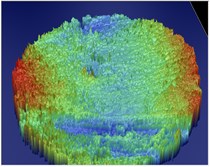
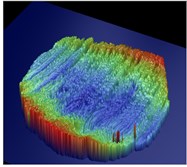
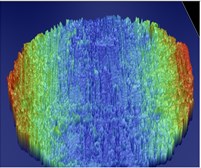
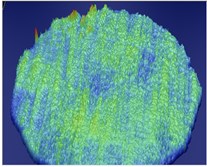
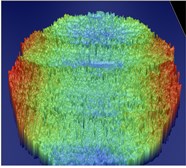
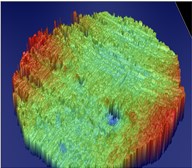
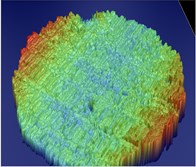
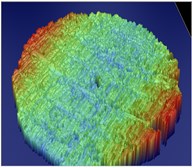
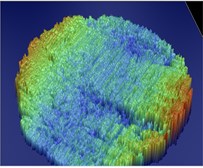
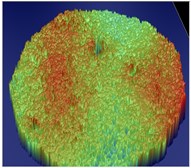
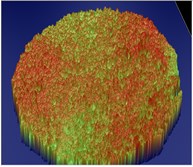
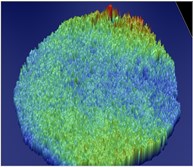
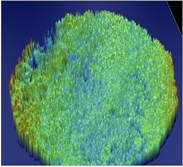
From Table 1 and Fig. 11, it can be seen that the surface roughness gradually decreases with the increase of the inlet pressure. Compared with the inlet and outlet, the surface roughness decreases more clearly at two right angles. This is because the collision between the abrasive flow and the wall at two right angles causes the speed to increase, and the abrasive and wall surfaces have better cutting and friction effects, so the surface roughness is lower. In order to further observe the surface topography, a scanning electron microscope was used to observe the inner surface of the part, as shown in Fig. 12.
Table 1Surface roughness at different locations
Workpiece number | Surface roughness (μm) | |||
Position-1 | Position-2 | Position-3 | Position-4 | |
0# | 1.37 | 1.38 | 1.35 | 1.32 |
1# | 1.06 | 0.93 | 0.97 | 1.13 |
2# | 0.82 | 0.76 | 0.77 | 0.84 |
3# | 0.56 | 0.50 | 0.55 | 0.59 |
Fig. 70#
a) Position-1
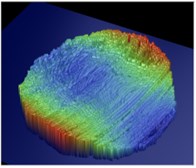
b) Position-2
c) Position-3
d) Position-4
Fig. 81#
a) Position-1
b) Position-2
c) Position-3
d) Position-4
Fig. 92#
a) Position-1
b) Position-2
c) Position-3
d) Position-4
Fig. 103#
a) Position-1
b) Position-2
c) Position-3
d) Position-4
Fig. 12 shows that as the inlet pressure increases, the inner surface of the part becomes smoother, the surface quality is greatly improved, and the use performance of the part is also improved. The abrasive flow processing technology becomes an effective means in the field of precision machining.
Fig. 11Surface roughness comparison chart
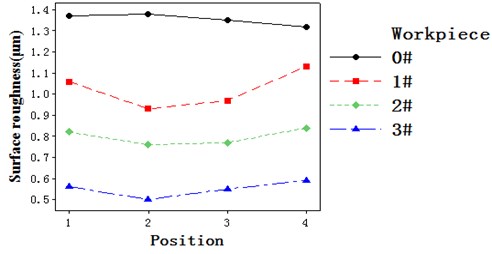
Fig. 12Surface topography at different inlet pressures
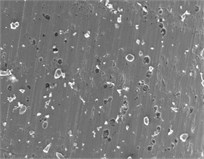
a) 0#
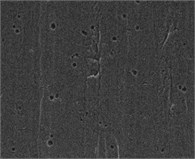
b) 1#
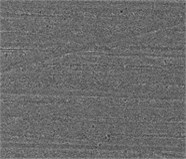
c) 2#
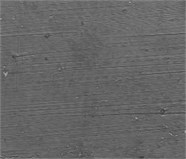
d) 3#
6. Conclusions
In this paper, the FLUENT software is used to simulate the Z-tube flow through the realizable - model. The turbulence intensity, the turbulent kinetic energy and the flow field pressure under different pressures are simulated and analyzed, and the correctness of the simulation is verified through experiments. Numerical simulation has become an effective theoretical tool for studying abrasive flow. The experimental results show that the inlet pressure has a significant influence on the surface roughness, and the reasonable pressure can efficiently process the parts to achieve the required surface quality and meet the requirements for use.
References
-
Junye Li, Jinglei Hu, Su Ningning, Xinming Zhang The numerical analysis in viscosity-temperature characteristics of solid-liquid T two-phase of abrasive flow polishing. Journal of Measurements in Engineering, Vol. 5, Issue 3, 2017, p. 115-124.
-
Yuan Q. L., Ji S. M., Tan D. P., et al. Analytical method for softness abrasive flow field based on low Reynolds K-ε model. Advanced Materials Research, Vol. 188, 2011, p. 230-235.
-
Li J. Y., Liu W. N., Yang L. F., et al. The development of nozzle micro-hole abrasive flow machining equipment. Applied Mechanics and Materials, Vol. 44, Issue 47, 2011, p. 251-255.
-
Wan S., Ang Y. J., Sato T., et al. Process modeling and CFD simulation of two-way abrasive flow machining. International Journal of Advanced Manufacturing Technology, Vol. 71, Issues 5-8, 2014, p. 1077-1086.
-
Li Chen, Ji Shiming, Tan Dapeng, et al. Study of near wall area micro-cutting mechanism and finishing characteristics for softness abrasive flow finishing. Journal of Mechanical Engineering, Vol. 50, Issue 9, 2014, p. 161-168.
-
Li Junye, Su Ningning, Zhao Weihong, Yin Yanlu, Hu Jinglei Study on the polishing of curved pipe parts by solid liquid two phase abrasive flow. Journal of Measurements in Engineering, Vol. 5, Issue 2, 2017, p. 59-67.
-
Li Jun Ye, Hu Jing Lei, Dong Kun, et al. Technological parameter optimization and quality effects on solid-liquid phase abrasive flow polishing. Optics and precision Engineering, Vol. 25, Issue 6, 2017, p. 1534-1546.
-
Li Junye, Hu Jinglei, Yang Zhaojun, et al. Effect on the quality of abrasive flow polishing the common rail pipe in size of discrete phase abrasive particle. Journal of Jilin University, Vol. 45, Issue 2, 2017, p. 492-499.
-
Singh S., Shan H. S., Kumar P. Parametric optimization of magnetic‐field‐assisted abrasive flow machining by the Taguchi method. Quality and Reliability Engineering International, Vol. 18, Issue 4, 2010, p. 273-283.
-
Kenda J., Pusavec F., Kermouche G., et al. Surface integrity in abrasive flow machining of hardened tool steel AISI D2. Procedia Engineering, Vol. 19, Issue 1, 2011, p. 172-177.
-
Shiming J. I., Li Tan, et al. Study on machinability of softness abrasive flow based on Preston equation. Journal of Mechanical Engineering, Vol. 47, Issue 17, 2011, p. 156.
About this article

The authors would like to thank the National Natural Science Foundation of China No. NSFC 51206011, Jilin province Science and Technology Development Program of Jilin Province No. 20160101270JC and No. 20170204064GX, project of Education Department of Jilin Province No. 2016386.
