Abstract
The drilling rate is one of the key parameters to measure the working performance of the road header. Set the drilling speed as the target variable, the quadratic regression model is established by using the master control parameters, such as cutter head torque, jack thrust, cutter head speed, and screw speed as design variables, then the prediction function of the drilling speed is obtained. The error of the regression function is determined by the fitting coefficient of determination, the modified coefficient of determination and the root mean square error, then the effect of different sample data mining methods on the fitting accuracy is studied. An optimization mathematical model is constructed. The quadratic programming algorithm is applied to solve the extreme values under different sample numbers, therefore, the tunneling performance is effectively improved. The research method has high computational efficiency, and the theoretical results are reliable.
1. Introduction
Since the emergence of coal mine road header, the analysis and prediction of its performance has been the focus of many scholars [1]. Through the evaluation of the mechanical performance of the road header, the risk of high capital costs in the excavation operation can be effectively reduced [2]. In the excavation work, the drilling speed is one of the key parameters to evaluate the performance of the road header, of which value thereof is influenced comprehensively by various working parameters. At present, there are many models for predicting the performance of road headers. Representative models include: Tarkoy [3] first proposed a model based on hardness to predict the drilling rate, but this model ignores the random nature of the rock mass and the mechanical characteristics of the road header. Zhao [4] introduced a predictive model, which uses the permeation rate as a function to be solved. Under this condition, the power and compressive strength of each excavation can be obtained. Bahri [5] uses the risk matrix method to predict the optimal excavation speed of the road header.
In order to improve the computational efficiency of the road header performance prediction model, this paper proposes a performance prediction method based on regression model. Through the error statistics and analysis of the approximate model, the validity of the research scheme is verified. Finally, through the effective optimization algorithm to search for the best parameters to meet the correlation of different parameters, the ultimate realization is tunneling performance prediction and optimization [6].
2. Establishment and analysis of regression model
2.1. The establishment of regression function
The regression model is essentially an approximate function, which uses a limited number of known parameters to fit an unknown functional relationship [7]. At present, there are many types of function expressions used in the regression model. Among them, the polynomial-based regression function can express a complex response relationship with simple parameters and has good robustness [8].
Before establishing the regression model, it is necessary to first establish the target variables and design variables. For the performance prediction model of the road header, it is assumed that the same rock layer satisfies the isotropy, so the rock hardness is not considered as a function variable. The drilling speed (, m/h) is used as the target variable, and the cutter head torque (, kN·mm), jack thrust (, kt), cutter head rotation speed (, r/min), screw speed (, r/min) and other four controllable driving parameters are used as design variables. As shown in Table 1, all discrete parameters are obtained through on-site engineering tests.
The least squares method is used to fit the intrinsic relationship between the target variable and the design variables (, , , ). The function expression is:
where is a regression function that needs fitting; is a fitting error, .
In order to improve the accuracy of the regression function, the interaction relationship between every two design variables is considered in the paper. The quadratic response expression is used to represent the regression function. Its expression is:
where , , are all undetermined coefficients.
Convert Eq. (2) to matrix form as followed:
In the formula, is the design matrix, which represents the sample vector of the regression model. is the regression coefficient vector.
Table 1Measurement values of target variables and design variables
Parameter / number | / kN·mm | / kt | / (r/min) | / (r/min) | / (m/h) |
1 | 1.99 | 1.21 | 1.2 | 14 | 0.66 |
2 | 1.91 | 1.12 | 1.3 | 10 | 0.44 |
3 | 1.98 | 1.05 | 1.2 | 9 | 0.34 |
4 | 1.90 | 0.99 | 1.1 | 10 | 0.62 |
5 | 1.67 | 0.83 | 1.9 | 19 | 0.33 |
6 | 1.73 | 0.87 | 1.7 | 8 | 0.43 |
7 | 1.76 | 0.88 | 1.6 | 6 | 0.48 |
8 | 1.80 | 0.94 | 1.4 | 13 | 0.32 |
9 | 1.84 | 0.91 | 1.3 | 9 | 0.36 |
The key to solving the regression function is the determination of each polynomial coefficient , , . In general, the least squares method can be used to process the error, first convert it to the parameter s, and its calculation expression is:
where is the actual discrete response; is the number of sample measurements.
It can be concluded that the solution of each element in the regression coefficient vector is:
Substituting the data in Table 1 into each formula, the regression function can be finally fit as:
2.2. Error analysis
Since the regression model is an approximate function, there must be an error between the actual target variable and if the error value is very small or within the allowable range. It can be indicated that the fitted regression model has good feasibility. In general, there are three kinds of parameters used for polynomial regression function error checking, such as fitting determination coefficient , correction determination coefficient , and root mean square error .
The calculation formula for fitting the coefficient of determination is:
where is the total square sum of the model; is the regression sum of squares; is the sum of squared residuals.
The total sum of squares is calculated as:
where is the actual measured value of the target variable, is the average value, is the number of sample measurements.
The calculation expressions of regression squared and residual squared sum are:
where is the target variable obtained by the regression function.
Calculation formula of correction coefficient is:
where is the number of polynomials in the regression function.
The root mean square error has an expression is:
Substituting the data in Table 1 into the error judgment formula, the final fitting accuracy of the regression model is shown in Table 2. As can be seen in Table 2, the regression model has a low fitting error. To further meet engineering needs, the root mean square root error can be verified by increasing the number of samples.
Table 2Fitting accuracy of regression model
(optimum value is 1) | (optimum value is 1) | (optimum value is 0) |
0.92123 | 0.89022 | 0.0552 |
3. Analysis of predictive model characteristics
3.1. Sample data mining method
A good predictive model can achieve good accuracy even without adjusting parameters, which requires a high stability of the objective function. In order to further verify the reliability of the regression model for performance prediction, the root mean squared error of the model error is calculated using different sample data mining methods (including on-site measurement samples). At present, there are many methods for sampling data points, such as full factor method, partial factor method, orthogonal design method, center combination method, and Latin method. In this paper, orthogonal design method, center combination method and Latin square design method are used to obtain discrete design variables and target variables respectively. These three methods all use Tab.1 to determine the effective range of data mining points, and increase the total number of samples by increasing the number of horizontal factor.
3.2. Error analysis with different sample sizes
The RMS comparison results between the samples of different data points and the measured values are shown in Fig. 1, Fig. 2, and Fig. 3, respectively. It can be seen in these figures that the root mean square error of the sampling method for different sample data is similar [9]. Compared with the orthogonal design method and the Latin square design method, the tunneling performance predicted by the center combination method is used to predict the regression function and the actual target variable. The error between the two is smaller; the regression function fitted in the paper has higher precision and good feasibility, and can be directly used to optimize the mathematical model [10].
Fig. 1Comparison of central composite fitting method and measured method
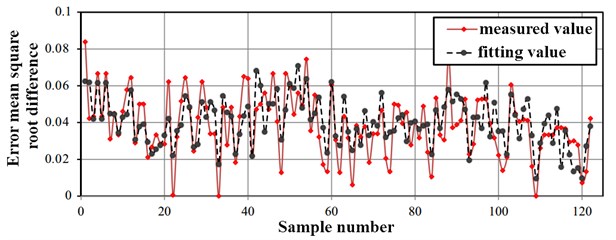
Fig. 2Comparison of orthogonal design fitting method and measurement method
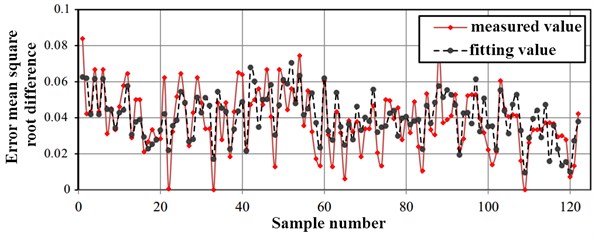
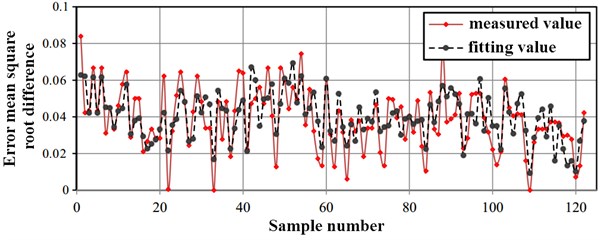
Fig. 3Comparison of Latin square design fitting method and measurement method
4. Research of drilling performance optimization
4.1. The construction of the optimized mathematical model
According to engineering practice, it is known that the excavation work has significant complex nonlinear characteristics. Under a certain excavation parameter, it is difficult to achieve the best production efficiency, that is, to ensure that the drilling speed is at a maximum value. Through the regression model fitted in this paper, combined with advanced optimization algorithms, the maximum target variable within the design variable can be searched efficiently. The calculation result is not limited to the current rock layer structure. In essence, the optimization of the excavation performance is to achieve the optimization of the excavation parameters through mathematical calculations and to obtain the maximum drilling speed parameters. The prediction of the performance of the road header is a key issue in realizing the full-face tunneling engineering of coal mines. From the regression model, the objective function is not a simple linear function. The entire prediction calculation depends on multiple variables and has high reliability.
The optimization mathematical model is the basis for searching for extremely target variables, including objective functions and constraints, where the objective function is constructed based on a regression function, as shown in Eq. (12). According to the working conditions of the road header, it can be seen that under normal conditions, the cutter head torque range is 1500-3000 kN·m, the jack thrust range is 800-1500 t, and the rotary speed range of the cutter head is 1-3 r/min. The speed range is 5-15 r/min:
where , are the minimum and maximum values of the four design variables, respectively.
4.2. Application of extremum search algorithm
According to the characteristics of the optimized mathematical model constructed, it can be known that the optimization problem of excavation performance is a typical quadratic nonlinear optimization problem, and it has multiple independent variables, and there are interactions among the independent variables. Therefore, the optimization value of the mathematical model is not a single solution. For the processing of this type of mathematical model, there are more algorithms applied in engineering: genetic algorithm, simulated annealing algorithm, particle swarm optimization algorithm, and quadratic programming algorithm and so on.
Taking into account the characteristics of each algorithm, the quadratic programming algorithm is used to achieve the search of the target. The quadratic programming algorithm can perform direct search when dealing with quadratic polynomial functions, but the convergence speed is difficult to control. If the accuracy judgment is unreasonable, it is difficult to meet the termination criterion, so the self-adjustment convergence speed needs to be continuously adjusted according to the constraints of the regression function.
Target extreme value search is a typical iterative algorithm. In order to improve the stability of the calculation process and achieve global convergence, the total number of samples can be defined first, and then the linear search factor can be combined with the Lagrange value function to obtain reasonable results. The iteration step. In the self-adjustment of the convergence speed, it is necessary to change the iteration step according to the accuracy judgment criterion. In general, the iterative step size can be used to characterize the difference between before and after each iteration:
where is the design variable after iteration, is the design variable calculated by the current th search, and is the iteration length of the current th search calculation.
In the calculation of the secondary sequence plan, two basic operation steps need to be completed: the determination of the search direction and the update of the iteration step size. The two steps are in an alternating state until the accuracy reaches the determination target.
4.3. Analysis of optimization results
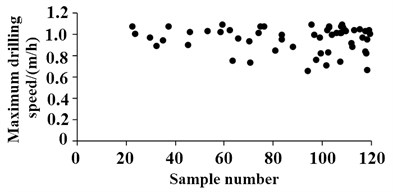
In this paper, MATLAB performs an extremum search under the condition that the total number of samples is 20 to 120 (obtained from the central composite design method), and finally the optimal solution set is shown in Fig. 5. As can be seen in Fig. 4, the larger the number of samples, the more solution sets that satisfy the constraints, and the maximum value of the optimization goal is 1.12. According to the convergence criteria and accuracy criteria, the optimal configuration of each design variable at this time can be concluded as shown in Table 3.
Fig. 4The optimal solution set for different sample sizes
In order to ensure the safety under the excavation conditions, the optimized objectives and design variables obtained are to be constructed on site. According to the observation of the surface subsidence amplitudes, it was found that the settlement value of more than 90 % of the observation points was less than 1.5 mm during the entire excavation process, which fully satisfied the coal mine production requirements.
Table 3Optimization goals and design variables
Drilling speed / m/h | Cutter torque / kN·m | Jack thrust / t | Cutter speed / r/min | Screw speed / r/min |
1.12 | 2680 | 1380 | 1.33 | 10.56 |
5. Conclusions
For coal mine production, reasonable drilling conditions can effectively improve the excavation efficiency. In this paper, based on the regression model construction method, the performance of the road header is predicted and optimized. The main conclusions are as follows:
(1) The quadratic response expression is applied to represent the regression function of the excavation work with high accuracy. It can be known that he fitting coefficient of determination, the modified coefficient of determination and the root mean square error all meet the engineering requirements.
(2) During the study of the sampling method, the root mean square error obtained by the orthogonal design method, the Latin square design method and the center combination method are separately compared with the measured value. The results show that the center combination method has higher fitting accuracy.
(3) Through the quadratic programming method, the optimization mathematic model is searched to obtain the optimal configuration of parameters, such as cutter head torque, jack thrust, cutter head rotation speed, screw speed, etc., which can effectively improve the drilling speed, and meet the requirements of settlement.
References
-
Li W., Xinxin L. Study on the driving performance evaluation method of the shield cutter disk system. Modern Tunnel Technology, Vol. 16, Issue 5, 2017, p. 108-114.
-
Wanji L. Study on performance prediction model of road header. Coal Mine Machinery, Vol. 33, Issue 5, 2017, p. 1-3.
-
Tarkoy P. J., Byram J. E. The advantages of tunnel boring: a qualitative/quantitative comparison of D&B and TBM excavation. Hong Kong Engineer, Vol. 26, Issue 4, 1991, p. 1008-1014.
-
Fangfang Z. H. Study on rapid detection method for permeability of sand tunneling layer. Heilongjiang Science and Technology Information, Vol. 44, Issue 10, 2016, p. 247.
-
Bahri Najafi Mohammad, et al. A fuzzy logic model to predict the out-of-seam dilution in longwall mining. International Journal of Mining Science and Technology, Vol. 25, Issue 1, 2015, p. 91-98.
-
Fenghai M., Dun L., et al. Construction risk analysis of cantilever road header in Subway Tunnel Engineering. Journal of Liaoning Technical University, Vol. 27, Issue 2, 2012, p. 145-148.
-
Junke K. Consistency of the wavelet estimation of a class of regression functions. Journal of Beijing University of Technology, Vol. 41, Issue 4, 2015, p. 636-640.
-
Minqian L., Runchu Z. H. A criterion and algorithm for designing supersaturated three level factors. Journal of Applied Mathematics, Vol. 23, Issue 2, 2000, p. 161-171.
-
Rui G. Research and application of coal mine safety input optimization mathematical mode. Journal of Chinese Coal, Vol. 38, Issue 3, 2012, p. 105-108.
-
Jiti G. The convergence rate of estimation in a partial linear model. Journal of Mathematics, Vol. 32, Issue 5, 1905, p. 658-669.
About this article

The paper is supported by the Youth Talent Innovation Project (BZXYQNLG201703).
