Abstract
The research work proposes, Design and implementation of Solar power fed permanent magnet synchronous motor using improved DC-DC Converter and modified p-q theory based shunt active filter for reducing vibrations in drive for Industrial Applications. The Proposed research consists of both buck and boost converter, linking dc voltage unit and works in discontinuous conduction for boosting the battery life time. The improved converter provides multiple output capability using B4-inverter which reduces the cost of a proposed system considerably. In addition, for the reduction of harmonics in three phase system modified p-q module is enhanced. Comparing with the existing module, modified p-q module act as a triggering module for inverter to reduce harmonics in three phase systems and vibration across the motor, moreover the structured circuit would result in reduction of total harmonic distortion (THD), torque ripples, compact power switches, DC source reckoning and reduced starting current. The simulation of buck boost converter is considered, and its performance parameters were analyzed for different operating conditions. Thus, for industrial applications, the bidirectional converter and inverter fed permanent magnet synchronous motor drive is employed with the reduction in vibration, which is more efficient than conventional method. Here both simulation and experimental setup has been employed with a satisfying closed loop performance.
Highlights
- Lower THD results in higher power factor, lower peak currents and maximum efficiency.
- Low THD is such an important feature in power systems.
- Modified p-q module act as a triggering module for inverter to reduce harmonics in three phase systems
- The modified p-q module (2.10 %) is tested with MATLAB Simulink module which results more efficient than conventional (2.67 %).
- The proposed converter works in discontinuous conduction for boosting the battery life time.
- Multiple output capability is appropriated for B4-inverter which reduces the cost of a proposed system considerably.
1. Introduction
By resentment with the challenges of global warming, the renewable energy has been extremely hopeful because of its soaring effectiveness. Based on the electrical properties like sparkling energy, the power generated is harshly burnt due to the climatic conditions or it has transients which are slow, and the output voltage is easily affected by the load changes [1]. In addition, the secondary components like storage elements, control boards, etc., are typically essential to provide the exact process of clean energy [2-4]. As a result, in the power converter stage it is necessary to generate clean energy with different voltage levels. Normally, single input single output (SISO) DC-DC converter with different voltage gains are incorporated to satisfy the burden of different voltage levels. So that the control system is too composite, and its individual cost is elevated [5-7]. Thus, the figure 1 shows the different configurations of SISO converter to one common bus.
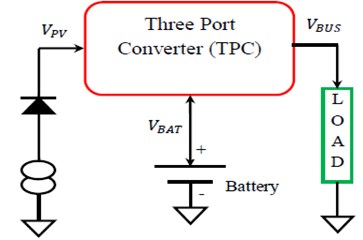
However, in conventional hybrid power system, such type of arrangement is complicated with very high cost. The stimulation of the present study is to design and develop a single input multiple output (SIMO) converter for increasing the voltage gain and efficiency of a converter system, to decrease the difficulty of system control and to reduce the designing cost of the converter. The proposed SIMO converter involves Three Port Converter (TPC) interfaced with renewable sources, storage elements and loads, which work simultaneously in two stage conversion whose efficiency is reduced [8-12]. So, a single stage conversion is implemented in order to increase the efficiency of a converter which is shown in figure 2. Due to its complicated structural design there is an increase in system losses, which may be treated well for a renewable energy system and it gains lot of attentions recently [13-18].
To reduce the power losses further, TPC architecture is introduced by [19, 20]. TPC features include single-stage conversion between any two of the three ports, greater system efficiency and lesser number of components, rapid response and integrated power management among the ports with a central control.
Fig. 1Conventional multiport converter architecture
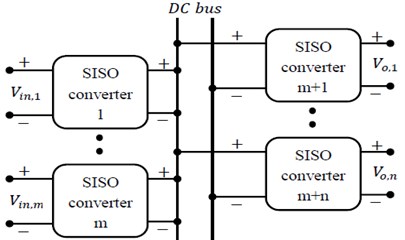
Fig. 2Block diagram of TPC with single-stage conversion
2. Materials and methods
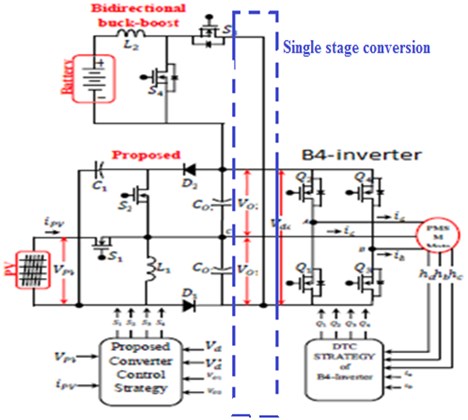
The proposed improved converter operated in different modes of operation. As the proposed converter comprises of Buck Boost (BB) switch (), power sharing switch (), two power diodes ( and ), a single BB inductor (), intermediate capacitor (), and output capacitors ( and ). Similarly, the bidirectional BB converter consists of buck switch (), boost switch () and power diodes ( and ). On the output side, the rear end B4-inverter includes of four switches ( to ) and a resistive load as shown in Fig. 3.
2.1. Proposed converter modes of operation
Switching state 0: Power semiconducting switch turns “ON”, Power semiconducting switch (𝑺𝟏) turns “OFF”, the inductor starts discharging through the current flowing across it. At this instant of time as a result inductor charges the Intermediate Capacitor . Accordingly, Intermediate Capacitor gets energized illustrated in Figure 3(a).
Switching state 1: Power semiconducting switch turns “ON”, applied voltage current starts discharging. Accordingly, the inductor starts charging through the energy transmitted across it. At this instant of time as a result inductor charges the Intermediate Capacitor as shown in Figure 3(a). Concurrently, electrons in the in between capacitor drops starts deenergizing. Accordingly, solar charges Inductor and the Intermediate Capacitor charges the output voltage balancing capacitor and it gets energy as illustrated in Figure 3(b).
Switching state 2: Power semiconducting switch turns “OFF” electrons in the inductor drops starts deenergizing. As a result, Inductor charges the output voltage balancing capacitor with diode (), illustrated in Figure 3(c).
The efficiency of system is indirectly proportional to the total power losses. The total power losses, in the proposed converter, are the conduction, switching, diode and inductor losses. Occurrence of the conduction losses is due to the declining voltage across the device as well as the current flow through the device striking in chorus. Switching losses are sustained by the concurrent occurrence of voltage and current on the device while switching. The key waveforms of proposed converter are shown in Fig. 3(b). , , , , and are the current through the input supply, inductor , diodes and , and capacitor respectively [20].
Fig. 3a) Modes of operation, b) converter parameters [20]
![a) Modes of operation, b) converter parameters [20]](https://static-01.extrica.com/articles/19985/19985-img3.jpg)
a) Summary: conduction of circuit. Switching state 0: Inductor charges the Intermediate Capacitor . Switching state 1: Solar charges Inductor and the Intermediate Capacitor charges the output voltage balancing capacitor . Switching state 2: Inductor charges the output voltage balancing capacitor with diode
![a) Modes of operation, b) converter parameters [20]](https://static-01.extrica.com/articles/19985/19985-img4.jpg)
b)
2.2. Losses in inductor and diode
The TPC used PMSM motor drive with single stage conversion system is illustrated in Fig. 5. The newly introduced system consists of PV powered proposed converter, B4-Inverter fed PMSM motor and battery powered bidirectional converter that function as a backup supply for the load operating under demand condition. As the proposed converter proposed comprises of BB switch (), power sharing switch (), two power diodes ( and ), a single BB inductor (), intermediate capacitor (), and output capacitors ( and ). Similarly, the bidirectional BB converter consists of buck switch (), boost switch () and power diodes ( and ). On the output side, the rear end B4-inverter includes four switches ( to ) and a PMSM motor. Fig. 5 illustrates an alternate proposal of Fig. 4 i.e., TPC converter for the implementation of PMSM motor drive with single stage conversion system. The battery powered converter circuit coupling at dc link has been used generally as shown in Fig. 5. The battery powered converter circuit coupling at inductor () terminal is also introduced. The chief benefit of this configuration is that the dc-dc converter does the processing of just a portion of the power generated, permitting greater efficiency in comparison with dc link coupling configuration. On similar line with this idea, an integrated power circuit is presented in this research work along with the following multiple functions: battery charge, battery regulator, and step-up or step-down conversion and load voltage regulation.
Fig. 4Proposed TPC employed B4-inverter fed PMSM motor drive system two stage conversion
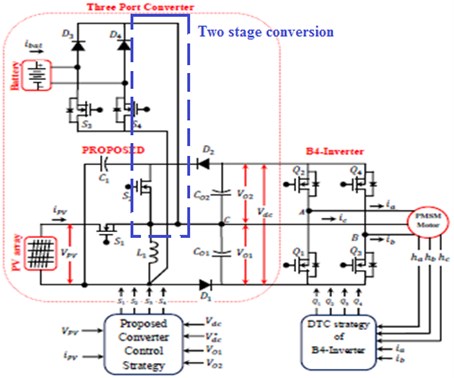
As pointed out by now duty of switch () present in proposed converter is to extract the maximum power from PV panel using the P&O MPPT algorithm. On the contrary, the regulation of the total output voltage to the required value is the responsibility of the power sharing switch () present in proposed converter. In addition, when the generated energy is sufficient to drive the PMSM motor, the excess energy is utilized for charging the battery. When the power switch () is turned on, the inductor () stores the energy, and thereafter there is energy flow from the PV module to the battery. If the energy that is generated at the PV module is not adequate to drive the PMSM motor, then the power system acts as a boost converter, making the energy transfer from the battery to the PMSM motor. When the switch () is turned on, the inductor () stores the energy from the battery, and if the switch () is turned off, the energy that is stored in the inductor gets transferred to the PMSM motor. The command signals of the switches and are complementary. Depending on the relationship between PV generation power and load demand power, proposed standalone Multioutput buck boost converter will work in different power flow modes such as battery charging domain to converter (BCDTC), PV domain (SPVD) and battery discharging domain to converter (BDDTC).
• Solar power charges the battery and drives the load using converter (BCDTC). It operates in different operation, here the four switches conduct alternately, and PV power drives the load and charges the battery.
• Solar power does not charge the battery and drives only the load using converter (SPVDTC). It operates in different operation, here the four switches conduct alternately, and PV power drives the load. At this condition the solar power is high enough to drive the load and it does not charge the battery.
• Solar power discharges the battery and drives load using converter (BDDTC). It operates in different operation, here the four switches conduct alternately, and PV power drives the load demand takes place at this situation and also it discharges the battery.
Fig. 5Proposed TPC employed B4-inverter fed PMSM motor drive system single stage conversion
3. Results and discussions
The characteristics of a 80 W PV module is simulated using MATLAB tool based on equivalent circuit model. The simulation is examined in three different operation modes, i.e. ideal, battery charging and battery discharging of TPC. The simulation results are that in the beginning i.e., from 0 to 0.4 sec, solar insolation of (200 W/m2) is applied on PV, then at 0.4 sec, the solar insolation is increased suddenly from 200 W/m2 to 800 W/m2, and at 0.8 sec. T4. The simulation of the controller is listed separately in order to denote the looping and the unit time constant of the controller and its simulation specifications are shown in Table 1.
Table 1Simulation specifications for proposed system
S. No | Objects | Values |
1 | Maximum PV module voltage | 15 V |
2 | Maximum PV module current | 3 A |
3 | Maximum PV module power | 80 W |
4 | TPC output voltage | 48 V |
5 | TPC output power | 40 W |
6 | Rated PMSM motor power (Torque = 0.125 Nm, Speed = 2000 Rpm, dc link voltage = 24 V, number of poles = 8) | 39 W |
7 | Nominal power of battery (Nominal voltage = 12 V, Nominal current = 7 A/h) | 85 W/h |
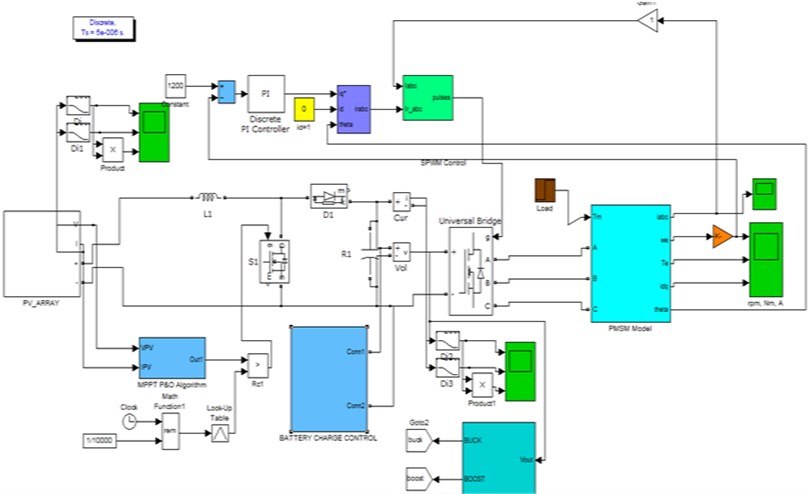
3.1. Simulink circuit model of proposed enhanced circuit
Fig. 6 shows the simulation model of a proposed converter with single stage conversion circuit.
3.2. Solar PV panel
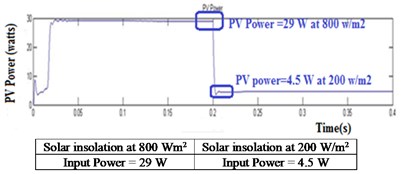
Fig. 7 shows the simulation results of solar PV panel, at 200 W/m2 solar irradiation, the input voltage is 15.75 V, input current is 0.4 A, and input power is 4.5 W. At 800 W/m2 solar irradiation, input voltage is 17.5 V, input current is 1.7 A and input power is 29 W.
Fig. 6Simulink circuit model of proposed enhanced circuit
3.3. Conduction of battery
The Fig. 8 shows the simulation results of the Battery, during charging the voltage is 12.2 V, current is 0.5 A and power is 7 W. During discharging, the voltage discharges to 12.1 V, current 0.6 A and power 7.8 W.
3.4. Simulation result of PMSM
The Fig. 9(a), (b) and (c) shows the simulation result of Permanent magnet synchronous motor, where the motor speed is 1200 rpm and the torque is 3 N-m.
3.5. Simulation result of PMSM stator current
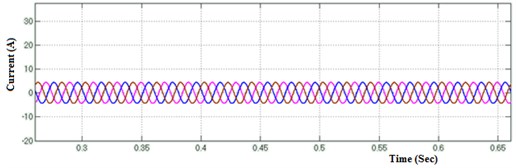
The simulation result of stator current in permanent magnet synchronous motor is 4.4 A, and it is shown in Fig. 10.
Fig. 7Simulation results of solar PV panel
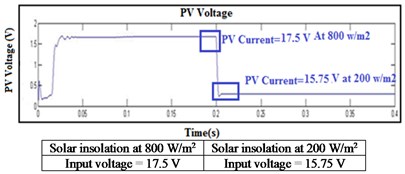
a) Solar Pv panel input voltage
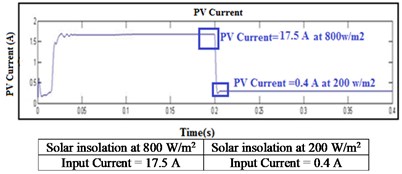
b) Solar Pv panel input current
c) Solar Pv panel input power
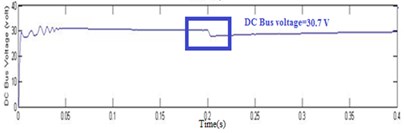
d) DC-DC converter output voltage 30.7
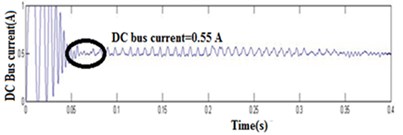
e) DC-DC converter output current 0.55 A
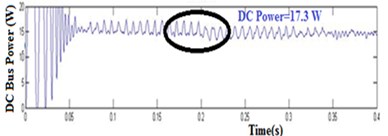
f) DC-DC converter output power 17.3
Fig. 8Simulation results of the battery
a) Battery voltage. Charging voltage: 12.2 V, discharging voltage: 12.1 V
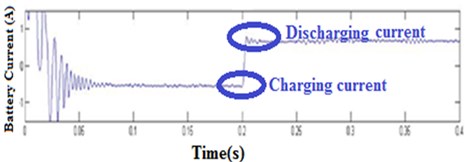
b) Battery current. Charging current: 0.5 V, discharging current: 0.6 A
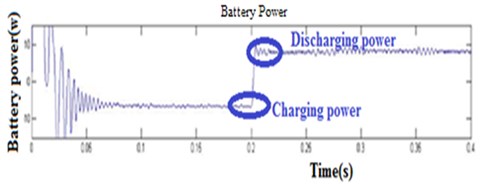
c) Battery power. Charging power: 7 W, discharging power: 7.8 W
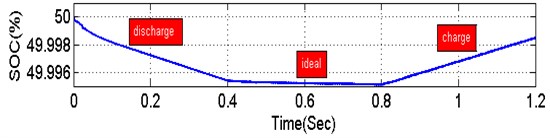
d) State of charge of battery
Fig. 9Simulation result of permanent magnet synchronous motor
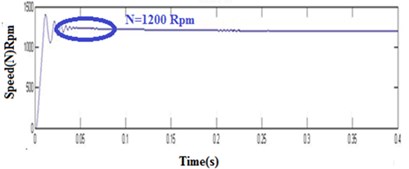
a) PMSM motor speed 1200 rmp
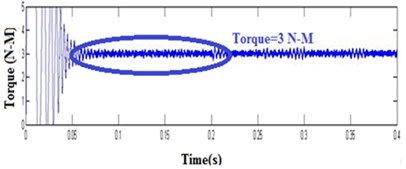
b) PMSM motor torque 3 Nm
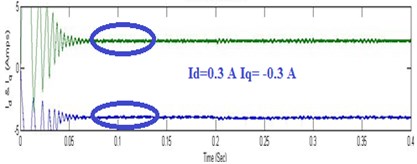
c) PMSM active and reactive current
4. Experimental analysis of TPC and B4-Inverter fed PMSM motor drive
The experimental verification is conducted for validating the proposed TPC and B4-Inverter fed PMSM motor drive. The experimental illustration of TPC and B4-Inverter fed PMSM motor drive is presented in Fig. 11.
Fig. 10PMSM stator current 4.4 A
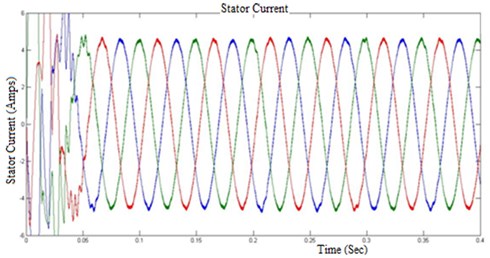
Fig. 11Experimental illustration for TPC and B4-Inverter fed PMSM motor drive
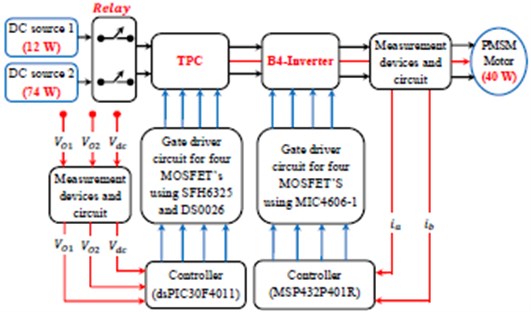
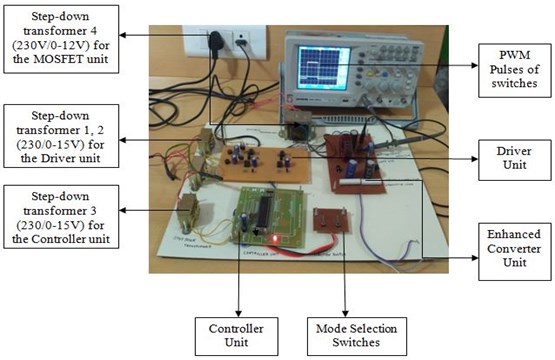
The hardware TPC and B4-Inverter fed PMSM motor drive consists of 16-Bit digital signal Peripheral Interface Controller (dsPIC30F4011) for TPC control, 32-Bit Mixed-Signal Microcontroller (MSP432P401R) for B4-Inverter control, gate driver circuit for TPC and B4-Inverter MOSFET’s. The feedback signals are processed with the help of measurement devices and circuit, and thereafter the control signals to the TPC and B4-Inverter are transmitted by a dsPIC30F4011 and MSP432P401R.The TPC is coupled among PV, Battery and load ports. A 40 W PMSM motor is powered by a B4-Inverter in the form of a load port of the new system. The TPC input power is changed from 12 W to 74 W which in turn, is utilized for exemplifying the performance of the proposed system. The controller unit consists of the dsPIC controller which controls the whole process. The supply is given to the unit with the help of step-down transformer through the rectifier and voltage regulator. Experimental Setup of Enhanced Three Port Converter fed PMSM Motor is shown in Fig. 12. Table 2 shows its hardware specification.
Table 2Hardware specification
S. No | Name of the equipment | Range |
1 | Battery | 12 V/4.7 AH |
2 | Step down transformer | 230 V/12 V |
3 | Step down transformer | 230 V/5 V |
4 | MOSFET | IRFZ24N 17 A, 55 V, 0.07 ohm, N-CHANNEL, Si, POWER, MOSFET, 220AB |
5 | PMSM motor | 220 V, 100 mA, 60 rpm |
4.1. Experimental setup
The above Fig. 12 shows the experimental setup of an enhanced three port converter fed permanent magnet synchronous motor.
Fig. 12Experimental setup of enhanced three port converter fed PMSM motor
4.2. Modeling of PMSM motor to develop torque and power for DC-DC converter
The PMSM voltage equation are given in Eqs. (5), (6):
The alternating flux links are Eqs. (7), (8):
Substituting Eqs. (7), (8) in (5) and (6) we get:
By using matrix for direct axis and quadrature axis we get:
The torque across PMAM motor is:
The general torque is:
The voltage and torque equation at , axis of PMAM motor is:
Converting to cos power:
So above equations are used for the developed power, based on that total harmonic distortion are calculated for reducing vibrations at PMAM motor which can be applied for the industrial applications.
4.3. Total harmonic distortion
The THD is defined as the root mean square value of the total harmonics of the signal divided by the RMS value of its fundamental signal. Lower THD results in higher power factor, lower peak currents and maximum efficiency. Low THD is such an important feature in power systems. To get an equation for THD recall that the average power of the cosine at a single harmonic is given by:
where, 1 represents the fundamental and ≥ 2 are the harmonics. Recall also that the total average power in the signal is given by the sum of the average powers at each harmonic:
As such the THD can be calculated by finding the total power in all harmonics divided by the power in the fundamental:
In reality, there is no way to measure to the infinite harmonic, so we usually truncate the THD measurement to a certain harmonic. Note also that you need the Fourier coefficients for this measurement but that the spectrum analyser provides values in dBmV. Recall that:
Because the THD is a ratio of powers it is unit-less and is expressed as a percentage. It can also be expressed in dB as:
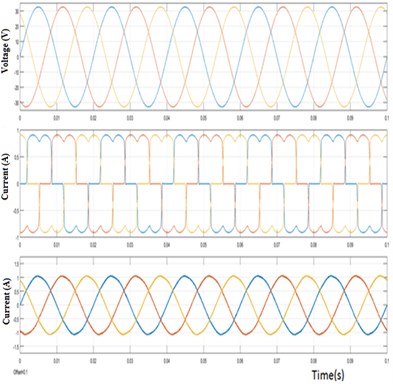
The shunt APF is connected in the nonlinear load with the filter inductance and operates in a closed loop. The three-phase active power filter comprises of diode clamped IGBTs with diodes, a dc-bus capacitor, RL-filter, PLL with seven level inverter and switching signal generator. Fig. 13 indicates the overall voltage and current without filter. The modified p-q theory based seven level MLI output waveform is shown in Fig. 14, also THD analysis with and without filters are shown in Fig. 15 and 16.
Fig. 13Without filter: a) output voltage, b) output current
a)
b)
Fig. 14Modified p-q theory based seven level MLI output waveform
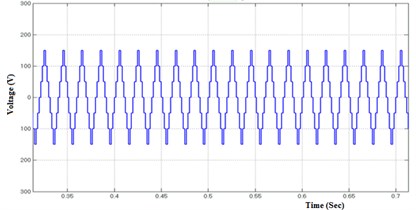
Fig. 15THD analysis of PLL logic without filter
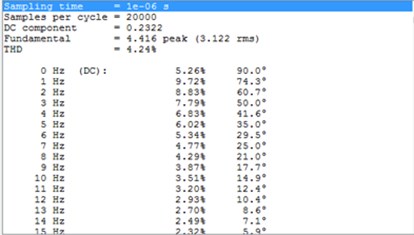
The three phase seven level inverter has an output current THD analysis of existing PLL module as indicated in the Fig. 17.
Fig. 16Output Voltage waveform with filter
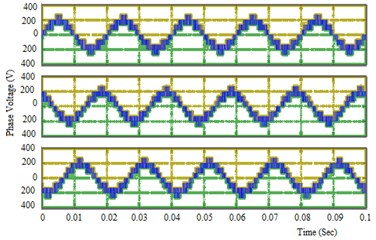
Fig. 17THD analysis of existing PLL module
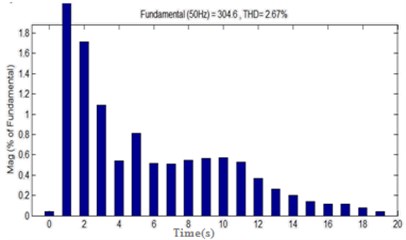
Fig. 18THD analysis of signal without filter in modified p-q theory
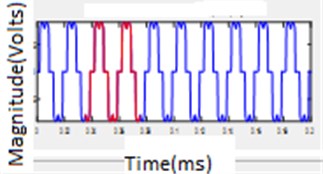
Fig. 19Various source signal for modified p-q model
The Fast Fourier Transform (FFT) is used to measures the order of harmonics with the fundamental frequency at 50 Hz of the source current. The magnitudes of the harmonics are plotted under non-linear load condition which is illustrated in the Fig. 18. From the result, it is observed that modified p-q theory-based shunt APF is compensating the harmonics effectively. The inputs signal applied to the proposed shunt active power filter is mentioned in the Fig. 19, which is the analysis of THD without filter.
Table 3 shows the Comparison of THD analysis with and without filter for various order harmonics. From this table it is concluded that the proposed p-q theory for reducing harmonics across the circuit is more efficient and vibration across the motor gets reduced. Table 4 indicates the comparison of conventional and Proposed theory.
Table 3Comparison of THD analysis
Harmonic order | System without SAPF | System with SAPF using ‘p-q’ method | System with SAPF using ‘d-q’ method |
3rd order | 0.03 % | 0.09 % | 0.06 % |
5th order | 23 % | 0.75 % | 0.28 % |
7th order | 11 % | 0.35 % | 0.16 % |
9th order | 0.03 % | 0.04 % | 0.03 % |
11th order | 9 % | 0.30 % | 0.12 % |
13th order | 7 % | 0.26 % | 0.08 % |
15th order | 0.03 % | 0.01 % | 0.01 % |
17th order | 6 % | 0.24 % | 0.08 % |
19th order | 5 % | 0.17 % | 0.07 % |
Table 4Comparison of proposed and conventional method
Sl. No | Filter techniques | THD (%) | |
Without filter | With filter | ||
1 | Conventional module | 40.24 | 2.67 |
2 | Proposed method modified p-q theory | 30.38 | 2.10 |
4.4. Experimental result of PWM pulses to and
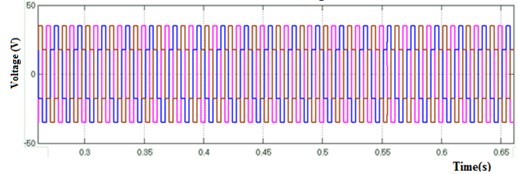
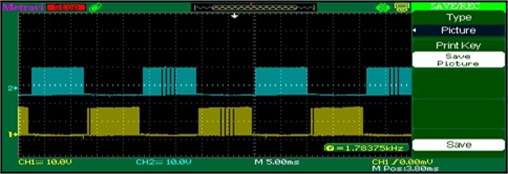
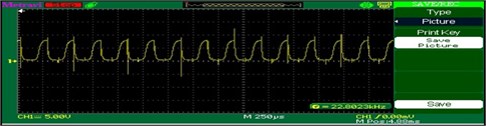
Fig. 20 indicates the waveform of PWM Pulses across the switches and . These PWM pulses are generated by B4 inverter and these pulses are fed through the PMSM motor drive.
Fig. 20Waveform of PWM pulses S1 and S2
4.5. Experimental result of PWM pulses to and
Fig. 21 indicates the waveform of PWM Pulses across the switches and . These PWM pulses are generated by B4 inverter and these switching pulses are fed through the PMSM motor drive.
4.6. Experimental results of DC-DC converter output voltage
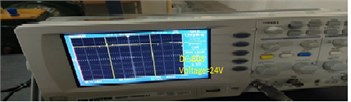
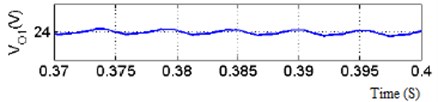
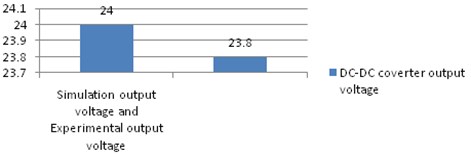
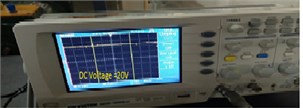
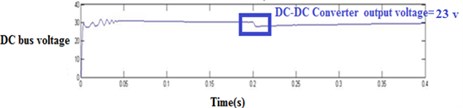
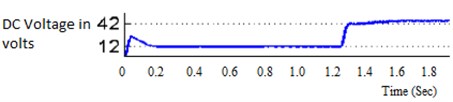
Fig. 22 indicates the performance of a converter during solar insolation of 800 W/m2, it generates an output voltage of about 24 V and the converter works efficiently.
Fig. 21Waveform of PWM pulses to S1 and S4
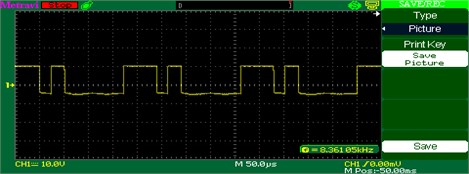
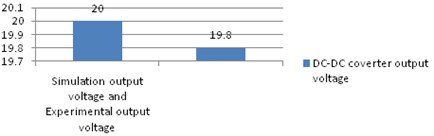
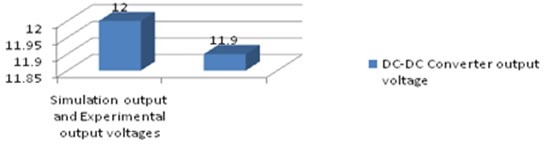
Fig. 22a) Output voltage waveform of DC-DC converter experimental, b) simulation at insolation at 800 W/m2, c) output voltage at 800 W/m2 simulation and experimental bar chart
a)
b)
c)
The performance of the converter during solar insolation of 600 W/m2 and it generates an output voltage of about 20 V as shown in Fig. 23.
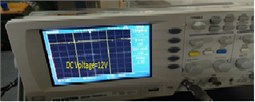
Fig. 24 indicates the performance of the converter during solar insolation of 200 W/m2, it generates the output voltage about 12 V.
Fig. 23Output voltage waveform of DC-DC converter: a) experimental, b) simulation at insolation at 600 W/m2, c) output voltage at 600 W/m2 simulation and experimental bar chart
a)
b)
c)
4.7. Experimental results of battery
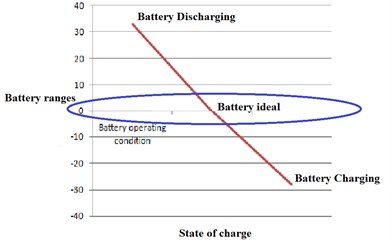
4.7.1. Battery in ideal state
Fig. 25 indicates the battery is in ideal state, the voltage from DC-DC converter is 24 V. At this time the solar alone delivers voltage to the load and the converter operates efficiently and regulate the output voltage.
Fig. 24Output voltage waveform of DC-DC converter: a) experimental, b) simulation at insolation 200 W/m2, c) output voltage at 200 W/m2 simulation and experimental bar chart
a)
b)
c)
Fig. 25Output voltage waveform of battery: a) experimental, b) simulation in ideal state, c) line chart of battery discharging state
a)

b)
c)
4.7.2. Battery in charging state
The below Fig. 26 indicates the battery is in charging state, the voltage from DC-DC converter is of about 20 V. At this time the solar delivers large amount of power to load. So that the converter efficiently operates, regulate the voltage and the battery charges.
4.7.3. Battery in discharging state
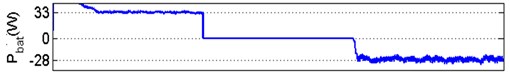
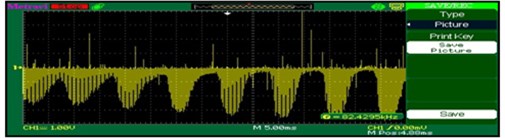
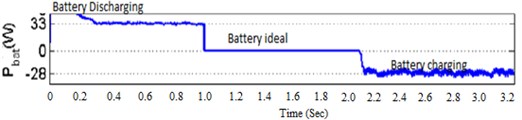
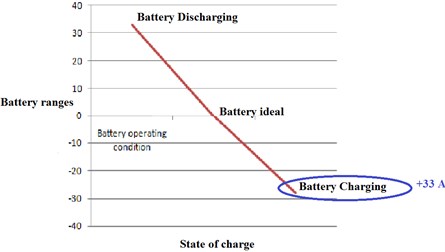
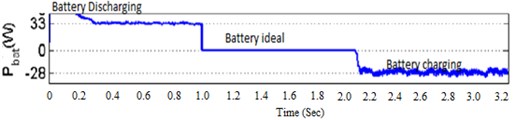
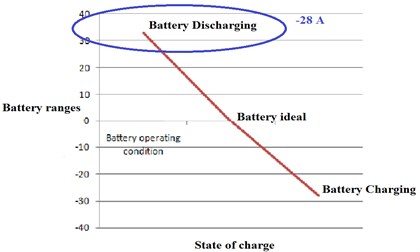
The below Fig. 27 indicates that the battery is in discharging state, the voltage from DC-DC converter is 12 V. At this time the solar delivers voltage to the load is not sufficient, so that the battery discharges –28 A to the load, according to that converter efficiently regulate the voltage.
Fig. 26a) Output voltage waveform of battery experimental, b) simulation in charging state, c) line chart of battery charging state
a)
b)
c)
Fig. 27Output voltage waveform of battery in discharging state: a) experimental, b) simulation, c) line chart
a)
b)
c)
The Performance Comparison of conventional and proposed converters with various objects are shown in Table 5.
Table 5Performance comparison of conventional and proposed converters with various objects
Substances | Various two output converters | |||
Converter accessible by Sathish Kumar et al. (2017) [20] | Converter accessible by Sathish Kumar et al. (2018) [21] | Proposed improved converter for the single stage system | ||
Switch count total | 2 | 2 | 2 | |
Total number of diodes count total | 2 | 2 | 2 | |
Total number of capacitors count total | 2 | 2 | 2 | |
Total number of inductors count total | 1 | 1 | 1 | |
Total number of components count total | 7 | 7 | 7 | |
Conversion | Buck | Boost | Buck-Boost | |
Switching states convolution | Easy | Multifarious | Easy | |
Converter accessible by Sathish Kumar et al. (2017) [20] | ||||
Switching states | States of output capacitors | |||
– | ||||
0 | 0 | – | Deenergize | Deenergize |
1 | 0 | – | Energize | Energize |
1 | 0 | – | Energize | Deenergize |
Converter accessible by Sathish Kumar et al. (2018) [21] | ||||
Switching states | States of output capacitors | |||
0 | 0 | 0 | Energize | Energize |
0 | 1 | 1 | Energize | Deenergize |
0 | 0 | 0 | Deenergize | Deenergize |
1 | 0 | 1 | Energize | Deenergize |
1 | 1 | 0 | Energize | Energize |
1 | 0 | 0 | Deenergize | Deenergize |
Proposed TPC converter | ||||
Switching states | States of output capacitors | |||
– | ||||
0 | 1 | – | Energize | Deenergize |
1 | 0 | – | Deenergize | Energize |
0 | 0 | – | Energize | Deenergize |
5. Conclusion
The proposed converter works in discontinuous conduction for boosting the battery life time. Moreover, its multiple output capability is appropriated for B4-inverter which reduces the cost of a proposed system considerably. In addition, for the reduction of harmonics in three phase system modified p-q module is enhanced. Here, the conventional and modified p-q module act as a triggering module for inverter to reduce harmonics in three phase systems and vibration across the motor. The modified p-q module (2.10 %) is tested with MATLAB Simulink module which results more efficient than conventional (2.67 %). From the experimental results, it is concluded that the low power filtering operations are effective instead of high pass filter which is connected in parallel with the PMSM motor. Finally, the Total Harmonic Distortion (THD) of the proposed method is reduced to 2.33 % experimentally. In proposed converter, the average efficiency achieved is 78 %, which is more efficient when compared to other domains.
References
-
Blaabjerg F., Freysson S., Hansen H. H., Hansen S. A new optimized space-vector modulation strategy for a component-minimized voltage source inverter. IEEE Transactions of Power Electronics, Vol. 12, Issue 4, 1997, p. 704-714.
-
El Badsi B., Bouzidi B., Masmoudi A. DTC scheme for a four-switch inverter fed induction motor emulating the six-switch inverter operation. IEEE Transaction of Power Electronics, Vol. 28, Issue 7, 2013, p. 3528-3538.
-
El Badsi B. Six-switch inverter emulation based DTC strategy dedicated to three-switch inverter-fed induction motor drives. Computational Mathematics Electrical Electronics Engineering, Vol. 32, Issue 1, 2013, p. 289-301.
-
El Badsi B., Bouzidi B., Masmoudi A. Bus-clamping-based DTC: An attempt to reduce harmonic distortion and switching losses. IEEE Transactions of Industrial Electronics, Vol. 60, Issue 3, 2013, p. 873-884.
-
Fang J., Zhou X., Liu G. Instantaneous torque control of small inductance brushless DC motor. IEEE Transactions of Power Electronics, Vol. 27, Issue 12, 2012, p. 4952-4964.
-
Ellis M. W., Von Spakovsky M. R., Nelson D. J. Fuel cell systems: efficient, flexible energy conversion for the 21st century. Proceedings of the IEEE, Vol. 89, Issue 12, 2001, p. 1808-1818.
-
Gao F., Blunier B., Simoes M. G., Miraoui A. PEM fuel cell stackmodeling for real-time emulation in hardware-in-the-loop application. IEEE Transactions on Energy Conversion, Vol. 26, Issue 1, 2011, p. 184-194.
-
Jidin A. B., Idris N. R. B. N., Yatim A. H. B. M., Elbuluk M. E., Sutikno T. A wide-speed high torque capability utilizing overmodulation strategy in DTC of induction machines with constant switching frequency controller. IEEE Transaction of Power Electronics, Vol. 27, Issue 5, 2012, p. 2566-2575.
-
Joice C. S., Paranjothi S. R., Kumar V. J. S. Digital control strategy for four quadrant operation of three phase BLDC motor with load variations. IEEE Transactions on Industrial Applications, Vol. 9, Issue 2, 2013, p. 974-982.
-
Kang S. J., Sul S. K. Direct torque control of brushless DC motor with non-ideal trapezoidal back-EMF. IEEE Transaction of Power Electronics, Vol. 10, Issue 6, 1995, p. 796-802.
-
Kumar R., Singh B. BLDC motor-driven solar PV array-fed water pumping system employing zeta converter. IEEE Transactions on Industry Applications, Vol. 52, Issue 3, 2016, p. 2315-2322.
-
Kumar R., Singh B. Solar PV powered BLDC motor drive for water pumping using Cuk converter. IET Electric Power Applications, Vol. 11, Issue 2, 2017, p. 222-232.
-
Liu Y., Zhu Z. Q., Howe D. Direct torque control of brushless DC drives with reduced torque ripple. IEEE Transaction of Industrial Applications, Vol. 41, Issue 2, 2005, p. 599-608.
-
Sathishkumar S., Meenakumari R., Jobanarubi E., Anitta P. J. S., Ravikumar P. Microcontroller Based BLDC Motor Drive for Commercial Applications. Power Electronics and Renewable Energy Systems. Lecture Notes in Electrical Engineering, Springer, New Delhi, Vol. 326, 2015, p. 829-841.
-
Shanmugam S., Ramachandran M., Kanagaraj K., Loganathan A. Sensorless control of four-switch inverter for brushless DC motor drive and its simulation. circuits and systems, Vol. 7, Issue 6, 2016, p. 726-734.
-
Stirban A., Boldea I., Andreescu G. Motion-sensorless control of BLDC-PM motor with offline FEM-information-assisted position and speed observer. IEEE Transactions of Industrial Applications, Vol. 48, Issue 6, 2012, p. 1950-1958.
-
Sung P. J., Han W. P., Man L. H., Harashima F. A new approach for minimum-torque-ripple maximum-efficiency control of BLDC motor. IEEE Transaction of Industrial Electronics, Vol. 47, Issue 1, 2000, p. 109-114.
-
Taheri, Rahmati A., Kaboli S. Efficiency improvement in DTC of six-phase induction machine by adaptive gradient descent of flux. IEEE Transaction of Power Electronics, Vol. 27, Issue 3, 2012, p. 1552-1562.
-
Boora A., Zare F., Ghosh A. Multi-output buck-boost converter with enhanced dynamic response to load and input voltage changes. IET Power Electronics, Vol. 4, Issue 2, 2011, p. 194-208.
-
Boora A., Nami A., Zare F., Ghosh A., Blaabjerg F. Voltage sharing converter to supply single-phase asymmetrical four-level diode-clamped inverter with high power factor loads. IEEE Transactions on Power Electronics, Vol. 25, Issue 10, 2010, p. 2507-2520.
-
Sathish Kumar Shanmugam, Arumugam Senthilkumar Design and implementation of DC source fed improved dual-output buck-boost converter for agricultural and industrial applications. Journal of Vibroengineering, Vol. 19, Issue 8, 2017, p. 6433-6454.
-
Sathish Kumar Shanmugam, Arumugam Senthilkumar Implementation of solar photovoltaic array and battery powered enhanced DC-DC converter using B4-inverter fed brushless DC motor drive system for agricultural water pumping applications. Journal of Vibroengineering, Vol. 20, Issue 2, 2018, p. 1214-1233.
Cited by
About this article

