Abstract
In order to evaluate the shear deformation characteristics, the direct shear tests for the rock-like specimens with regular sawtooth were carried out in the laboratory. The different asperity angles and different normal stress conditions were considered and the dilatancy characteristics and the corresponding failure modes were analyzed accordingly. The uncommon asperity angle of 25°, 40° and 55° have been selected to compare with the common angles, which can study the differences in detail. Studies show that when the normal stress keeps constant, the peak shear strength increases first and decreases with the increasing asperity angle afterwards. It is because the force causing sawtooth damage under tensile failure is less than the force under shear failure. When the asperity angle keeps constant, the greater the normal stress, the greater the peak shear strength. The larger the normal displacement of dilatancy angle and dilatancy are caused by larger asperity angle. According to the verification, the test results are in good agreement with the analytical results. It should be noted that the analytical results presented locate below the test result curves, which is due to the small values of c and m in the formula. The sliding failure is usually induced when the asperity angle or the normal stress is small. On the contrary, the tensile damage normally occurs while the asperity angle is large enough.
Highlights
- A direct shear tests for the rock-like specimens with regular sawtooth were carried out.
- The different asperity angles and different normal stress conditions have an important influence on failure mode.
- The asperity angle is in direct proportion to the peak shear displacement under the same normal stress.
- The normal stress is in direct proportion to the peak shear strength and the peak shear displacement under the same asperity angle.
1. Introduction
Most of the literature start with experimental studies to explore the factors that influence the mechanical properties of the structural plane [1-6]. Barton [7] found experiments, the factors that affect the regular sawtooth surface are the mechanical properties of the rock material, the asperity angles, filling material, the thickness of infill and so on. However, influence factors involved are relatively wide, making it difficult to directly and accurately estimate the shear characteristics of the sawtooth structural surface. Therefore, it is necessary to accurately study the influence of these parameters on the test piece by simulating the shear characteristics of the filled rock joints.
In the past, a series of filling joints were studied under the influence of different factors, and most of them were taken experimentally. Xia et al. [8] based on the indoor direct shear test, the relationship between the peak displacement of the joint and the roughness of the joint is found to be inversely related to the normal stress, and a new empirical formula for the peak displacement of the structural plane is proposed. According to sawtooth shear test results carried out by Shen et al. [9], the shear strength parameters of joints are proportional to asperity angles. Dilatancy characteristics of the structural surface are inversely proportional to the normal stress. Homayoun Jahanian [10] found the effects of forward and reverse shear on the shear strength of filled rock joints. The conclusions conducted that low asperity angles joints have higher shear strength in the forward shear cycle, but in the high asperity angle joints, the result is converse. Jafari et al. [11] repeated cyclic shearing of two kinds of artificial joints to simulate the shear resistance of the joints under strong and weak earthquakes and proposed to consider the shear rate, normal stress and cycle number for such artificial joints.
Numerous studies of infilled rock joints with constant normal load (CNL) were carried out to explore shear characteristic [12-17]. And the asperity angle is one of the main influencing factors in the peak shear strength of experimental studies. H. S. Welideniya et al. [18] found when ( is infilled thickness and a is asperity height) is small, the combined effect of the basic friction angle and the joint roughness angle is inversely proportional to . The tests result reported and carried out by T. T. Papaliangas et al. [19-20] indicate that the shear strength of a joint infilled with the frictional material will between shear strength of the joints and the minimum shear strength of the system. And friction coefficient (peak and residual) are expressed as percentages and predicted by an equation of the form. Yang and Chiang [21] studied the shear behavior of composite rock cracks with the asperity angle of 15° and 30° when a normal load is constant. At the same time, the influence of the asperity angle and the base length on the crack shear behavior is studied.
Some people also use the way of numerical simulation to study the factors which affect the shear strength on infilled rock joints [22-30]. A series of direct shear tests by using PFC2D method was carried out by Bahaaddini et al. [23]. This numerical simulation method uses densely packed contact circular particles to simulate the intact rock. PFC2D can simulate explicitly joint surfaces by modifying a smooth joint (SJ) model. The results of this paper indicate that both the SJ normal stiffness and the SJ shear stiffness on the peak shear strength in sliding mode. Discrete FLAC3D approaches results reported by Lin et al. [24] that, the failure mode of the bolt’s changes from axial tensile failure to tensile shear failure with the inclination increasing. Meanwhile, the axial force of the bolt is gradually reduced, and the lateral shear force is gradually increased. The existing true triaxial stress was modified by Asadi et al. [25, 26] for making shear experiments with CNL. PFC2D was used to imitate the direct shear test carried out. The results show that as the roughness of the fracture surface increases, the failure surface changes from smooth to rough. At the same time, in order to study the correlation between the fracture shear strength and the direction, the test was carried out by loading the specimen with two shearing forces in opposite directions. The result reported by Chen [27-29] is a 3-D anisotropic constitutive model aimed at describing the dynamic response of these specimens. It is based on rate-dependent continuum damage constitutive relations. Crack closure effects and damage-induced anisotropy are included in the model. And the directional growth of damage is related to the directional growth of material intrinsic permeability. Numerical simulations of damage induced by shock waves show good agreement with the experiments for various confinement levels of the specimens.
Researches mainly explore the shear strength of filled rock joints influenced by effects of different factors during the past decades, while this paper focuses on the influence of asperity angles. The asperity angle has a significant effect on failure mode and shear characteristic and, at the same time, the asperity angle changes the height of sawtooth as well. In this paper, the shear strength of rock joints with different asperity angles is tested with CNL. Accordingly, this paper also analyzed the influence of normal stress on infilled rock joints, as the normal stress is a necessary aspect in studies. Therefore, the combined effects of asperity angles and normal stresses on failure modes are worth researching. Most researchers usually study regular common special angles, such as 30°, 45° and 60°. Thus, this paper chooses the uncommon angles like 25°, 40° and 55° to verify whether the corresponding failure modes match the modes of common angles or not. Finally, the failure modes are concluded to explain the causes of the failure of the specimen.
2. Experimental study
2.1. Specimen preparation
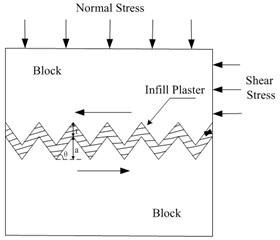
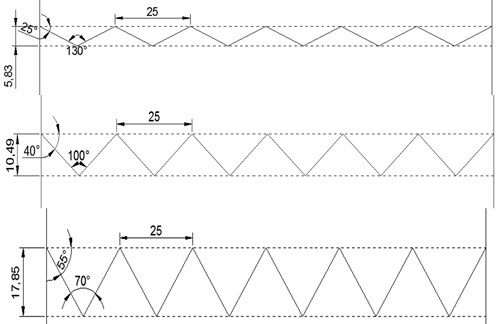
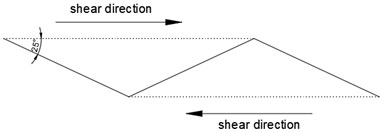
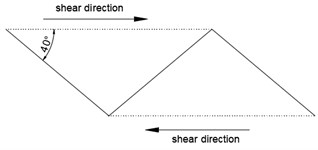
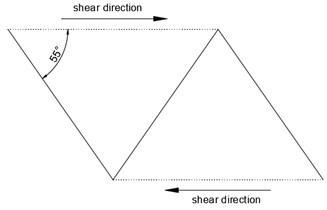
In the test, the blocks were a mixture of 42.5 Portland cement, fine sands which particle size less than 2 mm and water with a weight ratio of 2:2:1. The specimen size is 150 mm×150 mm×150 mm, the width of a single sawtooth is 25 mm, the number of the sawtooth is 6, which means the height varies with the asperity angle. The asperity angles of the structure surface was 25°, 40° and 55°, as shown in Fig. 1. The plaster is used for 1:2 filling, that is / was 0.5. In order to improve the accuracy of the test results, the specimens were layered in the pouring process and tamped in a timely manner. At the same time, the specimens were kept in the curing box for 28 days after standing in the mold for 24 hours to increase the stability of the specimens. The basic mechanical parameters of the plaster are shown in Table 1.
Fig. 1Experimental models: a) the specimen containing infilled plaster, b) θ= 25°, 40° and 55° with no infilled plaster
a)
b)
Table 1Basic mechanical parameters of materials
Compressive strength (MPa) | Tensile strength (MPa) | Friction angle (°) | Cohesion (MPa) | Poisson ratio | Elastic modulus (GPa) | Density (kg/m3) | |
Infilled plaster | 1.15 | 0.26 | 29.5 | 0.83 | 0.31 | 11.2 | 1.32×10³ |
42.5 Portland cement | 51.75 | 3.94 | 41.6 | 4.39 | 0.22 | 33.0 | 2.08×10³ |
2.2. Penetration tests
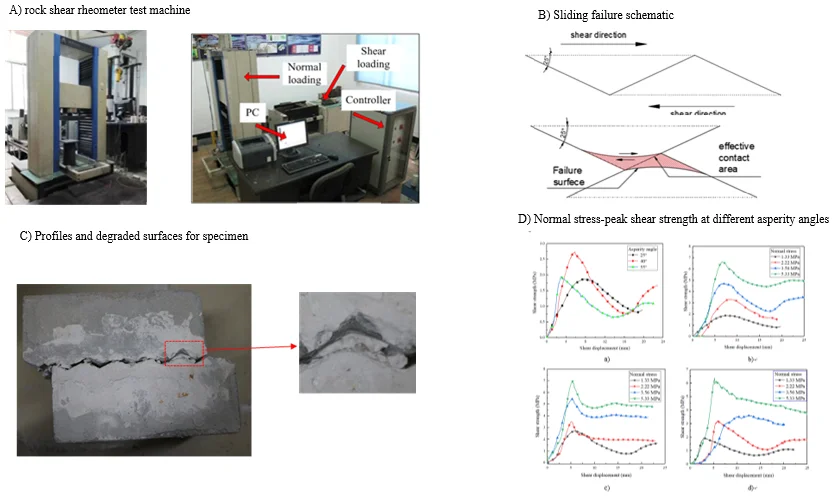
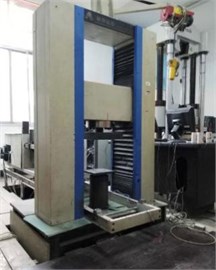
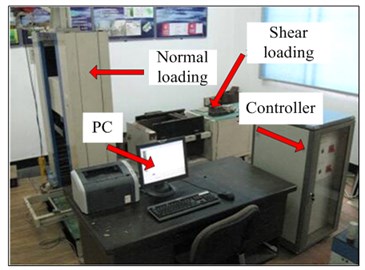
RYL-600 rock shear rheometer testing machine, which is composed of normal and shear loading systems, control system and PC system, is shown in Fig. 2. The maximum vertical and horizontal loads of the machine were 600 KN and 300 KN. To diminish friction effects, the top and lateral surfaces of the block were lubricated before testing. In the test, the shear mechanical characteristics of regular sawtooth surfaces with different asperity angles of 25°, 40° and 55° under different normal stresses were evaluated. Since the specimen is easily fractured under high normal pressure, the test was conducted at normal pressures of 30 KN (1.33 MP), 50 KN (2.22 MP), 80 KN (3.56 MP) 120 KN (5.33 MP). The normal loading rate was 100 N/S and the test plan is shown in Table 2. Shear begins after the normal load has stabilized for 30 minutes. A constant shear rate of 2 mm/min and a shear displacement of 20 mm were applied. At the same time, the normal and shear displacements, the normal and shear stresses ware recorded every few seconds. The shear test was stopped when the residual strength was stable.
Table 2Specimen number (let σ is the normal stress)
A | B | C | D | |
1 | 25° and 1.33 MPa | 25° and 2.22 MPa | 25° and 3.56 MPa | 25° and 5.33 MPa |
2 | 40° and 1.33 MPa | 40° and 2.22 MPa | 40° and 3.56 MPa | 40° and 5.33 MPa |
3 | 55° and 1.33 MPa | 55° and 2.22 MPa | 55° and 3.56 MPa | 55° and 5.33 MPa |
Fig. 2RYL-600 rock shear rheometer test machine: a) normal loading, b) parts of the test machine
a)
b)
3. Analysis of the experimental results
3.1. Failure modes
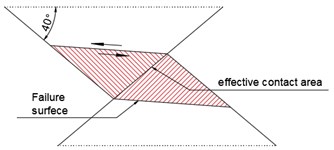
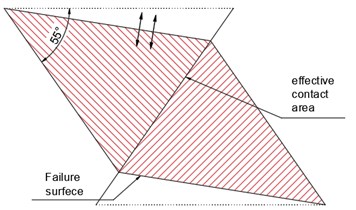
The results of the comprehensive shear stress-strain curves and the test results show that the types of specimen failure are mainly affected by the asperity angle. This is because of the fact that the asperity angle normally has an effect on the effective contact area between the upper and bottom parts of the specimen, resulting in an increase in the peak shear strength. When the upper part of the specimen climbs before the specimen destroyed, the contact area between the upper and bottom parts means the effective contact area, as shown in Figs. 3(b), 4(b) and 5(b). With the increasing asperity angle, the failure mode changes and the effective contact area is increasing as well. In addition, the height of sawtooth has an effect on the effective contact area obviously.
3.1.1. Sliding failure
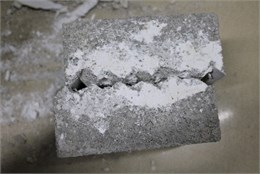
When the asperity angle is 25° and the normal stress is 1.33 MPa or 2.22 MPa, the shear displacement curve basically displays a sliding failure curve. The specimen slips along the joint surface and the sawtooth tip wears while it is not sheared. The asperity angle does not change, and the joint surface undergoes the dilatancy effect is more obvious than other asperity angles. In the area close to the joint surface, the block is squeezed which is mainly caused by shear damage. The sawtooth before shearing is shown in Fig. 3(a), it shows that the failure surface mostly performs arc shape after direct shear test and the sliding failure schematic is shown in Fig. 3(b). On the other hand, the specimen A-1 is mainly caused by the sliding failure, as shown in Fig. 3(c). The sawtooth portion of the specimen structural surface was ground, and the surface was worn, but there is not any damage basically. It should be noted that the climbing effect is obvious during the practical destruction.
Fig. 3a) The sawtooth of A-1, b) sliding failure schematic, c) profiles and degraded surfaces for specimen A-1
a)
b)
c)
Fig. 4a) The sawtooth of A-2, b) Shear failure schematic, c) profiles and degraded surfaces for specimen A-2
a)
b)
c)
3.1.2. Shear failure
The difference between the shear failure and the sliding failure is obvious. The sawtooth before shearing is shown in Fig. 4(a). Simultaneously with the normal stress increases, the constraints of the specimen are larger and the dilatancy effect is smaller. In the meantime, the infilled plaster is squeezed more seriously. The sawtooth tip of the specimen undergoes a significant shear failure under the shear force, and the damage mainly occurred in the middle of the sawtooth. The failure surface nearly a horizontal line after the direct shear test and the sliding failure schematic is shown in Fig. 4(b). As shown in Fig. 4(c), infilled plaster is almost completely destroyed, and the basic level of the surface is destroyed as well. For the specimen A-2, the shear failure is mainly induced. Under the low normal stress condition, the failure mode of the specimen mainly changes from sliding failure to shear failure with the increase of the asperity angles.
3.1.3. Tensile failure
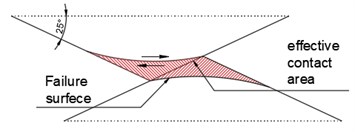
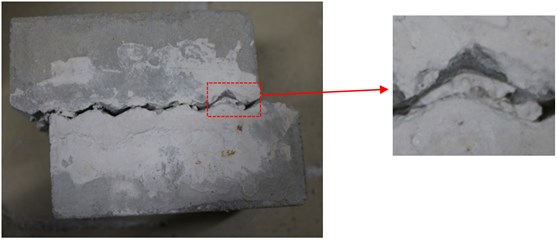
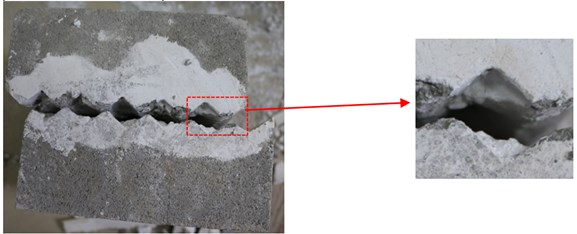
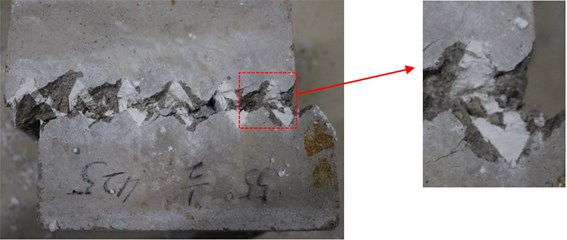
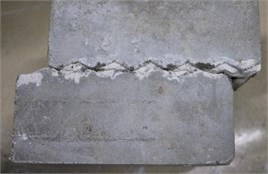
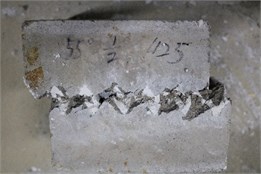
When the asperity angle of the specimen is large such as 55° or the normal stress is 5.33 MPa, the main damage occurred is a tensile failure. The sawtooth portion of the specimen is directly sheared from the location of the bottom, and there are obvious traces of cracks and sawtooth damage. At the same time, the cutting effect is more obvious during the practical damage process. When the normal stress and the asperity angle are large, the effective contact area of the sawtooth increased, resulting in increasing friction between the upper and bottom block. Also, the force between the sawtooth form a bending moment. The bending moment and friction induce the formation of the final pull to crack afterwards. Compared with shear failure, the destruction of tensile failure is more severe. As shown in Fig. 5, the infilled joints are squeezed closely with the increasing damage area. For the specimen B-3, the tensile failure mainly occurs.
Fig. 5a) The sawtooth of B-3, b) tensile failure schematic, c) profiles and degraded surfaces for specimen B-3
a)
b)
c)
3.2. Analysis of strength characteristics
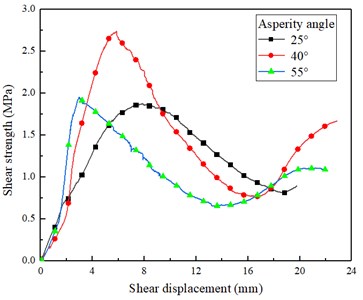
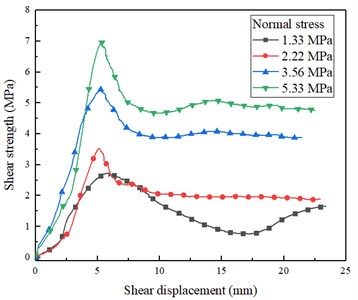
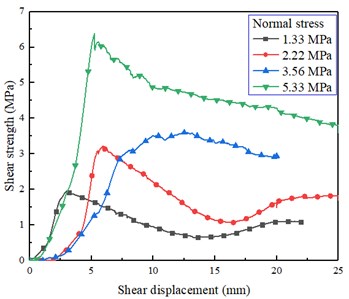
Fig. 6(a) depicts different shear stress-displacement curves of asperity angles under the normal stress of 1.33 MPa. During the early stage of shear displacement, the shear strength increases rapidly, basically showing a linear relationship. And the slope increased by the increasing asperity angles. When the peak shear strength was reached, the shear stresses begin to decrease as the shear displacement increases. After the participation curve undulating wavy and the second peak is lower than the first one. When the asperity angle is 25°, 40° and 55°, the peak shear displacement are 7.65 mm, 5.81 mm and 2.99 mm, respectively. It can be seen that under the same normal stress, the larger the asperity angle is, the smaller the peak shear displacement is. Fig. 6(a) depicts different shear stress-displacement curves of normal stresses under the asperity angle of 40°.
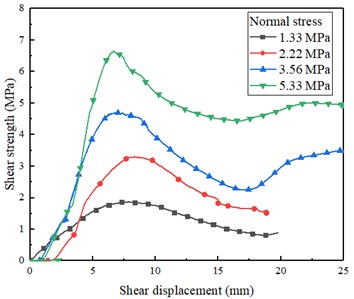
In the early stage of micro fracture compaction, the faster the shear stress rises, the greater the normal stress is. The entire residual curves do not show significant fluctuations. However, the residual strength of the specimen with 1.33 MPa is relatively small, while the specimens with 2.22 MPa, 3.56 MPa and 5.33 MPa display obvious residual strengths. Under the same normal stress, the residual strength is proportional to the normal stress. The peak shear displacements of 2.22 MPa, 3.56 MPa and 5.33 MPa curves also increase with the increase of normal stress. As shown in Fig. 6(b) and 6(c), the trend of shear stress-displacement curves is almost the same. But in Fig. 6(d), the shear stress-displacement carves are a little different which due to the tensile failure mode.
Fig. 6Typical shear stress-displacement curves: a) asperity angles under the normal stress of 1.33 MPa, b) asperity angle of 25° under different normal stresses, c) asperity angle of 40° under different normal stresses, d) asperity angle of 55° under different normal stresses
a)
b)
c)
d)
3.3. Analysis of asperity angle on peak shear stress
Fig. 7 depicted that the peak shear strength of the same asperity angle increases with the increase of normal stress. There is a linear relationship between the peak shear strength and normal stress. However, under the same normal stress, the peak shear strength was not increased with the increase of asperity angle. The peak shear strength at the asperity angle of 40° is the greatest, while the difference between 25° and 50° is not obvious. The overall trend is that the curve increases first and then decrease. And the effective contact area becomes greater with the increasing asperity angles. Since the force causing sawtooth damage under tensile failure is less than the force under shear failure, the peak shear strength of 55° is smaller than that of 40°. Besides, the peak shear strength of 25° is smaller than that of 40° resulted from the failure mode changes from sliding to shear. In addition, the shear force at failure is increasing by increasing angle.
The obvious tensile cracks can be seen in Fig. 8(c). At the same time, the asperity angle of 55° shear effect is more intense, pulling a wider range of cracks. This is because the infilled plaster is relatively soft and squeezed to produce a stress component perpendicular to the sawtooth surface. It induces a large tensile stress at the bottom of the sawtooth. Thin specimen coupled with weak tensile strength can result in the tension damage as well. The surface and side of the specimen with the asperity angle of 25° are almost nondestructive, and the failure mode is sliding failure. The failure surface of the specimen with the asperity angle of 40° mostly occurred in the middle of sawtooth, and the failure mode is a shear failure.
Fig. 7Normal stress-peak shear strength at different asperity angles
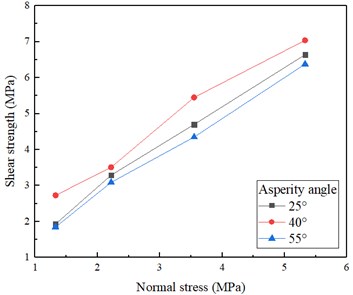
Fig. 8View of specimens: a) A-1, b) C-2, c) B-3
a)
b)
c)
3.4. Analysis of the dilatancy characteristics
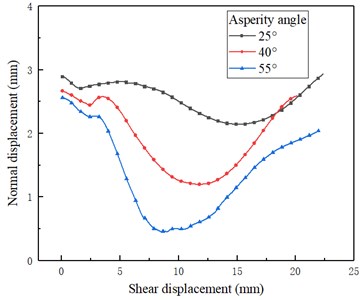
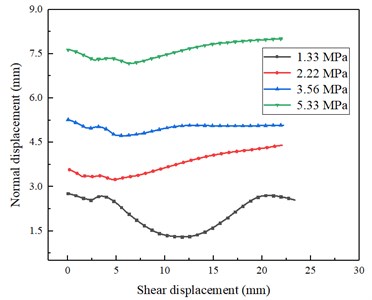
The normal displacement of the specimen changes mainly because the upper part of the specimen sliding along the sawtooth surface and the infilled plaster is squeezed. Under the same normal stress, the specimens with three different asperity angles have a steady decrease with the increase of shear displacement before reaching the peak shear strength. When the peak shear strength is reached, the normal displacement increases abruptly, and the curve shows a small area of the bulge, due to the sudden compression of the specimen. After that, the normal displacement continues to decrease, reaching the minimum when reaching the residual strength. Finally, the normal displacement continues to increase until it is approximately equal to the initial normal displacement, as shown in Fig. 9(a). This stage is mainly because sawtooth was cut after the grinding, the sawtooth of the upper part enter into the next recess of the bottom part, along with the sawtooth surface sliding caused by the increase normal displacement. It can be concluded that the larger the asperity angle is, the larger the normal displacement of dilatancy angle and dilatancy are. The dilatancy curve of the same asperity angle specimen will also be affected by the normal stress. Under the same asperity angle, when the displacement about 5 mm, the specimen reached the peak shear strength. After that, the normal displacement of the specimen increased with the increase of the normal stress.
With the same asperity angle of 40°, the dilatancy curves show similar trends with different normal pressures, as shown in Fig. 9(b). However, greater normal stress results in greater normal displacement. This is because the infilled plaster locates between the upper part and the bottom part of the specimen. When the normal stress is increased, the greater pressure acts on the plaster and the plaster is squeezed more severely, which causes greater normal displacement. Therefore, the infilled plaster contributes more to normal displacement.
Fig. 9Typic dilatancy curves: a) asperity angles under the normal stress of 1.33 MPa, b) asperity angle of 40° under different normal stresses
a)
b)
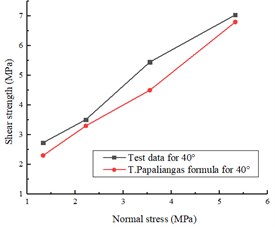
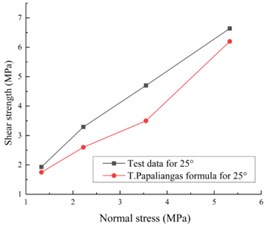
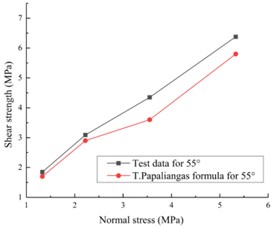
3.5. Verification between the analytical model and test results
In order to forecast the shear strength changed by asperity angles and normal stresses, T. T. Papaliangas et al. [19, 20] and Ladanyi and Archambault [31] proposed analytical models, which is based on the infilled rock joints tests. Shear strength falls between and . is the maximum shear strength of infilled joints, is the potential minimum shear strength with filling thickness. The thickness, filling material, asperity angles, and normal stress would influence the value of and . It is reasonable to assume equal to the shear strength of the fill for rough and undulating joints. However, for planar and undulating joints, the strength along the block and filling interface is considered to be the value of . usually smaller than the shear strength of the filling plaster. In terms of percentages of stress ratios, it was proposed for the prediction of the shear strength of infilled joints, as follows:
where , , and is a function of the filling thickness:
where , is the thickness of filling material, and a is the average roughness of discontinuity. As shown in Table 1, and are constants gained by experiments, but 1.5 and 1 determined by a series of experiments for peak shear strength. Combined with Barton formula shows, , which and are the Cohesion and Friction angle of the infilled plaster. In the formula above, is only affected by the normal stress while is affected by many factors. All specimen prepared for this test have the ratio / 0.5, and the n value can be obtained by numerical model and it equals to 2/3. Based on the comparison, the laboratory test results are in good agreement with the analytical model, as illustrated in Fig. 10.
The results of the experiment are mainly consistent with the trend of the analytical results, and the comparison curve of 55° is highly consistent among the three asperity angles. However, the analytical results are smaller than the test results, which is because the value of c and m in the Papaliangas formula in this experimental model is small. Besides, the mechanical parameters of plaster are different from plaster used in the analytical model. At low asperity angles, the infilled plaster is squeezed into a half horizontal plane during shear. At high asperity angle, the effect of roughness on the peak shear strength will be enhanced and the impact of the infilled plaster on the shear strength will be reduced.
Fig. 10The test results are compared with T. T. Papaliangas formula with different asperity angles: a) the asperity of 25°, b) the asperity of 40°, c) the asperity of 55°
a)
b)
c)
4. Conclusions
In order to evaluate the shear deformation characteristics of the specimen, the dilatancy characteristics and the corresponding failure modes, the shear deformation tests of regular sawtooth surfaces under different asperity angles and different normal stress conditions were carried out. The conclusions are summarized as follow:
1) The shear characteristic of the specimen is related to the asperity angle. The asperity angle is in direct proportion to the peak shear displacement under the same normal stress.
2) The shear characteristic of the specimen is also related to normal stress. The normal stress is in direct proportion to the peak shear strength and the peak shear displacement under the same asperity angle.
3) When the asperity angle stays the same, the reason to the peak shear strength increases first is the failure mode changes from sliding to shear, and the shear force at failure is increasing by increasing angle. However, the reason to decrease afterwards is the force causing sawtooth damage under tensile failure is less than the force under shear failure.
4) When the asperity angle stays the same, the specimen reached the peak shear strength at a shear displacement of about 5 mm, and the normal displacement of the specimen increased with the increasing normal stress. This is because the upper part of the specimen sliding along the sawtooth surface and the infilled plaster is squeezed. The infilled plaster contributes more to normal displacement.
5) The analytical results are below the curve of test results, which is because the small values of c and m in the formula and the mechanical parameters of plaster are different from plaster used in the analytical model.
6) The failure modes of the specimens mainly include three types: sliding failure, shear failure and tensile failure. The sliding failure occurs easily when the asperity angle is 25° and the normal stress is 1.33 MPa or 2.22 MPa, while the tensile failure occurs easily when the asperity angle is 55° and the normal stress of 3.56 MPa or 5.33 MPa. Others are a shear failure. It is concluded that the greater normal stress will result in larger destroy area and the sawtooth is easy to be ruined accordingly.
References
-
Patton F. D. Multiple modes of shear failure in rock. 1st Congress of International Society of Rock Mechanics Lisbon, Vol. 28, Issue 2, 1966, p. 509-513.
-
Hoek E., Brown E. T. Underground excavations in rock. The Institution of Mining and Metallurgy, Vol. 19, Issue 3, 1980, p. 244-246.
-
Grasselli G., Egger P. Constitutive law for the shear strength of rock joints based on three-dimensional surface parameters. International Journal of Rock Mechanics and Mining Sciences, Vol. 40, Issue 1, 2003, p. 25-40.
-
Bandis S., Lumsden A., Barton N. Fundamentals of rock joint deformation. International Journal of Rock Mechanics and Mining Sciences and Geomechanics Abstracts, Vol. 20, Issue 6, 1983, p. 249-268.
-
Suits L. D., SheahanT. C., Seidel J. P., Haberfield C. M. Laboratory testing of concrete–rock joints in constant normal stiffness direct shear. Geotechnical Testing Journal, Vol. 25, Issue 4, 2002, p. 391-404.
-
Huang T. H., Chang C. S., Chao C. Y. Experimental and mathematical modeling for fracture of rock joint with regular asperities. Engineering Fracture Mechanics, Vol. 69, Issue 17, 2002, p. 1977-1996.
-
Barton N. Review of a new shear-strength criterion for rock joints. Engineering Geology, Vol. 7, Issue 4, 1973, p. 287-332.
-
Xia C. C., Tang Z. C., Song Y. L. Analysis of relationship between joint peak shear displacement and its influence factors. Rock and Soil Mechanics, Vol. 32, Issue 6, 2011, p. 1654-1658, (in Chinese).
-
Shen M. R. Experimental study of shear deformation characteristics of rock mass discontinuities. Chinese Journal of Rock Mechanics and Engineering, Vol. 29, Issue 4, 2010, p. 713-719.
-
Jahanian H., Sadaghiani M. H. Experimental study on the shear strength of sandy clay infilled regular rough rock joints. Rock Mechanics and Rock Engineering, Vol. 48, Issue 3, 2015, p. 907-922.
-
Jafari M. K., Hosseini K. A. Evaluation of shear strength of rock joints subjected to cyclic loading. Soil Dynamics and Earthquake Engineering, Vol. 23, Issue 7, 2003, p. 619-630.
-
Barla G., Barla M., Martinotti M. Development of a new direct shear testing apparatus. Rock Mechanics and Rock Engineering, Vol. 43, Issue 1, 2010, p. 117-122.
-
Toledo P., Freitas M., Gcol C. Laboratory testing and parameters controlling the shear strength of filled rock joints. Geotechnique, Vol. 43, Issue 1, 1993, p. 1-19.
-
Hutson R. W., Dowding C. H. Joint asperity degradation during cyclic shear. International Journal of Rock Mechanics and Mining Sciences and Geomechanics Abstracts, Vol. 27, Issue 3, 1990, p. 109-119.
-
Hans J., Boulon M. A new device for investigating the hydromechanical properties of rock joints. International Journal for Numerical and Analytic, Vol. 27, Issue 6, 2003, p. 513-548.
-
Jiang Y., Xiao J., Tanabashi Y., Mizokami T. Development of an automated servo-controlled direct shear apparatus applying a constant normal stiffness condition. International Journal of Rock Mechanics and Mining Sciences, Vol. 41, Issue 2, 2004, p. 275-286.
-
Konietzky H., Fruhwirt T., Luge H. A new large dynamic rock mechanical direct shear box device. Rock Mechanics and Rock Engineering, Vol. 45, Issue 3, 2012, p. 427-432.
-
Welideniya H. S., Indraratna B. A shear strength model for idealised infilled joints under constant normal stiffness. Geotechnique, Vol. 55, Issue 3, 2005, p. 215-226.
-
Papaliangas T., Lumsden A., Hencher S., Manolopoulou S. Shear strength of modelled filled rock joints. Proceedings of the International Symposium on Rock Joints, Loen, Norway, 1990, p. 275-283.
-
Papaliangas T., Hencher S. R., Lumsden A. C., Manolopoulou S. The effect of frictional fill thickness on the shear strength of rock discontinuities. International Journal of Rock Mechanics and Mining Sciences and Geomechanics Abstracts, Vol. 30, Issue 2, 1993, p. 81-91.
-
Yang Z. Y., Chiang D. Y. An experimental study on the progressive shear behavior of rock joints with tooth-shaped asperities. International Journal of Rock Mechanics and Mining Sciences, Vol. 37, Issue 8, 2000, p. 1247-1259.
-
Cao R. H., Cao P., Lin H., Zhang K., Tan X. W. Particle flow analysis of direct shear tests on joints with different roughnesses. Rock and Soil Mechanics, Vol. 34, Issue 2, 2013, p. 456-463, (in Chinese).
-
Bahaaddini M., Hagan P. C., Mitra R. Parametric study of smooth joint parameters on the shear behaviour of rock joints. Rock Mechanics and Rock Engineering, Vol. 48, Issue 3, 2015, p. 923-940.
-
Lin H., Xiong Z. Y., Liu T. Y. Numerical simulations of the effect of bolt inclination on the shear strength of rock joints. International Journal of Rock Mechanics and Mining Sciences, Vol. 66, Issue 1, 2014, p. 49-56.
-
Asadi M., Rasouli V., Barla G. A bonded particle model simulation of shear strength and asperity degradation for rough rock fractures. Rock Mechanics and Rock Engineering, Vol. 45, Issue 5, 2012, p. 649-675.
-
Asadi M., Rasouli V., Barla G. A laboratory shear cell used for simulation of shear strength and asperity degradation of rough rock fractures. Rock Mechanics and Rock Engineering, Vol. 46, Issue 2, 2013, p. 683-699.
-
Chen W., La B. C., Maurel O. Simulation of damage–permeability coupling for mortar under dynamic load. International Journal for Numerical and Analytical Methods in Geomechanics, Vol. 38, Issue 5, 2014, p. 457-474.
-
Forquin P., Chen W. An experimental investigation of the progressive collapse resistance of beam-column RC sub-assemblages. Construction and Building Materials, Vol. 152, Issue 5, 2017, p. 1068-1084.
-
Chen W., Maurel O., Borderie C. L., et al. Experimental and numerical study of shock wave propagation in water generated by pulsed arc electrohydraulic discharges. Heat Mass Transfer, Vol. 50, Issue 5, 2014, p. 1068-1084.
-
Cao R. H., Cao P., Lin H., Ma G. W., Fan X., Xiong X. G. Failure characteristics of jointed rock-like material containing multi-joints under a compressive-shear test: experimental and numerical analyses. Archives of Civil and Mechanical Engineering, Vol. 18, Issue 3, 2018, p. 784-798.
-
Ladanyi B., Archambault G. Shear strength and deformability of filled indented joints. Proceedings of the International Symposium on the Geotechnics of Structurally Complex Formations, 1977, p. 317-326.
Cited by
About this article

The authors would like to acknowledge the financial supports for the research: Projects (51604299, 11772358) supported by the National Natural Science Foundation of China; the State Key Research Development Program of China (2016YFC0600706); Projects funded by China Postdoctoral Science Foundation (2018T110846); China Postdoctoral International Exchange and Introduction Project and the Postdoctoral Science Foundation of Central South University.
