Abstract
In nature, rock mass is subjected to compression-shear effect, so it is very important to study the failure mode and mechanical properties of fractured rock mass under compression-shear effect. In order to study the influence of joint inclination on strength characteristics and failure modes of rock mass under different compression-shear angles, a series of compression-shear tests were carried out. The specimens are made of a certain proportion of fine sand, cement and water. The joints are prefabricated by inserting mica sheets and the inclination angle of joints is 0°, 15°, 30°, 45°, 60°, 75°, 90°. Digital speckle correlation method is used to analyze the strain field of the specimen during the whole loading process. The specimens are speckled on the opposite side before the experiment. In the experiment, the front and back sides of the specimen are monitored by the camera, and the images are analyzed after the experiment. The result shows that: 1) The peak shear strength of specimens mainly increases with the increase of joint inclination angle; 2) The weakening degree of shear strength caused by joint inclination angle of specimens tends to increase as the compression-stress ratio increases; and 3) The failure modes can be classified into four types: coplanar shear failure mode, inclined shear failure mode, quasi-complete shear failure mode and step shear failure mode. The digital speckle strain images better prove the failure modes obtained from the experiment.
Highlights
- The study for mechanical properties of rock-like specimens under compressive-shear stress was developed.
- The rule of strength characteristics of rock-like specimens was investigated.
- The peak shear strength of specimens mainly increases with increasing joint inclination angle.
- The whole strain field of specimens was analyzed and four failure modes was summarized.
1. Introduction
In practical engineering, the failure of rock mass structure is usually accompanied by the crack initiation, propagation and coalescence between joints and fissures, and the overall movement resulting from this will also cause the failure of rock mass structure in engineering. Therefore, it is of great engineering value and theoretical significance to study the influence of joints on rock mass properties [1].
In recent years, many scholars have finished a series of studies on the failure mechanism of joints and fissures, and obtained many achievements on the crack initiation, propagation, and coalescence mechanism and failure modes of rock mass [2-4]. Yang S. Q. et al. [5] conducted the uniaxial compression test on sandstone specimens with one fissure and found nine kinds of crack coalescence types. On this basis, Yang S. Q. [6] carried out the uniaxial test on specimens with two coplanar fissures to find out the relationship between fissure inclination angle and crack coalescence force. In addition, R. H. C. Wong et al [7] used uniaxial compression test on specimens with three parallel fissures and found that crack coalescence only happens between two fissures. Besides, R. H. Cao et al. [8] studied the mechanical characteristics and failure behaviors of the rock mass by carrying out the uniaxial compression test on rock-like specimens with holes and multiple cracks. Four failure modes related to the coalescence of wing cracks and secondary shear cracks were obtained. As the jointed rock mass in engineering is often under the combined action of compression and shear force, many experts and scholars have made detailed research and analysis on the strength characteristics and failure modes of fractured rock mass under direct shear or compression-shear stress [9]. Lajtai [10, 11] carried out direct shear tests on gypsum specimens with two joints on the shear plane, and proposed three failure modes of rock bridges in jointed rock mass: shear failure, tension failure and extrusion failure. Gehle et al. [12] used gypsum material to fabricate rock-like specimen and carried out direct shear tests on specimens with different joint length, joint arrangement and inclination. The shear strength of specimens during loading was studied. It was concluded that normal stress and joint inclination had the greatest influence on joint shear strength. W. C. Fan et al. [13] carried out the compression-shear experiment on rock-like specimen with single joint. By changing the joint inclination angle and compression-shear stress ratio, they analyzed the mechanical properties and failure mode. Zhang K. et al. [14] conducted compression-shear test on specimens with counter-inclined flaw and include three different failure modes. Y. T. Wang et al. [15] use numerical method to simulate the jointed specimen under compression-shear loading and found the crack propagation and failure modes have a great agreement with the results obtained in the experiment. R. H. Cao et al. [16] conducted fixed-angle compression-shear tests on specimens with three prefabricated joints. The experimental factors were joint length and inclination angle of intermediate joint. It was found that with the change of joint inclination angle, the jointed rock mass model presented different crack coalescence modes. From this, three different crack initiation modes at the tip of joints were summarized, and the strength characteristics of jointed specimens were analyzed. In addition, experts also use digital speckle correlation method (DSCM) to test the mechanical properties of rock materials and found crack initiation and propagation which is hard to be seen by naked eyes [17-19]. H. Munoz et al. [20] use DIC to analyze the strain field of rock before and after the peak strength and found that that the strain localisation propagate progressively in the pre-peak regime and it accelerated in the post-peak regime. Zhao C. et al. [21] use DSCM to analyze the strain field of specimen with two parallel fissures under uniaxial loading and found three coalescence modes: a shear coalescence mode, a tensile coalescence mode, and a mixed coalescence mode. T. L. Nguyen et al. [22] combined with high-speed photography and DSCM technology to study the evolution law of the corresponding boundary field of cracked soft rock specimens under uniaxial compression. However, there are only a few studies on strength characteristics and failure modes of rock mass under compression-shear conditions, and they mainly focus on specimens with single crack or multiple cracks. There are no relevant studies on the ubiquitous joint rock mass which are common in nature and practical engineering. So ubiquitous joint rock-like specimens under compression-shear loading are studied in this experiment to find out the mechanical properties and the failure modes.
2. General summary of the experiment
2.1. Specimen preparation
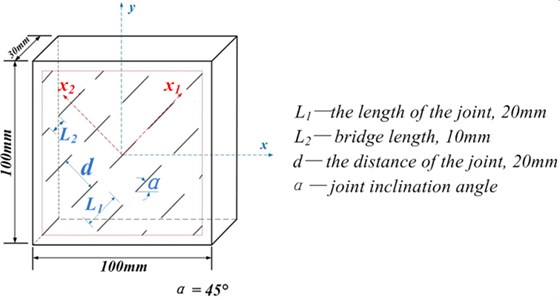
The tested specimens with widespread joints were made of cement mortar. Cement mortar are fabricated of water, cement and fine sand at a volume ratio of 1:1:2. According to the research finished by other scholars [13, 14, 16], the tested specimen is 100 mm in height, 100 mm in width and 30 mm in thickness, the pre-existing fissures were made by inserting the mica plate(0.6 mm in thickness and 15 mm in length) into the cement mortar. The specimen is formed in a steel mould and the specimens were removed from the mold after 24 hours. Then all the specimens were put in a concrete curing box for 28 days before the test. In order to minimize the effect of temperature, all steps are completed at room temperature and the concrete curing box is kept at constant temperature and humidity. The geometric characters and joint distribution of specimens can be seen in Fig. 1. The geometric characters of the fissure is determined by parameters as follows: fissure length (15 mm), ligament length (10 mm), joint spacing (15 mm) and fissure angle ( is 0°, 15°, 30°, 45°, 60°, 75° and 90°). According to a large number of experiments, the result of compression-shear test is not good and the practical significance is not great when the compression-shear angle is greater than 60 degrees. Thus, three different compression-shear angles are adopted in this experiment, which are 30 degrees, 45 degrees and 60 degrees, respectively. Each specimen has its own number: --. means the specimen, indicates the joint inclination angle and indicates the compression-shear angle. The mechanical parameters of intact specimen are shown in Table 1.
Table 1Mechanical parameters of rock materials
Uniaxial compressive strength (MPa) | Tensile strength (MPa) | Elastic modulus (GPa) | Poisson’s ratio | Material density (kg/m3) |
8.104 | 1.153 | 3.242 | 0.2371 | 2159 |
Fig. 1The sketch map of the specimen
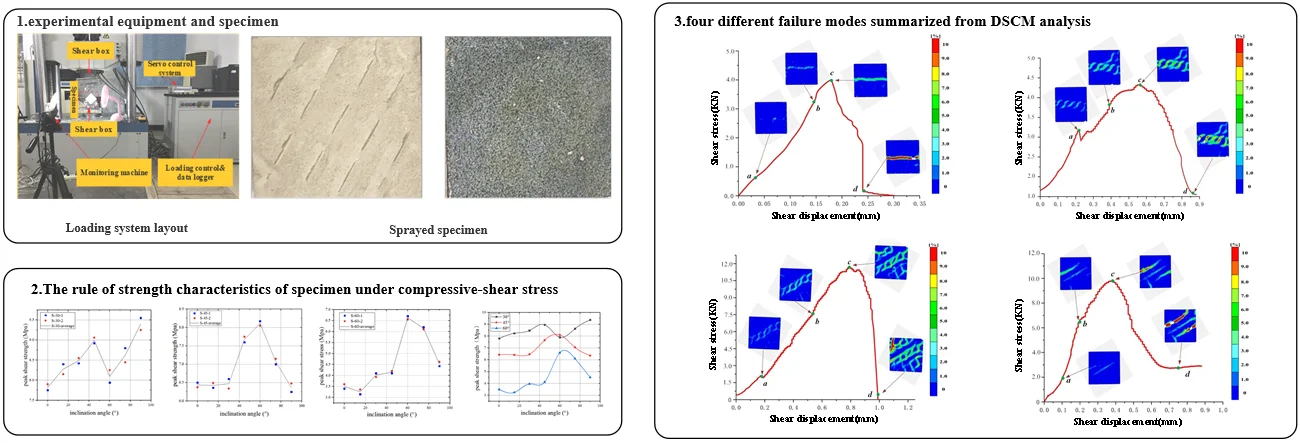
2.2. Experimental equipment and method
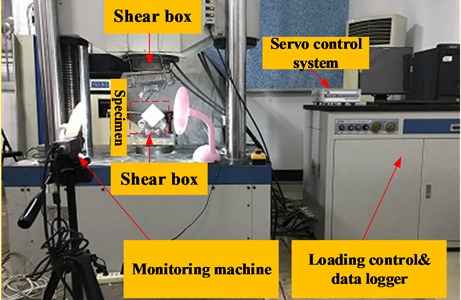
The experiment was carried on New SANS electro-hydraulic servo DCS-2 universal testing machine, which consists of loading frame system, hydraulic servo system, control system and data software processing system, as shown in Fig. 2. The New SANS testing machine can provide two loading modes: force control and displacement control. In this experiment, we adopt displacement control loading mode, and the displacement loading speed is 0.1 mm/min. Fixing the variable angle compression-shear box on the instrument and compression-shear experiments were carried out on specimens with compression-shear angles of 30, 45 and 60 degrees, respectively.
Fig. 2Loading system layout
2.3. DSCM Principle and measurement method
DSCM collects the image area of the object before and after deformation (sample subarea and target subarea) by image acquisition technology and image digitization technology, and extract displacement and strain components by processing two images of an object in different deformation states or time and finding out the correspondence between them.
In order to find a quantitative description of the relationship between the two variables, it is necessary to establish a correlation function to characterize the similarity between image area before and after deformation. The correlation function should satisfy the characteristics of simplicity, reliability, high efficiency and anti-interference. Generally, the form of correlation function can be defined as:
where is the gray level of point (, ) in the sample sub-region, and is the gray level of point is the corresponding point of (, ) in the target subarea. The relationship between the sample sub-region and the target sub-region can be obtained from the following equations:
By solving the minimum or maximum of the above equations (depending on the specific expression of the correlation function), the optimal matching solution of deformation can be achieved. The mathematical model is shown in Fig. 3.
Before the test, the sample should be processed. The first step is to spray a layer of white paint evenly on the back of the specimen (in order to improve the surface viscosity and smoothness of specimens), and then spray a layer of black paint evenly after the white primer is dried. Fig. 4 shows the processed joint specimen. It can be seen from the figure that there are uniform black and white spots on the back of the specimens. During the experiment, the displacement of each spot in the process of damage was collected by CCD camera and evolution rule of specimens can be obtained by post processing after experiment.
Fig. 3The sketch map of model
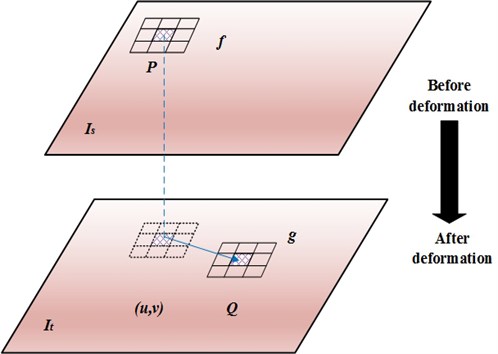
Fig. 4positive and back sides of the sprayed specimen
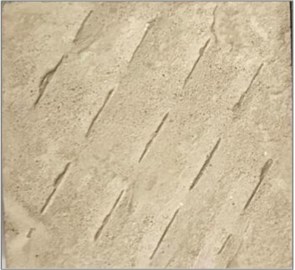
a)
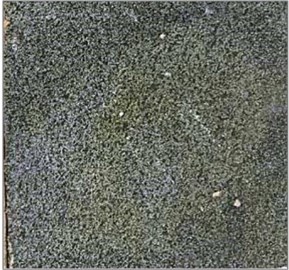
b)
3. Strength characteristics of jointed specimens
3.1. Shear strength characteristics of jointed specimens
In the experiment, the failure loads of specimens with different joint inclination angle under three different compression-shear angles (30°, 45°, 60°) were recorded and obtaining the shearing strength curves by calculating the failure loads, which are shown in Fig. 5, 6 and 7.
Fig. 5Peak shear strength curve of jointed specimens when β= 30°
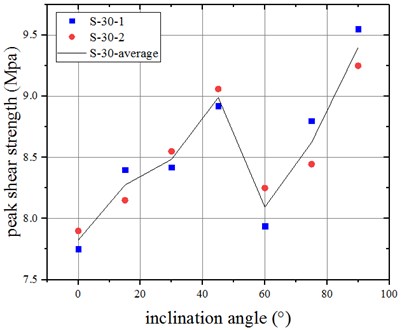
Fig. 6Peak shear strength curve of jointed specimens when β= 45°
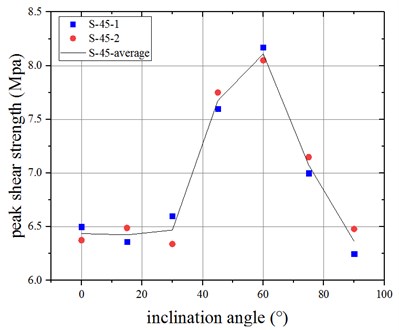
Fig. 5 shows the peak shearing strength curve of jointed specimens at the compression-shear angle of 30 degrees. As seen in Fig. 5, with the increase of joint inclination angle, the shear strength of specimens increases first, then decreases and finally increases. The curve reaches the minimum at the joint angle of 0 degree and reaches the maximum at the joint angle of 90 degrees. The shear strength of jointed specimens increases by 20.15 % as the joint angle () increase from 0° to 90°. The reason why the shear strength of two different specimens with the same joint inclination has some difference is that the anisotropy of rock-like materials.
The peak shearing strength curve of ubiquitous-joint specimens under the loading when compression-shear angle 45° is shown in Fig. 6. Clearly, with the joint angle increases (from 0° to 60°), the peak shear strength increases, and the peak shearing strength declines when the joint angle decreases from 60 degrees to 90 degrees. The shear strength curve has the minimum value at 15 degrees and the maximum value at 60 degrees. The shear strength of specimens with multiple joints increased about 25.91 %. Also, there are some differences among two different specimens with the same joint inclination angle.
As shown in Fig. 7, the peak shearing strength curve firstly increases and reaches its maximum at the joint angle of 60 degrees, and then decreases. Fig. 7 clearly shows that the curve achieves its minimum value when the joint inclination angle is equal to 15 degrees.
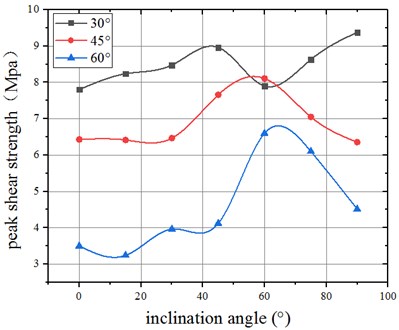
Fig. 8 shows the comparison between the peak shearing curves of multiple-joint specimens under different compression-shear angle (30°, 45°, 60° respectively). As shown in Fig. 8, the peak shearing strength increases as the compression-shear stress ratio increases, except that the shear strength of the specimen with joint inclination of 60° is relatively low when the compression-shear angle is equal to 30 degrees. The reason why the curve shows a dramatic change when equals to 30 degrees is that when the compression-shear angle is 30 degrees, the ratio of compressive stress to the shear stress is equal to 1.732, the compressive stress has a great effect on the strength of specimen, and thus the shear strength is relatively low.
Fig. 7Peak shear strength curve of jointed specimens when β= 60°
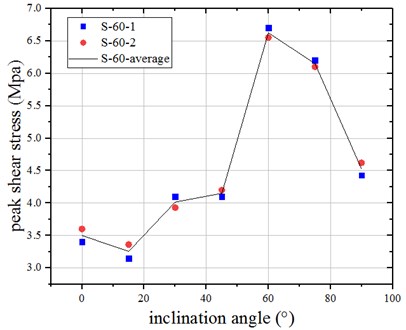
Fig. 8Comparison between peak shearing strength under different compression-shear angles (30, 45, 60 respectively)
3.2. Weakening degree of jointed specimens
According to the research of Fan W. C. et al. [13], the definition of weakening degree is that the ratio of shear strength of universally jointed specimens with different joint angles under compression-shear condition to that of intact specimens. Defining is the shear strength of intact specimens, is the shear strength of jointed specimens, and is the sign of weakening degree. According to the definition of weakening degree above, the calculation formula can be obtained as follows:
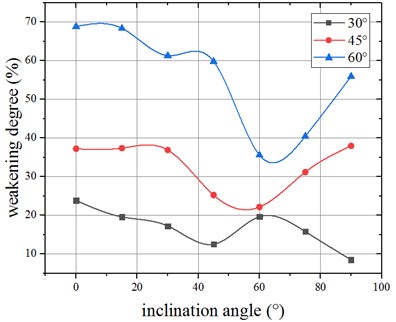
Fig. 9 clearly shows the curve of weakening degree of specimens under different compression-shear angle. From Fig. 9, it can be seen that, in general, with the increase of compression-shear angle, the effect of joint inclination angle to weakening degree tends to increase, because the ratio of compression-shear stress increases gradually, while the shear strength of the specimen is lower than its compression strength. When 30°, the shear strength of the specimens with joint inclination angle of 60 degrees is the lowest. According to Eq. (3), the weakening degree is equal to 19.65 %, and the shear strength reaches the maximum when the joint inclination angle is equal to 90°, and the corresponding weakening degree is the smallest, which is 8.48 %; when is equal to 45 degrees, the shearing strength of specimen whose joint inclination angle is 15 degrees is minimum, and the relevant weakening degree is the highest, which is 37.38 %; jointed specimen reaches the maximal shear strength at the joint angle of 60 degrees, and the corresponding weakening degree is 22.15 %. Under the condition that the compression-shear angle is equivalent to 60°, the curve reaches the peak and the bottom at the angle of 60° and 15°, and the correlative weakening degree is 35.58 % and 68.37 %, respectively.
Fig. 9Weakening degree of shear strength of multiple-joint specimens
4. Analysis of failure modes
In the experiment, the upper part of the shear box moves at a speed of 0.1 mm/min and the lower part is fixed on the loading platform. The specimen sustains both normal and shear stresses simultaneously, and when the compression-shear angle is different, the ratio of normal stress to shear stress is different. When the compression-shear angle is 30 degrees, the ratio of compressive stress to shear stress is 1.732; when the compression-shear angle equals to 45 degrees, the ratio of compressive stress to shear stress is 1; when the compression-shear angle equals to 45 degrees, the ratio of compressive stress to shear stress is 0.577. Under different compression-shear stress ratio, specimen are destroyed in different failure modes.
In order to describe the failure mode and crack propagation more clearly, the failure diagram was drawn. In the following figure in this chapter, stands for tensile wing cracks, represents secondary shear cracks, means surface pullout, implies mixed cracks, and (1), (2) and (3) stands for the number of fissures which dominated the failure of specimens.
4.1. Failure modes of specimen with joint angle of 0° and 90°
Crack propagation and failure mode of specimen whose joint inclination angle is 0 degrees and 90 degrees is presented in Table 2. As clearly shown in Table 2, specimen S-0-30 is destroyed by a shear failure which is coplanar to joint (1), (2) and (3). Under compression-shear loading, the secondary crack first initiates at the tip of pre-existing joints and the inner side of specimens, and then the cracks propagate to the pre-existing fissures. In the end, a macroscopic shear failure surface is formed in the center of the specimens. Along the macroscopic failure surface, the specimen destroyed by a plane shear crack and there are surface peeling happens around the shear cracks, which attributes to the propagation of cracks.
For specimen S-90-60, its failure mode is clearly shown that the secondary shear cracks were first generated at the upper tips and the lower tips of the pre-existing fissures (2), (3) and (4). As the pressure increases, the cracks at the upper tips propagate to the left side and the shear cracks at the lower tips spread along the right side and finally the shear cracks overlap with the prefabricated fissure to form two parallel shear failure surfaces. Besides, there are two secondary cracks appears at the middle of the pre-existing fissures (1) and (5), and then propagate to the left and right side of the specimen respectively.
Table 2Crack coalescence and failure mode of S-0-30 and S-90-60
Specimen | Failure process and schematic diagram |
S-0-30 | 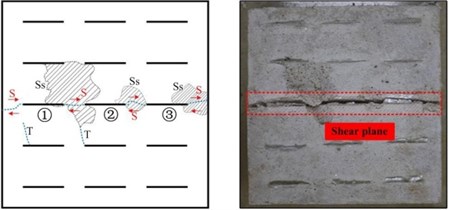 |
S-90-60 | 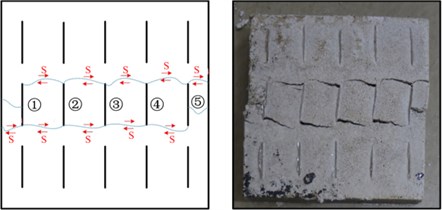 |
4.2. Failure modes of specimen with the compression-shear angle of 30°
When the compression-shear angle is equal to 30 degrees, the compression-shear stress ratio is 1.732. The effect of compression is greater than that of shear stress, and the failure mode of specimens is complex. The failure process of joint specimens S-45-30 and S-60-30 are shown in Table 3.
For S-45-30. The wing cracks first propagate from the lower part of the specimen, but no penetration occurs. As the compression-shear stress increases, the secondary coplanar shear cracks begin to appear at the tip of prefabricated fissures and then propagate to each other. Especially the secondary inclined shear cracks which overlap between prefabricated joints (1) and (2), prefabricated joints (2) and (4), prefabricated joints (4) and (5) constitute the basic shear failure path. In addition, wing cracks are initiated and propagated near the tip of prefabricated joints. There are also many mixed mode cracks happens around the prefabricated joints ((1), (2) and (4)). The cracks mentioned above expand and penetrate each other under the action of compression-shear stress, and ultimately lead to the generation of shear failure surface, accompanied by a wide range of surface scaling.
The failure mode diagram of the joint specimens S-60-30 is clearly shown in Table 2. Secondary shear inclined cracks and mixed mode cracks first initiate in the middle and tips of prefabricated fissures and then propagate to the two tips of prefabricated fissure (2) respectively. With the continuation of compression-shear stress, secondary inclined shear cracks appear at both tips of prefabricated joints and continue to spread. In addition, wing cracks and secondary shear cracks occur at the tip or middle of other pre-existing fissures, and overlap with other pre-existing fissures. These crack coalescence all reduce the strength of specimens, but do not dominate the macro-shear failure of joint specimens. Macroscopic shear failure surfaces are composed of pre-existing fissures ((1), (2), (3)) and shear cracks which initiate and propagate through them.
4.3. Failure modes of specimen with the compression-shear angle of 45°
Table 4. clearly shows the crack propagation and coalescence of specimen S-30-45 and S-60-45. For S-30-45, the wing cracks first initiate at the tips of pre-existing fissure and then quickly propagate and penetrate to the upper end of the specimen. But the propagation and coalescence of wing cracks is not the main reason of failure of specimen.
Table 3Crack coalescence and failure mode of S-45-30 and S-60-30
Specimen | Failure process and schematic diagram |
S-45-30 | 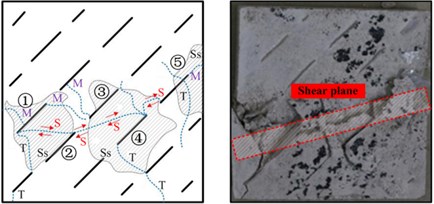 |
S-60-30 | 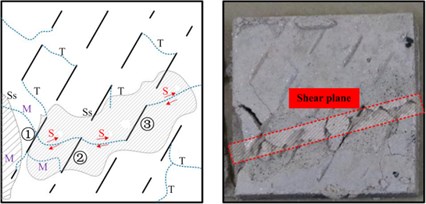 |
Table 4Crack coalescence and failure mode of S-30-45 and S-60-45
Specimen | Failure process and schematic diagram |
S-30-45 | 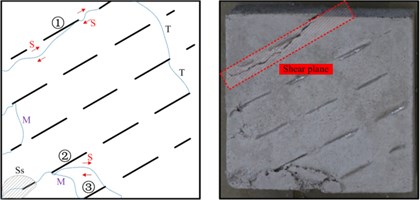 |
S-60-45 | 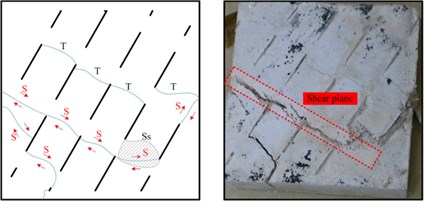 |
As the compression-shear stress increases, there are some Secondary inclined shear cracks and mixed mode cracks generate at the tips of the fissures ((1), (2) and (3)).These cracks continue to propagate and eventually penetrate into the end of the specimen, directly cutting the upper right part of the specimen into a new block, leading to the overall failure of the specimen.
For specimen S-60-45, it can be seen that the wing cracks and secondary inclined shear cracks occur near two parallel joints of the specimen, respectively. With the increase of compression-shear stress, the shear stress gradually strengthens and occupies a dominant position. Secondary inclined shear cracks appear at the tips of pre-existing fissures near the shear plane and then quickly propagate along the direction of the shear failure path. Secondary inclined shear cracks continuously overlap with the tips of adjacent pre-existing fissures, thus forming an inclined macro shear failure surface. Besides, there are some wing crack coalescence occur at the tip of other prefabricated fissures, but do not cause macro-damage of the specimen. A small area of surface peeling can also be seen.
4.4. Failure modes of specimen with the compression-shear angle of 60°
Table 5 clearly shows the crack propagation and coalescence of specimen S-15-60 and S-30-60. For S-15-60, mixed mode cracks and secondary coplanar shear cracks first initiate at the tips of the prefabricated fissures and then quickly propagate to the nearby prefabricated fissures. Secondary coplanar shear cracks and secondary inclined shear cracks are successively initiated at the tips of prefabricated fissures ((2) and (3)). As the compression-shear stress increases, all the cracks mentioned above continue to propagate and then form crack coalescence with other prefabricated cracks or penetrate to the edge of the specimen. which result in the failure of the specimen. It can be seen from table 5 that there is surface peeling happens on the specimen, but it is not as intense as the specimen with the compression-shear angle of 30°. The main reason is that the shear stress is stronger when the compression-shear angle is equal to 60°, which leads to more obvious shear failure of the specimen.
As for S-30-60, secondary inclined shear cracks first initiate at the tips of the prefabricated fissures ((1), (2) and (3)). Then these cracks propagate quickly to the nearby fissures, and thus forming a macroscopic failure surface. The failure mode of the specimen S-30-60 is really characteristic, showing a “crystalline nucleus” failure. In this study, with the increase of compression-shear stress, cracks spread to pre-existing fissures and finally crack coalescence happen between secondary cracks and between secondary cracks and prefabricated joints, which forms a folded shear failure surface, thus forming two “crystalline nucleus”.
Table 5Crack coalescence and failure mode of S-15-60 and S-30-60
Specimen | Failure process and schematic diagram |
S-15-60 | 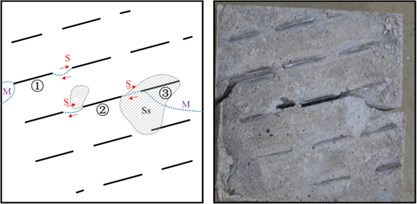 |
S-30-60 | 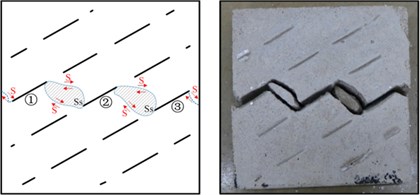 |
5. DSCM study on strain field of specimens
Based on the analysis of strength characteristics and mechanical behavior of joint specimens under different compression-shear angles, the failure modes of specimens are summarized. The failure modes include coplanar shear failure mode, inclined shear failure mode, quasi-complete shear failure mode and stage shear failure mode.
5.1. DSCM analysis of coplanar shear failure
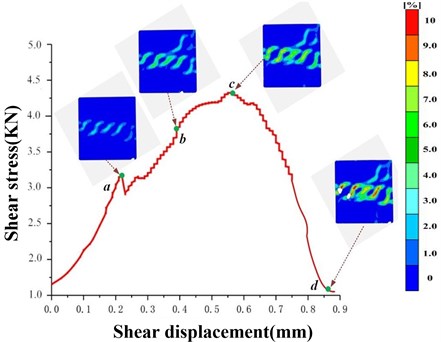
The coplanar shear failure mode mainly occurs in the joint specimens with joint angle of 0°. Under this failure mode, wing cracks first appear at the tips of pre-existing fissures, and wing cracks do not continue to spread but tend to compact slowly. The secondary coplanar shear cracks then begin to initiate at the tips of prefabricated fissures in the middle of the specimens and propagate along the bridge direction in joint specimens. Finally, it is completely destroyed along the horizontal direction.
As shown in Fig. 10, the mode of coplanar shear failure of joint specimens under compression-shear loading is presented and , , and represent the four positions of micro-crack compaction limit, elastic limit, peak strength and residual strength on the full stress-strain curve, respectively. It can be clearly observed from Fig. 10 that with the increase of compression-shear effect, the large strain region appears in the middle of the joint specimen, which represents the initiation of cracks at the tip of joint. When the elastic stage is over, the cracks propagate and penetrate along the prefabricated fissure in the middle of the specimen, and a light-colored strain region appears in the middle of the specimen. When the peak strength is reached, the centralized strain zone in the middle of the specimen is very obvious and the centralized high strain zone (red zone) is continuously spreading, indicating that the specimen has produced coplanar shear failure.
Fig. 10Evolution of coplanar shear failure mode
5.2. DSCM Analysis of quasi-complete shear failure
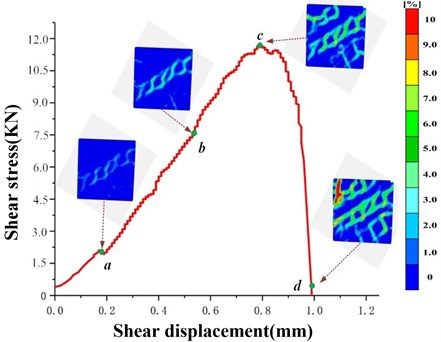
The quasi-complete shear failure mode mainly occurs in the joint specimens with joint inclination angle of 90 degrees. In this mode, a large number of secondary shear cracks occur at the tips of prefabricated cracks. Secondary shear cracks initiate at the tip of the pre-existing fissures near the ends of the specimen and propagate along the shear stress direction. An important feature of this failure mode is that it is similar to the failure of intact specimen under the compression-shear stress and produces shear failure surfaces at the central position of jointed specimens.
Fig. 11 clearly shows the quasi-complete shear failure mode of jointed specimens under compression-shear loading and , , and represent the four positions of micro-crack compaction limit, elastic limit, peak strength and residual strength on the full stress-strain curve, respectively. In Fig. 11, as the compression-shear stress increases, large strain zones first appear between two rows of parallel fissures in the middle of specimens, representing the initiation of cracks at the tip of parallel joints. After the elastic stage, the strain region between parallel fissures in the middle of the specimen is larger than that before, which indicates that the cracks at the tip of prefabricated joints are spreading and penetrating. When the curve reaches point , the strain concentration zone of the specimen continues to spread and large strains also appear in the upper part of the specimen, which indicates that shear crack propagation and coalescence occur in other locations. The red area eventually appears, which indicates that the specimen has been subjected to quasi-complete shear failure.
Fig. 11Evolution of quasi-complete shear failure mode
5.3. DSCM Analysis of inclined shear failure mode
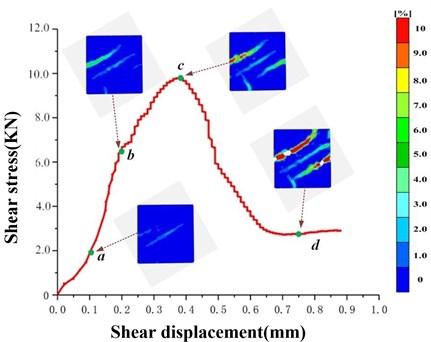
In the inclined shear failure mode, the shear failure surface is generally inclined, or represents a folded line shape. The formation of inclined shear failure surface is mainly due to the propagation and coalescence between prefabricated fissures and secondary inclined shear cracks. It is noteworthy that wing cracks and mixed mode cracks also play a certain role in the shear failure of specimens, but wing cracks do not play a dominant role.
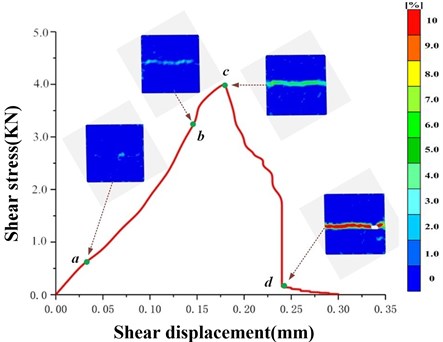
As shown in Fig. 12, a large strain zone first appears in the middle and lower parts of the jointed specimens. The digital speckle image at point a represents the initiation and propagation of wing cracks and secondary shear cracks at the tip of pre-existing fissures. When point is reached, the strain zone in the specimen has been enlarged more obviously than before, which indicates that the cracks at the tip of pre-existing fissures are continuously propagating and penetrating, and the shear strength continues to increase. When the curve reaches point , the centralized strain region of the joint specimen continues to spread, the centralized strain position is consistent with the crack coalescence pattern and the failure mode observed in the experiment. In addition, large strains in other parts of the specimen also appear, which indicates that the shear crack coalescence also occur in other parts of the specimen. At point , there are inclined shear macro-failure surfaces appear in the jointed specimens. Correspondingly, in the digital speckle strain image, the red region finally appears, which represents the specimens are destroyed.
Fig. 12Evolution of inclined shear failure mode
5.4. DSCM Analysis of stage shear failure mode
In the stage shear failure mode, several stage shear failure surfaces appear in the jointed specimens. Prefabricated fissures overlap with secondary shear cracks or composite cracks which initiate at their tips to form failure surfaces, and there is no dominant shear failure surface in the specimens.
In Fig. 13 points , , , represent four positions in the total stress-strain curve: micro-crack compaction limit, elastic limit, peak strength and residual strength, respectively. From point a to point , the strain increases and the corresponding shear strength increases, and the centralized strain zone is well consistent with the crack propagation and coalescence observed in experiments. Unlike previous failure modes, which generally have only one shear failure plane, stage shear failure mode has multiple shear failure planes, which can be clearly seen from strain speckle imagine in point .
Fig. 13Evolution of stage shear failure mode
6. Conclusions
In this paper, the influence of joint inclination and compression-shear stress ratio on the strength characteristics and failure modes of joint specimens is explored. DCSM is used to analyze the strain field of specimens during the whole loading process. The results are compared with the experimental results and the following conclusions are obtained.
1) The shear strength of specimens is sensitive to the change of joint inclination angle. It can be seen that the peak shear strength of specimens increases with the increase of joint inclination angle, except that the shear strength of specimens with joint inclination angle of 60 degrees is relatively low at compression-shear angle of 30 degrees.
2) With the increase of compression-shear angle, the weakening of shear strength by joint inclination angle of specimens tends to increase, because the ratio of compression-shear stress increases gradually, while the shear strength of specimens is lower than its compressive strength.
3) The compression-shear failure modes of specimens can be classified into four types: coplanar shear failure mode, inclined shear failure mode, quasi-complete shear failure mode and step shear failure mode. The digital speckle strain imagine is in good agreement with the experimental failure mode obtained from the experiment.
References
-
Meng J., Cao P., Lin H., et al. Second-order cone programming formulation of discontinuous deformation analysis. International Journal for Numerical Methods in Engineering, 2018, https://doi.org/10.1002/nme.6006.
-
Cao Ri-Hong, Cao Ping, Lin Hang, et al. Mechanical behavior of brittle rock-like specimens with pre-existing fissures under uniaxial loading: experimental studies and particle mechanics approach. Rock Mechanics and Rock Engineering, Vol. 49, Issue 3, 2016, p. 763-783.
-
Cao Ri-Hong, Cao Ping, Fan Xiang, et al. An experimental and numerical study on mechanical behavior of ubiquitous-joint brittle rock-like specimens under uniaxial compression. Rock Mechanics and Rock Engineering, Vol. 49, Issue 11, 2016, p. 4319-4338.
-
Lin Qibin, Cao Ping, Cao Ri-Hong Experimental investigation of jointed rock breaking under a disc cutter with different confining stresses. Comptes Rendus Mecanique, Vol. 346, Issue 9, 2018, p. 833-843.
-
Yang S. Q., Jingh W. Strength failure and crack coalescence behavior of brittle sandstone samples containing a single fissure under uniaxial compression. International Journal of Fracture, Vol. 168, Issue 2, 2011, p. 227-250.
-
Yang S. Q. Crack coalescence behavior of brittle sandstone samples containing two coplanar fissures in the process of deformation failure. Engineering Fracture Mechanics, Vol. 78, Issue 17, 2011, p. 3059-3081.
-
Wong R. H. C., Chau K. T., Tang C. A., et al. Analysis of crack coalescence in rock-like materials containing three flaws – part I: experimental approach. International Journal of Rock Mechanics and Mining Sciences, Vol. 38, Issue 7, 2001, p. 909-924.
-
Cao R. H., Cao P., Lin et al. H. Mechanical behavior of an opening in a jointed rock-like specimen under uniaxial loading: Experimental studies and particle mechanics approach. Archives of Civil and Mechanical Engineering, Vol. 18, Issue 1, 2018, p. 198-214.
-
Majidi H. R., Ayatollahi M. R., Torabi A. R., et al. Energy-based assessment of brittle fracture in VO-notched polymer specimens under combined compression-shear loading conditions. International Journal of Damage Mechanics, 2018, https://doi.org/10.1177/1056789518780424.
-
Lajtai E. Z. Shear strength of weakness planes in rock. International Journal of Rock Mechanics and Mining Science, Vol. 6, Issue 7, 1969, p. 499-515.
-
Lajtai E. Z. Strength of discontinuous rocks in direct shear. Geotechnique, Vol. 19, Issue 2, 1969, p. 218-233.
-
Gehle C., Kutter H. K. Breakage and shear behavior of intermittent rock joints. International Journal of Rock Mechanics and Mining Sciences, Vol. 40, Issue 5, 2003, p. 687-700.
-
Fan W. C., Cao P., Zhang K. Experiment study on failure style of jointed rock-like material under different compressive-shear stress ratios. Journal of Central South University (Science and Technology), Vol. 46, Issue 3, 2015, p. 926-932.
-
Zhang K., Chen Y. L., Cheng H. M., et al. Investigation on compression-shear fracture and fragmentation characteristics of rock mass containing counter-inclined flaw. Chinese Journal of Rock Mechanics and Engineering, Vol. 37, Issue 1, 2018, p. 3291-3299.
-
Wang Y. T., Zhou X. P., Kou M. M. Three-dimensional numerical study on the failure characteristics of intermittent fissures under compressive-shear loads. Acta Geotechnica, 2018, https://doi.org/10.1007/s11440-018-0709-7.
-
Cao R. H., Cao P., Lin H., et al. Failure characteristics of jointed rock-like material containing multi-joints under a compressive-shear test: experimental and numerical analyses. Archives of Civil and Mechanical Engineering, Vol. 18, Issue 3, 2018, p. 784-798.
-
Modiriasari A., Bobet A., Pyrak Nolte L.-J. Active seismic monitoring of crack initiation, propagation, and coalescence in rock. Rock Mechanics and Rock Engineering, Vol. 50, Issue 9, 2007, p. 2311-2325.
-
Shantanu Patel, Derek Martin C. Evaluation of tensile young’s modulus and Poisson’s ratio of a bi-modular rock from the displacement measurements in a Brazilian test. Rock Mechanics and Rock Engineering, Vol. 51, Issue 2, 2018, p. 361-373.
-
Wang L. L., Bornert M., Heripre E., et al. The mechanisms of deformation and damage of mudstones: a micro-scale study combining ESEM and DIC. Rock Mechanics and Rock Engineering, Vol. 48, Issue 5, 2015, p. 1913-1926.
-
Munoz H., Taheri A., Chanda E. K. Pre-peak and post-peak rock strain characteristics during uniaxial compression by 3D digital image correlation. Rock Mechanics and Rock Engineering, Vol. 49, Issue 7, 2016, p. 3377-3393.
-
Cheng Z., Meng Z. Y., Feng Z. C., et al. Cracking processes and coalescence modes in rock-like specimens with two parallel pre-existing cracks. Rock Mechanics and Rock Engineering, Vol. 51, Issue 11, 2018, p. 3377-3393.
-
Nguyen T. L., Hall S. A., Vacher et al. P. Fracture mechanisms in soft rock: identification and quantification of evolving displacement discontinuities by extended digital image correlation. Tectonophysics, Vol. 503, Issues 1-2, 2011, p. 117-128.
Cited by
About this article

This work gets its support from the National Natural Science Foundation of China (No. 11772358) and the Fundamental Research Funds for the Central South Universities, China (No. 2018zzts072).
