Abstract
The existence of toe debris at the bottom of the bored pile will reduce the bearing capacity of the pile. This paper develops a novel equipment to measure the thickness of toe debris for bored piles. The equipment consists of a test rod, test hammer, velocimeter, transmission cable and data receiving and processing device. Based on the one-dimensional wave theory, the mechanism of the sudden change of the velocity time curve received at the top of the test rod is analyzed, which is caused by the change of the wave impedance at the interface between the test rod and the sediment, thus the feasibility of the equipment is verified in theory. Finally, numerical simulations of toe debris under various working conditions are carried out to verify the reliability of the equipment. The results show that the test curves are sensitive to the materials of test rod using proposed equipment when the thickness of toe debris is equal or greater than 50 cm, and the test values are all larger than actual values, which meet the requirement of relevant specifications. The test results are more accuracy when the thickness of toe debris is less than 50 cm. when the excited force is large, not only the sudden change is easy to be discriminated, but also the test accuracy can be assured. The remainder toe debris meet the requirement of relevant specifications after clearing pile hole according the proposed method. And the device is not affected by the properties of the sediment material, which indicates that the proposed equipment can perform well to test the thickness of toe debris.
Highlights
- This paper develops a novel equipment to measure the thickness of toe debris for bored piles.
- The validity of the equipment is verified by theoretical solution and numerical simulation.
- The numerical simulation of the equipment under various working conditions shows the effectiveness of the device.
1. Introduction
Bored piles, especially large-diameter piles are commonly employed to support high-rise building and bridge in China and internationally because of their ability to sustain large load. However, due to improper design and/or improper process, the presence of defects, such as voids, honeycombing, cracks, necking, soil/slurry inclusions, and so on, is inevitable [1-3]. Table 1 shows the sampling test of defective bored piles.
Table 1Sampling test results of bored piles
Number of test piles | Number of defective piles | Probability of defective piles | Reference |
717 | 70 | 9.70 % | Davis [4] |
2986 | 600 | 20.10 % | O’Neill [5] |
5000 | 75 | 1.50 % | Fleming [6] |
4550 | 86 | 1.90 % | Fleming [6] |
4400 | 185 | 4.20 % | Ellway [7] |
8,689 | 287 | 3.30 % | Thasnanipan [8] |
380 | 27 | 7.00 % | Lew [9] |
5,000 | 78 | 1.56 % | Lew [9] |
41 | 5 | 12 % | Gan [10] |
– | – | 7.50 % | Preiss [11] |
The attendance of defects can lead to unsatisfactory performance of pile foundations, or delays in construction [12-15]. Laboratory experiment, numerical simulation and static load tests are employed by Sarhan [12] and O’Neill [14] to systematically study the size of defects(eg., holes, reinforcement corrosion) effecting on pile capacity, the results show that the pile capacity approximately decreases 10 % when the ratio of area of defects to the cross-sectional area of piles is 15 %. What is worse, the defects may not be detected through cross-hole sonic logging when the size of defects is relatively small, for example, smaller than 5 % cross-sectional area [16]. Thus, quality assurance measures such as integrity inspections or static loading inspections can play an important role to ensure the construction workmanship and quality after construction. This paper will focus the integrity inspection of bored piles.
Xu [17] proposes new measurement approach for deflection monitoring of large-scale bored piles using distributed fiber sensing technology, and its application is carried out using 6 bored piles in Hong Kong. Chun [18] presents a new method for evaluating the slime thickness using temperature compensated electrical resistivity, and laboratory experiment is employed to verify the proposed method. However, the proposed equipment is too complex to limit its application. Xiao [19] puts forward a new deficiency detection method for bored piles, which uses only one optical fiber cable both measurement and transmission. Ni [20] employs complex continuous wavelet transform to determine pile length and locations of defects on pile foundations by analyzing the time-frequency-phase angle diagram in different frequency band. However, the above researches have no contribution to the test of toe debris. Xu [21] presents an elevated raft technique for drilled bored piles, where loose sediments and excavation debris at the pile tip can be compressed by the applied load from the superstructure.
Toe debris is the common defection of bored piles. When the thickness of toe debris piles is large, the safety of pile foundation will be threatened [22, 23]. Therefore, it is necessary to develop a reliable and effective equipment to test the thickness of toe debris. This paper develops a novel equipment to measure the thickness of toe debris of bored piles. The equipment consists of a test rod, test hammer, velocimeter, transmission cable and data receiving and processing device. Based on the one-dimensional wave theory, the mechanism of the sudden change of the velocity time curve received at the top of the test rod is analyzed, which is caused by the change of the wave impedance at the interface between the test rod and the sediment, thus the feasibility of the equipment is verified in theory.
2. Design and operation of equipment
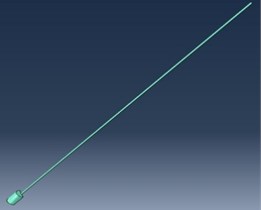
Based on low strain reflection wave technique, this paper proposes a novel equipment to measure the thickness of bored piles, which is shown as Fig. 1.
Fig. 1The diagrammatic sketch of test equipment for toe debris
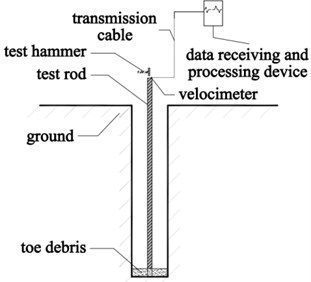
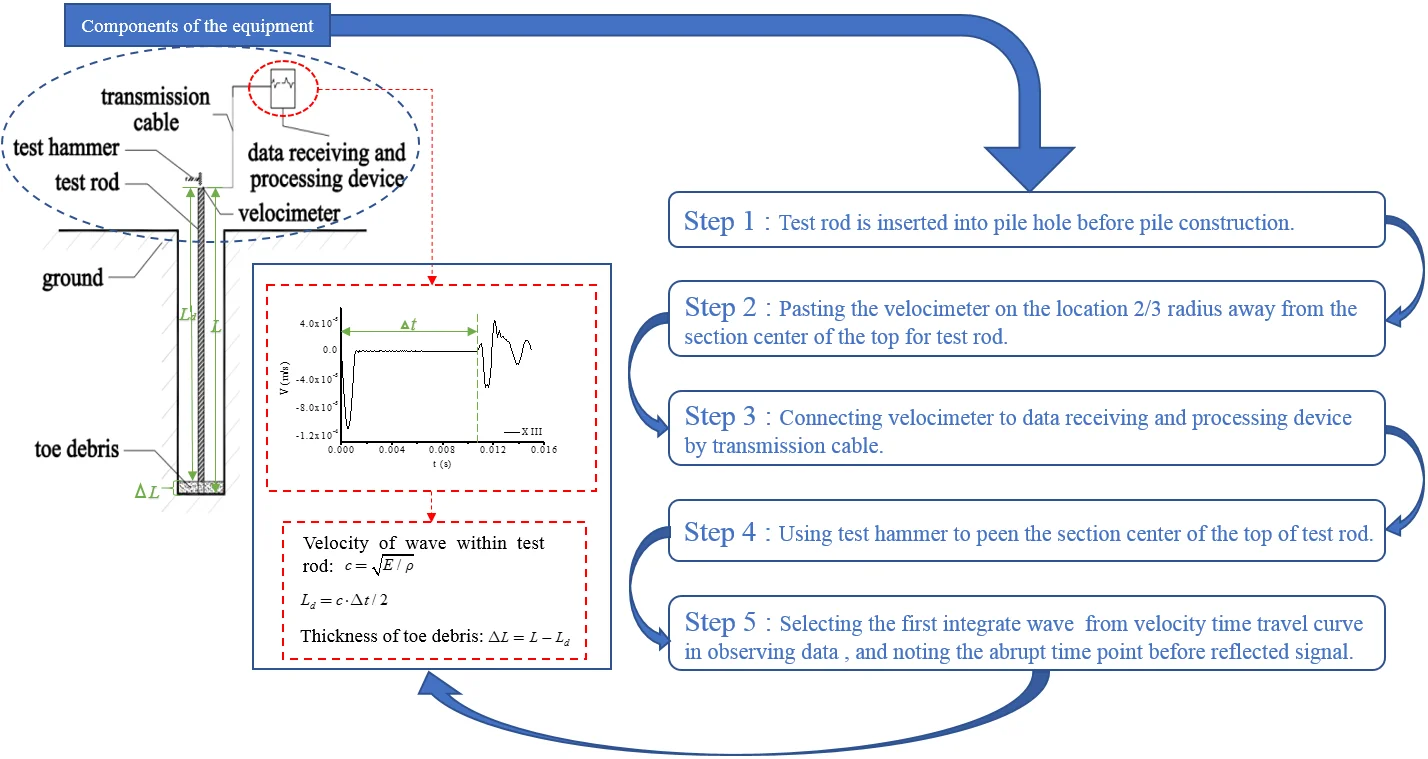
This equipment consists of test hammer, test rod, transmission cable and data receiving and processing device. The test rod is installed in toe debris which can meet the design depth of pile hole. The velocimeter is at the top of test rod, which connected to data receiving and processing device using transmission cable.
The operational approach of this equipment is:
(1) Test rod is inserted into pile hole before pile construction, and its depth should meet the requirement of design.
(2) The velocimeter is pasted on the location 2/3 radius away from the section center of the top of test rod, and it is connected by transmission cable to data receiving and processing device.
(3) Using test hammer to peen the section center of the top of test rod. A transient excitation force produces on the top of rod, thus the elastic wave develops within the test rod, elastic wave drives particle motion in rod, then observing the data receiving and processing device.
(4) The first integrate wave is selected from observing data to note the abrupt time point before reflected signal, then the thickness of toe debris can be computed using following equations:
where is the velocity of wave within test rod; is the elasticity modulus of test rod; is the density of test rod; is the interval distance between the top of test rod and the interface between toe debris and test rod; is the time of wave mutation subtracting the time of peening; is the thickness of toe debris; is the length of test rod.
3. Theoretical basis for equipment
This equipment employs low strain reflection wave measurement technique. This technique puts low-energy transient excitation force on the top of test rod, then the test rod can low amplitude vibrate within elastic range. Based on vibration and wave theory, the thickness of toe debris can be obtained through capturing the distance between the bottom of the toe debris and the top of test rod.
Low-strain reflected wave employs elastic wave (or stress wave) which disseminates along one-dimensional rod. For test rod, its length is farther larger than its diameter, which can be considered as one-dimensional rod. It will produce the elastic wave (or stress wave) when a transient excitation force is loaded on the top of test rod. A lot of wave energy will transmit along pile shaft because of the momentary contact and different wave impedance between test rod and toe debris. The change of wave impedance on rod-soil interface can cause the velocity time travel curve of the top of rod to develop outstanding surge mutation. Therefore, the elastic wave along pile shaft can be computed using one-dimensional wave equation [24].
3.1. Basic assumptions
To verify the presented equipment, the following assumptions is used:
(1) The test rod and toe debris vibrate within elastic range;
(2) The materials of test rod and toe debris are isotropic homogeneous;
(3) The toe debris of bored piles symmetrical distributions;
(4) Plane section assumption.
3.2. Establishment of the equation
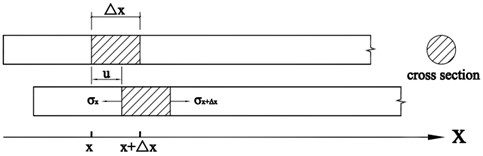
Fig. 2 shows the diagrammatic sketch of rod unit displacement and cross section. As shown in Fig. 2, a differential segment is obtained along the length direction of test rod. The length, area of section, density are , and , respectively. Assuming that the displacement of differential segment is , and the elasticity modulus of test rod is . Based on the Newton second law, the following equation can be obtained:
where is the velocity of movement of the point in test rod; is the accelerated speed of the point in test rod; and are the positive stress of the two end sections.
Fig. 2The diagrammatic sketch of rod unit displacement and cross section
Eq. (4) divided by is the following equation:
when , limiting Eq. (5) is:
The strain of differential segment is , and based on the Hooke’s law, the stress can be written as: . Bringing Eq. (6) in it, the following equation can be get:
Eq. (7) divided is the following equation:
The longitudinal wave velocity of test rod is , bringing in Eq. (8) is:
Eq. (9) is the wave equation based on one-dimensional wave theory, which is the basis of measuring the thickness of toe debris using low strain reflected wave method.
3.3. Solving the equation
Based on theory of travelling wave, D’Alembert solution of one-dimensional wave equation can be described as the overlying of two reversed travelling wave, of which general solution are written as:
where is the forward propagation down-travelling wave along -axis; is the negative propagation up-travelling wave along -axis.
If , the following equations can be obtained based on vibration theory and separation of variables:
where is the angular frequency of longitudinal vibration for rod; and are the constants computed by boundary conditions; and are the constants computed by initial conditions.
The constraints condition of test rod are one end free and another end fixation according to the test condition, which can be shown as and , thus the following equations can be obtained:
Solving the Eq. (14) are:
Angular frequency: , ;
Circular frequency: , ;
Displacement: , .
3.4. Reflection and transmission of wave
The low-strain reflection wave method is based on the one-dimensional wave theory, and the test rod is assumed to be a continuous and uniform elastic rod. The dynamic response of the longitudinal fluctuation of the elastic rod under the excitation force is studied.
Under excited force, the top of rod can generate a downwardly propagating stress wave in nature state. At the interface of the wave impedance difference (at the interface between the test rod and the sediment), part of the stress wave will reflect and propagate upward. Part of the stress wave will continue to pass down to the rod end, and a reflection will propagate upward at the rod end.
The velocimeter installed on the top of rod receives initial incident signal and all the reflected signals. The velocity time travel curves are captured by the data receiving and processing device. The displacement of the point in rod is caused by the fluctuation of down-going wave and up-going wave.
There is a compressive stress in the initial down-going wave generated by the excited force at the top of the rod. Under the action of the compressive stress , the particle in the pile body moves. The velocity of the particle depends on the intensity of the stress and the material characteristics:
where is the vibration velocity of point in test rod, of which direction needs to be considered. is the propagation velocity of longitudinal wave; is the strain of test rod.
Based on , and , is obtained. If the wave impedance is defined as , will be captured. Considering the directions of wave, the incident wave and reflected wave are and , respectively.
In Fig. 3, and are the impedances up and down interface, respectively. Foot code , and are symbols for incident wave, reflected wave and transmission wave, respectively. The equilibrium equations can be obtained according to the continuity of interface:
Fig. 3The diagrammatic sketch of wave impedance change and wave propagation.
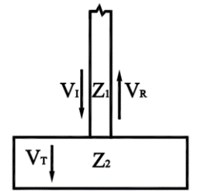
Based on Eq. (10), the down-going wave is:
Differentiating Eq. (18) is . Based on same process, the transmission wave is and the reflected wave is . According to and Eq. (16), the following equations is obtained:
Due to , , , Eq.(19) can be rewritten as:
Based on Eq. (16), the following equations is obtained:
If , Eq. (21) can be rewritten as:
In Eq. (29), is named by reflection coefficient of which range is [–1, 1]. Based on and , the following equations is obtained:
Eq. (23) is the basis of low strain reflection wave test. Due to the impedance of the interface on test rod and toe debris changes, and the impedance of test rod is larger than the impedance of toe debris when to test the thickness of toe debris (). The directions of reflected wave and transmission wave are opposite, which shows that the test velocity time travel curve is upward sudden change. The corresponding curves will presented in following part.
4. Numerical simulation analysis
The finite element software (ABAOUS) is used to verify the accuracy and reliability of the proposed test equipment.
4.1. Calculation method
Low strain reflection wave test for the thickness of toe debris is a dynamic problem in nature. ABAOUS can solve various problems according different dynamic characters. The solution methods are modal analysis method, immediate integration, and so on. This paper will use Explicit method of ABAQUS/Explicit which is immediate integration.
Explicit method can solve the problems without joint solution of equations and tangent stiffness matrix. So, the calculation cost of each incremental step is small, which is suitable for solving the high-speed dynamic load problem calculation [25].
4.2. Calculation models and assumptions
Fig. 4 shows the calculation model. This model employs the half size of bored piles which is similar to engineering actual to advance the calculational efficiency. C3D8R calculation unit is used to verify the calculational convergence.
The assumptions are: (1) Ignore the damping of rod shaft and toe debris; (2) the rod is linear elastic and small deformation; (3) uniform load on the top of test rod.
Fig. 4Calculation model
4.3. Parameter selection
This paper uses the bored pile of which the length and diameter of bored pile are 19 m and 0.6 m, respectively. 0.1 m and 20 m are selected as the diameter and length of the test rod. Its materials are shown in Table 2. The parameters of toe debris are shown in Table 3 [26]. To assure the accuracy of numerical simulation, thirteen different combinations of toe debris are analyzed according to Table 3, which are shown in Table 4.
Table 2The parameters of test rod
No. | Material | / t∙m-3 | / GPa | |
A | Concrete | 2.5 | 31.5 | 0.3 |
B | Carbon steel | 7.65 | 206 | 0.3 |
C | Cuprum | 8.65 | 93 | 0.37 |
D | Aluminum | 2.7 | 68 | 0.34 |
Table 3The parameters of toe debris
No. | Material | / kN∙m-3 | / MPa | / kPa | / ° | |
1 | Miscellaneous fill | 1.58 | 5 | 0.3 | 5 | 28.5 |
2 | Silty clay | 1.8 | 9.6 | 0.3 | 10 | 8 |
3 | Gravelly sand | 1.9 | 25 | 0.25 | 3 | 30 |
Table 4Thirteen different combinations of toe debris
Number of group | Number of material | Thickness of group |
I | 1 | 100 cm |
II | 2 | 100 cm |
III | 3 | 100 cm |
IV | 1 | 50 cm |
V | 2 | 50 cm |
VI | 3 | 50 cm |
VII | 1 | 30 cm |
VIII | 2 | 30 cm |
IX | 3 | 30 cm |
X | 1+2 | 25 cm+25 cm |
XI | 1+3 | 25 cm+25 cm |
XII | 2+3 | 25 cm+25 cm |
XIII | 1+2+3 | 10 cm+20 cm+20 cm |
4.4. Analysis of results
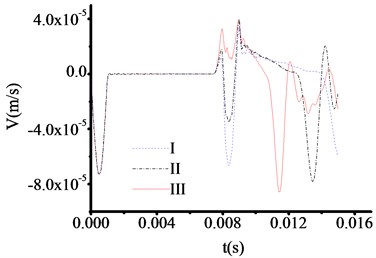
4.4.1. Results of testing 100 cm thickness toe debris with different test rods
Four types of materials of test rod shown as Table 2 are used to simulate the 100cm thickness toe debris, as well as 1000 Pa excited force. The test results are shown in Fig. 5-8. From Fig. 5-8, the curves process clearly up-abrupt changes before the bottom of rod reflecting signals. The interface of test rod and toe debris is not only the location of abrupt change, but also the location of change for wave impedance. The time at which the three curves in Fig. 5 correspond to the sudden change in velocity are 0.010651 s, 0.010651 s and 0.010651 s respectively. Therefore, the test thicknesses of toe debris are 1.096 m, 1.096 m and 1.096 m, respectively. The time at which the three curves in Fig. 6 correspond to the sudden change in velocity are 0.007200 s, 0.007200 s and 0.007200 s respectively.
Fig. 5The velocity time travel curve of test rod made by concrete (Thickness = 100 cm)
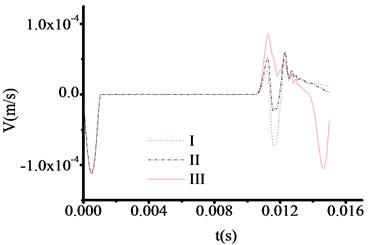
Fig. 6The velocity time travel curve of test rod made by carbon steel (Thickness = 100 cm)
Therefore, the test thicknesses of toe debris are 1.318 m, 1.318 m and 1.318 m, respectively. The time at which the three curves in Fig. 7 correspond to the sudden change in velocity are 0.011475 s, 0.011475 s and 0.011475 s respectively. Therefore, the test thicknesses of toe debris are 1.187 m, 1.187 m and 1.187 m, respectively. The time at which the three curves in Fig. 8 correspond to the sudden change in velocity are 0.007576 s, 0.007576 s and 0.007576 s respectively. Therefore, the test thicknesses of toe debris are 0.990 m, 0.990 m and 0.990 m, respectively. Accordingly, the test result is relatively sensitive to the materials of test rod. The maximum error is 0.318 m, and the calculation results are larger than the actual values, this means that the presented method can not only meet the specification requirements when to clear the toe debris [23], but also guarantee the quality of new piles. In addition, when the thickness of toe debris is relatively large, the result is insensitive to the materials of test rod.
Fig. 7The velocity time travel curve of test rod made by cuprum (Thickness = 100 cm)
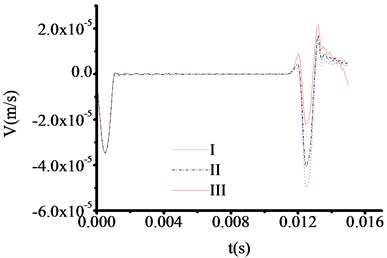
Fig. 8The velocity time travel curve of test rod made by aluminum (Thickness = 100 cm)
4.4.2. Results of testing 50 cm thickness toe debris with different test rods
All the parameters and methods are same as 4.4.1, only the thickness of toe debris changed to 50 cm in this part. The test results are shown in Fig. 9-12. From Fig. 10-11, the abrupt changes of curves are not clearly observed when the materials of test rod are carbon steel and cuprum.
Fig. 9The velocity time travel curve of test rod made by concrete (Thickness = 50 cm)
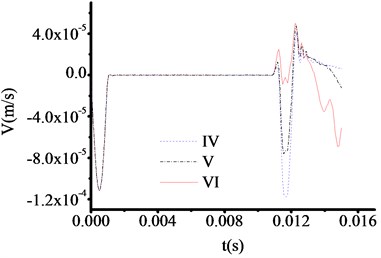
Fig. 10The velocity time travel curve of test rod made by carbon steel (Thickness = 50 cm)
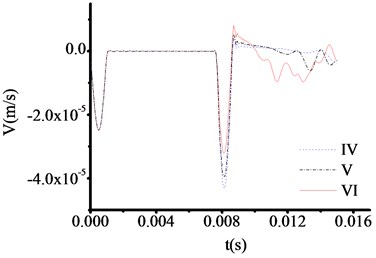
Fig. 11The velocity time travel curve of test rod made by cuprum (Thickness = 50 cm)
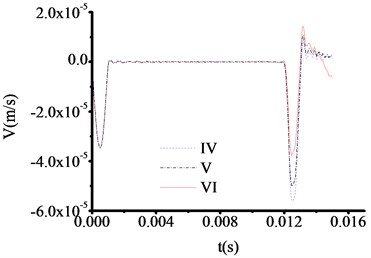
Fig. 12The velocity time travel curve of test rod made by aluminum (Thickness = 50 cm)
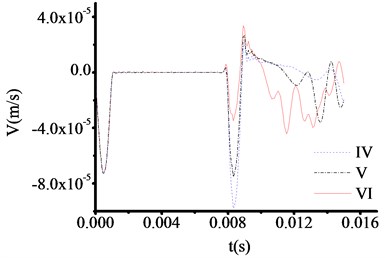
However, the abrupt changes of curves are clearly observed when the materials of test rod are concrete steel and aluminum from Fig. 9 and Fig. 12. The time at which the three curves in Fig. 9 correspond to the sudden change in velocity are 0.010951 s, 0.010951 s and 0.010951 s respectively. And the test thicknesses of toe debris are 0.563 m, 0.563 m and 0.563 m, respectively. The time at which the three curves in Fig. 12 correspond to the sudden change in velocity are 0.007800 s, 0.007800 s and 0.007800 s respectively. And the test thicknesses of toe debris are 0.428 m, 0.428 m and 0.428 m, respectively. The maximum error is 0.082 m according to above calculation, which meet the requirement of specifications after cleaning [23].
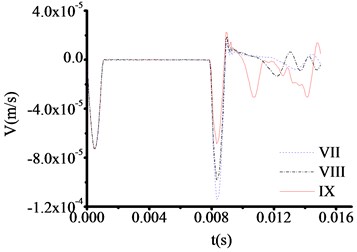
4.4.3. Results of testing 30 cm thickness toe debris with different test rods
All the parameters and methods are the same as 4.4.1, only the thickness of toe debris changed to 30 cm in this part. The test results are shown in Fig. 13-16. The test curve shows the same trend as described in 4.4.2. Although, the abrupt changes of curves are difficult to observe when the materials of test rod are concrete from Fig. 13, the locations of abrupt changes can be captured. The time at which the three curves in Fig. 13 correspond to the sudden change in velocity are 0.011100 s, 0.011100 s and 0.011100 s, respectively. The test thicknesses of toe debris are 0.299 m, 0.299 m and 0.299 m, respectively. The error is only 0.001 m, which shows that the calculation results are pretty accuracy.
From analysis, for the same excited force, the less thickness of toe debris is, the more accuracy results are obtained, which verify the validity of presented equipment.
Fig. 13The velocity time travel curve of test rod made by concrete (Thickness = 30 cm)
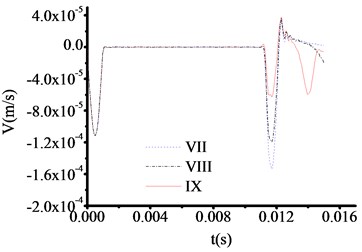
Fig. 14The velocity time travel curve of test rod made by carbon steel (Thickness = 30 cm)
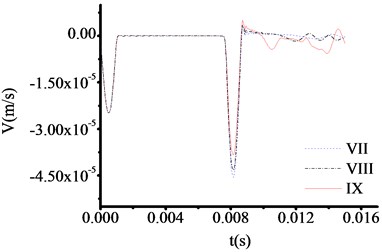
Fig. 15The velocity time travel curve of test rod made by cuprum (Thickness = 30 cm)
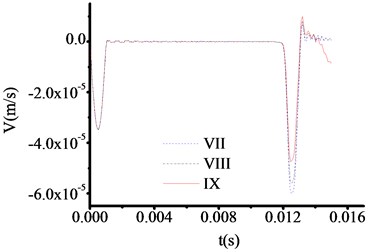
Fig. 16The velocity time travel curve of test rod made by aluminum (Thickness = 30 cm)
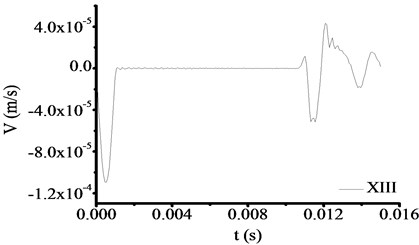
4.4.4. Results of different combinations of sediments detected by the same test rod
All the parameters and methods are the same as 4.4.1, only the toe debris combinations changed to X, XI, XII and XIII, which shown in Table 4. This part focuses on verifying the reliability of test equipment for different toe debris groups. The test results are shown in Fig. 17 and Fig. 18. From Fig. 17 and Fig. 18, if the toe debris consists of two materials (shown in Fig. 17) or three materials (shown in Fig. 18), the test curves are the same as Fig. 9. That is the velocity time travel curve processing sudden change on the interface between test rod and toe debris. In Fig. 17, the times of sudden change are 0.010951 s and 0.010951 s and 0.010951 s based on Fig. 17 and 0.010945 s based on Fig. 18, and the corresponding thicknesses of toe debris are 0.563 m, 0.563 m, 0.563 m and 0.575 m. The test error for different materials is 0.075 m, which is larger than the actual value. Therefore, it meets the requirement of specifications after cleaning [23].
Fig. 17The test results of X, XI and XII
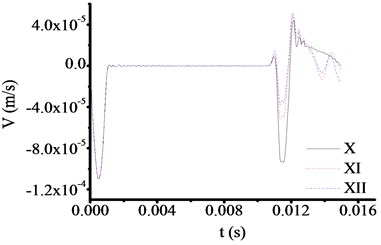
Fig. 18The test results of XIII
4.4.5. Results of different excited force by the same test rod and thickness of toe debris
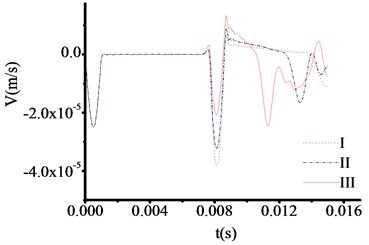
Using the same test method as 4.4.1. For toe debris, 100 cm thickness and three materials shown in Table 4 are selected to study velocity time travel curve when the top of test rod is loaded by 1000 Pa, 2000 Pa and 3000 Pa excited forces. Fig. 19-21 show the test results, which indicate that the curves are similar for different materials and excited forces.
Fig. 19The velocity time travel curves of I type toe. debris under different excited forces
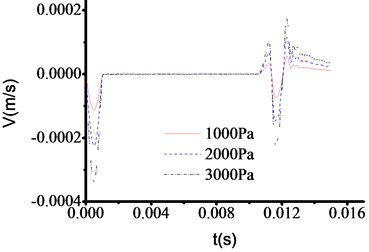
Fig. 20The velocity time travel curves of II type toe debris under different excited forces
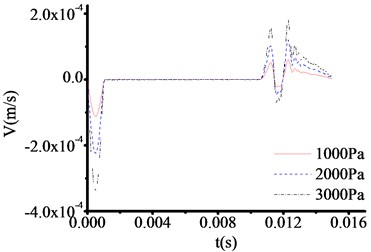
Fig. 21The velocity time travel curves of III type toe debris under different excited forces
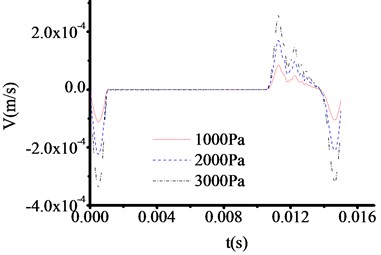
However, the wave impedance is sensitive to excited forces. The times of sudden change points are all 0.01065 s in Fig. 19-21, which is similar to Fig. 5. The corresponding thickness of tor toe debris is 1.096 m. By comparison, it is found that when the excitation force is larger, the signal at the mutation is more obvious. Therefore, when testing the 50 cm or 30 cm thickness of toe debris, the excited force loaded on the top of test rod should be increased. And the location of sudden change can be determined in Fig. 10-11, and Fig. 14-16.
5. Conclusions
1) In the device proposed in this paper, after the hole clearing operation is performed according to the measured result, the remaining maximum sediment amount is within the range of the engineering-related specification.
2) The results of testing the test rods with different materials for three different thicknesses of the sediment indicate that the material of the test rod will affect the test results under the same excitation force, and the thickness of the sediment is required for the test rod material. Higher, but the results show that the smaller the sediment thickness, the smaller the test error.
3) The measurement results of the sediment thickness of different thicknesses and different material combinations of three different materials indicate that the material properties of the sediment have little effect on the test results and can be neglected to some extent.
4) Different excitation forces on the test poles have no difference in accuracy for the same thickness of sediment measurement, but significantly affect the degree of change of the test curve. For sediments with smaller thickness, a larger excitation force should be used for detection.
5) The practical application of the device is the focus of the author's future research. The author's later work focus is to optimize the use of this device in order to facilitate the application of the construction site.
References
-
Baker C. N., Drumright E. E., Briaud J. L., et al. Drilled shafts for bridge foundations. Federal Highway Administration, FHWARD-92-004, 1993.
-
Fleming W. G. K., Weltman A. J., Randolph M. F., et al. Piling Engineering. 2nd Edition, Halsted Press, 1992.
-
Zhang L. M., Li D. Q., Tang W. H. Impact of routine quality assurance on reliability of bored piles. Journal of Geotechnical and Geoenvironmental Engineering, Vol. 132, Issue 5, 2006, p. 622-629.
-
Davis A. G., Dunn C. S. From theory to field experience with the non-destructive vibration test of piles. Proceedings of the Institution of Civil Engineers, Part 1 – Design and Construction, Vol. 57, Issue 2, 1974, p. 571-593.
-
O’neill M. W., Sarhan H. A. Structural resistance factors for drilled shafts considering construction flaws. Current Practices and Future Trends in Deep Foundations, 2004, p. 166-185.
-
Fleming W. G. K., Weltman A. J., Randolph M. F., et al. Piling Engineering. Taylor and Francis, New York, 2008.
-
Ellway K. Practical guidance on the use of integrity tests for quality control of cast in-situ piles. Proceedings of the 1st International Conference on Foundations and Tunnels, London, 1987, p. 228-234.
-
Thasnanipan N., Maung A. W., Baskaran G. Sonic integrity test on piles founded in Bangkok subsoil signal characteristics and their interpretations. Proceedings of the 4th International Conference on Case Histories in Geotechnical Engineering, 1988, p. 1086-1092.
-
Lew M., Zadoorian C. J., Carpenter L. D. Integrity Test of Drilled Piles for Tall Buildings. Structure Magazine, National Council of Structural Engineers and the ASCE, 2002.
-
Gan Y. C. Research on probability distribution of the number of defective piles in test pile foundation by random sampling without repetition and its application in engineering. China Civil Engineering Journal, Vol. 32, Issue 2, 1991, p. 62-70.
-
Preiss K., Shapiro J. Statistical Estimation of the Number of Piles to Be Tested on a Project. RILEM Commission on Non-Destructive Test, Stockholm, 1979.
-
Sarhan H. A., O’Neill M. W., Hassan K. M. Flexural performance of drilled shafts with minor flaws in stiff clay. Journal of Geotechnical and Geoenvironment Engineering, Vol. 128, Issue 12, 2002, p. 974-985.
-
Sarhan H. A., O’Neill M. W., Tabsh S. W. Structural capacity reduction for drilled shafts with minor flaws. ACI Structural Journal, Vol. 101, Issue 3, 2004, p. 291-297.
-
O’Neill M. W., Tabsh S. W., Sarhan H. A. Response of drilled shafts with minor flaws to axial and lateral loads. Engineering Structures, Vol. 25, Issue 1, 2003, p. 47-56.
-
Li D. Q., Tang W. H., Zhang L. M. Updating occurrence probability and size of defect for bored piles. Structural Safety, Vol. 30, Issue 2, 2008, p. 130-143.
-
Li D. Q., Zhang L. M., Tang W. H. Reliability evaluation of cross-hole sonic logging for bored pile integrity. Journal of Geotechnical and Geoenvirenment Engineering, Vol. 131, Issue 9, 2005, p. 1130-1138.
-
Xu D. S., Yin J. H., Liu H. B. A new measurement approach for deflection monitoring of large-scale bored piles using distributed fiber sensing technology. Measurement, Vol. 117, 2018, p. 444-454.
-
Chun O. H., Yoon H. K., Park M. C., et al. Slime thickness evaluation of bored piles by electrical resistivity probe. Journal of Applied Geophysics, Vol. 108, Issue 9, 2014, p. 167-175.
-
Xiao H. L., Cui X. L., Lei W. K. A bored pile deficiency detection method based on optical fiber temperature measurement. Optical Fiber Technology, Vol. 21, 2015, p. 1-6.
-
Ni S. H., Yang Y. Z., Tsai P. H., et al. Evaluation of pile defects using complex continuous wavelet Transform analysis. NDT&E International, Vol. 87, 2017, p. 50-59.
-
Xu M. J., Li P. P., Mei G. X., et al. Load-settlement behaviour of bored piles with loose sediments at the pile tip: Experimental, numerical and analytical study. Computers and Geotechnics, Vol. 102, 2018, p. 92-101.
-
AASHTO LRFD for Bridge Design Specifications. 8th Edition, American Association of State Highway and Transportation Officials, Washington, 2017.
-
JGJ 94-2008. Technical Code for Building Pile Foundations. China Architecture and Building Press, Beijing, 2008.
-
Sanichiro Yoshida Waves: Fundamentals and Dynamics. Morgan and Claypool Publishers, 2018.
-
Ataei H., Mamaghani M. Finite Element Analysis Applications and Solved Problems Using ABAQUS. 1st Edition, Taylor and Francis, New York, 2018.
-
Feng L. F. Experimental Studies and Numerical Simulations of the Effects of bottom Sediment on the Vertical Bearing Behaviour of Bored Piles. Tianjin University, Tianjin, 2011.
About this article

