Abstract
In Geo-engineering design, Geotech-engineers usually adopt ‘Mohr-Coulomb model (M-C)’ to substitute most soil material, this model is considered as linear elastic and perfectly plastic model, despite, in the coastal engineering, the sand-clay mixed with water, cement, fine aggregate or similar materials are the most common interface medium among soil and pile bodies, the frictions from them have strong affection on piles settlements, due to their complex components and mechanics, never can simulate these interface medium by ‘M-C model’ easily, hereby, the novelty of this article is that author adopt ‘Hardening soil constitutive model (HSs)’ as the interface medium and deployed numerical studies on its application in practical case, the studies included simulating the mechanic behaviors among soil and piles(morphology of deformation), design assumptions based on the analysis of geotechnic report and empirical views, besides compared the pile settlement curves by ‘M-C’ and ‘HSs’ models with the static loads test results, and identified the ‘HSs’ model is a suitable constitutive model for sand-clay mixture soil in this Geo project design. In the end, author proposed a few conclusions about the medium birth mechanism, criteria of model selection and advice for similar engineering reference.
1. Introduction
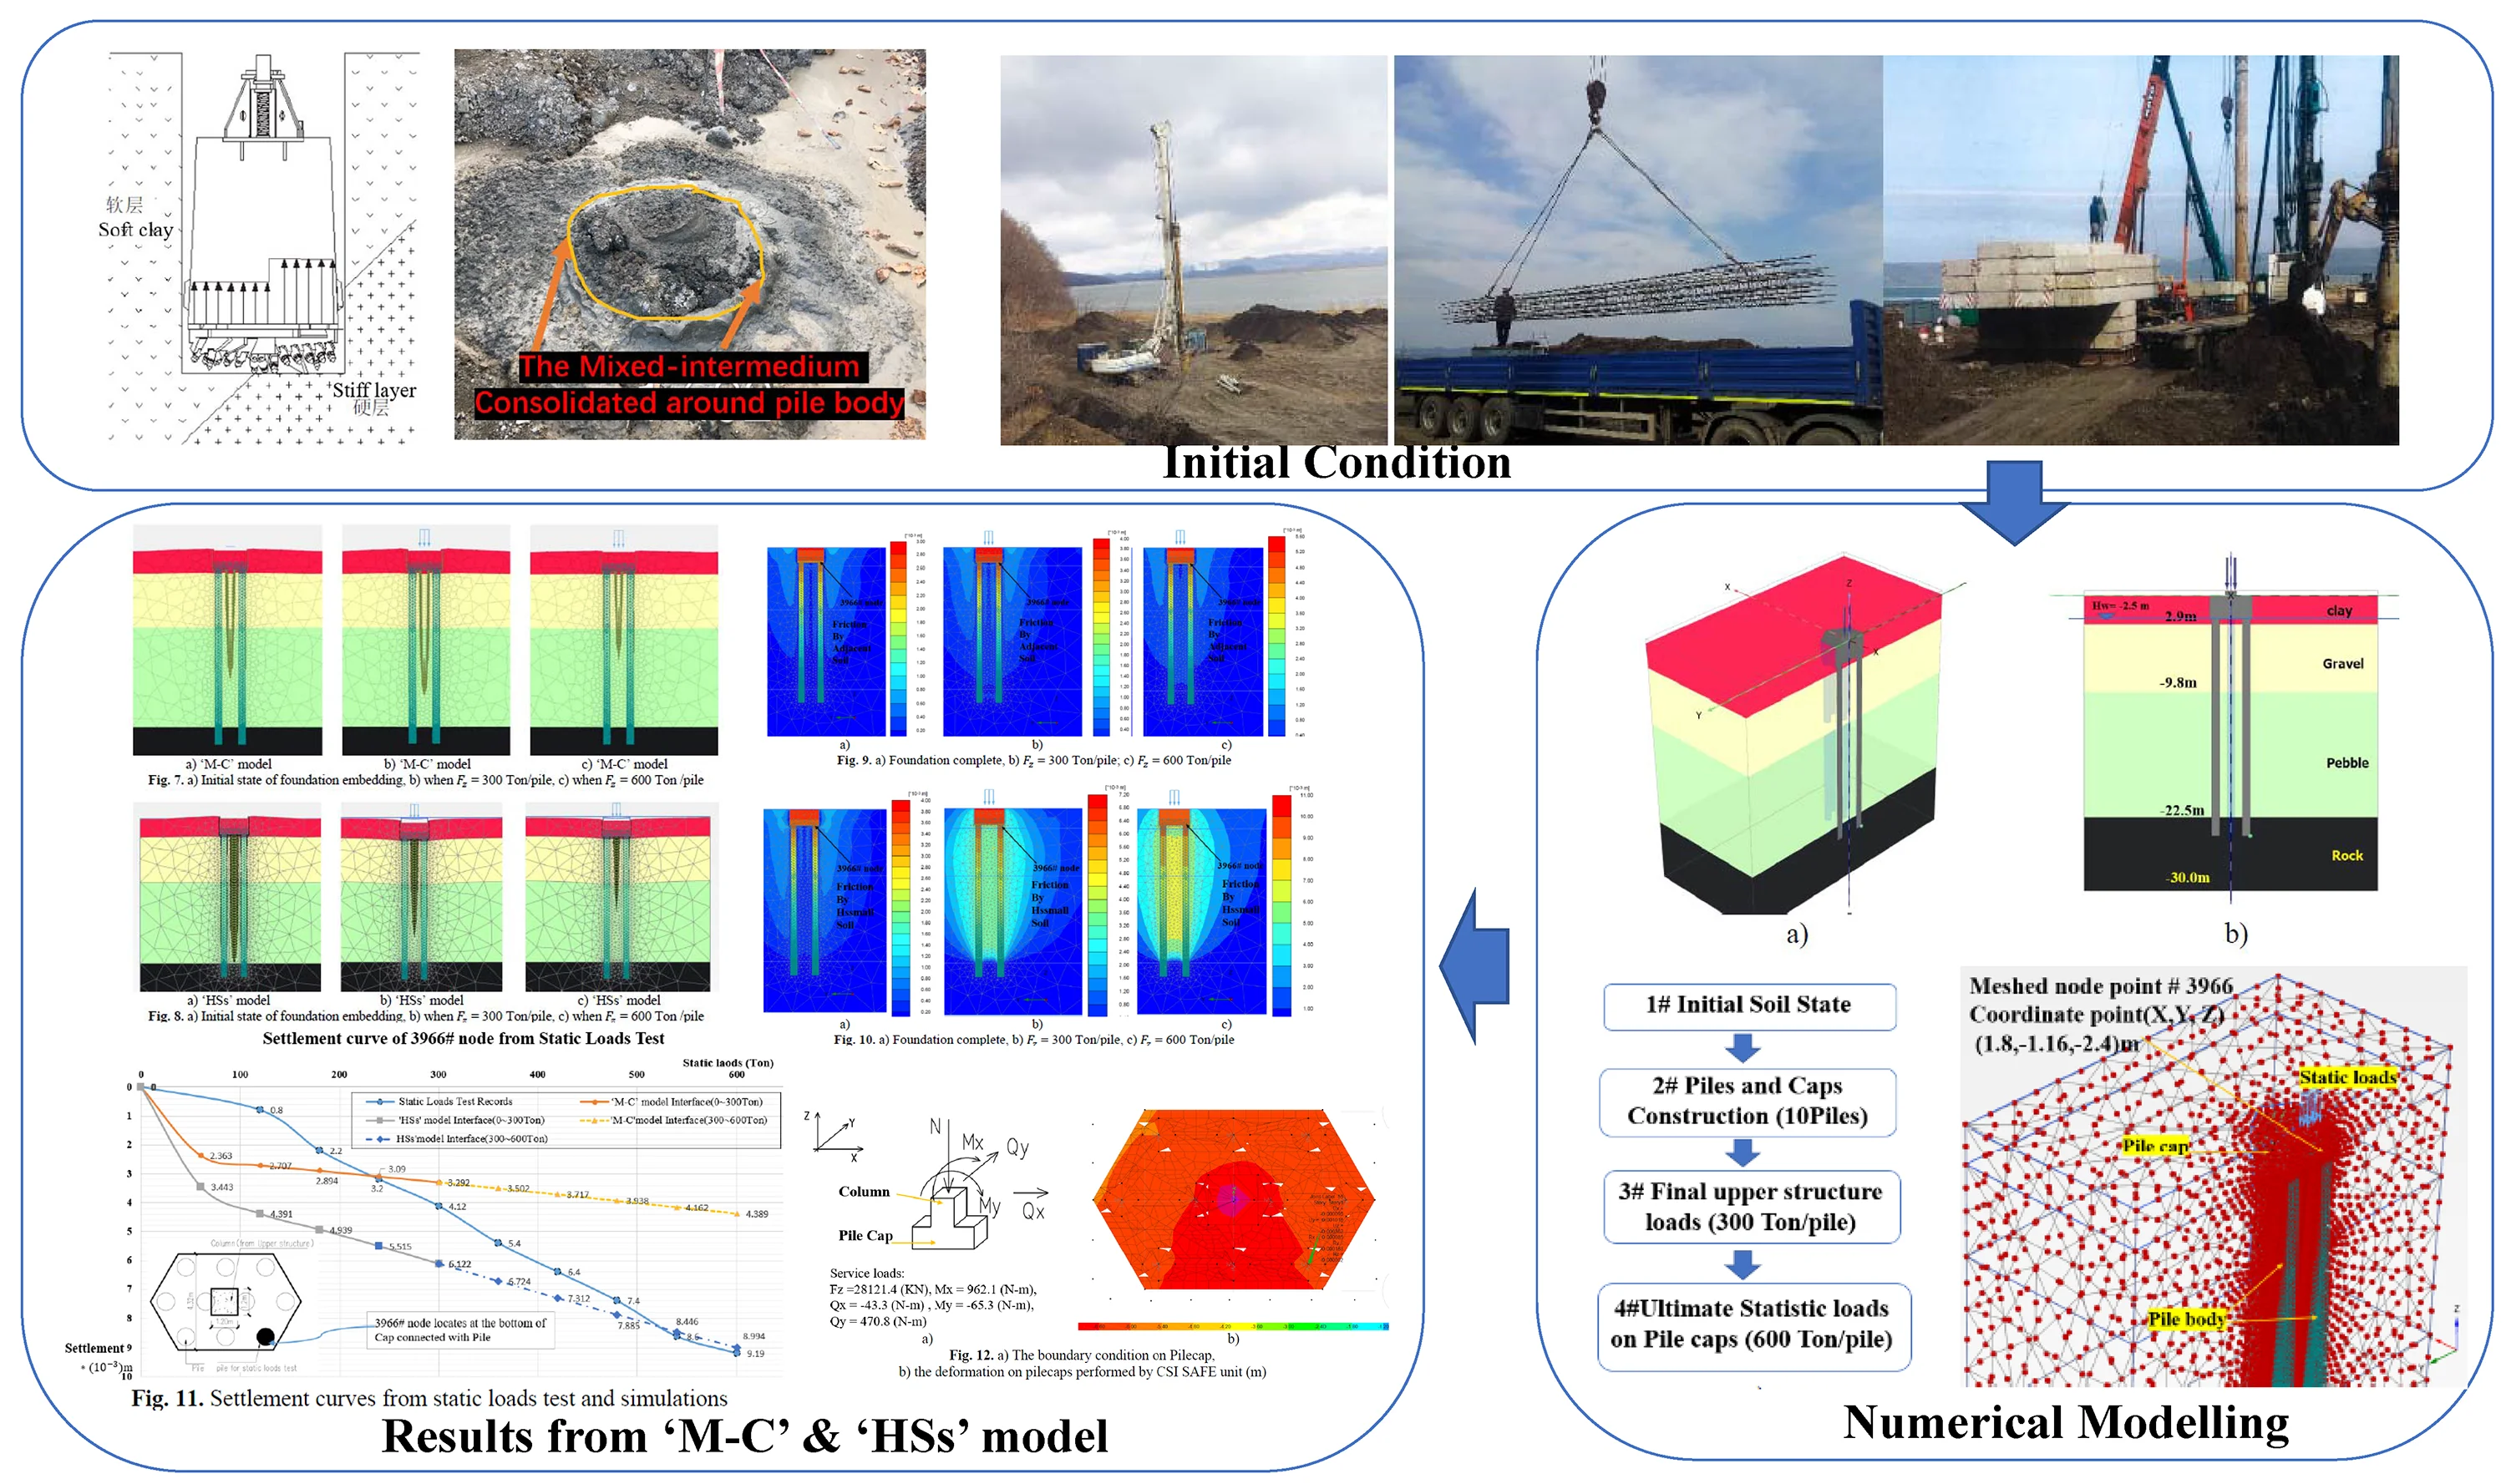
For every engineering project, Structures must stand on the stable foundations and avoid soft clay or weak bearing capacity strata. Bored piles with caps foundation play a critical role for the upper structure stability and safety, and static loads test on piles is a generic method to test and verify the bearing capacity of piles and record the pile settlement values during the test. However, most buildings are inevitable to overcome the soft clay or high-level underground water beneath foundations, pile caps foundations as a better option solved these problems. Most of piles belong to ‘friction piles’ and will consider the soil-pile friction along the pile body, the friction forces are provided by interface medium (sand-clay with water and other mixtures) generally. To get a better understanding about these interface medium mechanical behaviors and interactions with pile bodies, when upper structure loads affect, geotechnical engineers usually choose ‘Mohr-Coulomb’ model (M-C), to simulate most soil material, as ‘M-C’ model is considered as linear elastic perfectly plastic model. However, due to the complex components from the interface materials (sand-clay, cement, fine aggregate, other mixtures), never can substitute them by ‘M-C model’ simply to simulate the intermedium mechanic behaviors among piles and soils. It is obvious that during the bored piles drilling process, to some extent, the mix materials surrounding of piles are hardened by cycling loads from drills working. In this project, main contractor used the rotary drilling equipment which matched the description from Zhang [1], refer Fig. 1(a), the vibration and cycling loads forms come from depicts of Kramer [2], refer Fig. 1(b), the mixed soil samples around piles refer in Fig. 1(c).
Fig. 1a) Breaking resistance distribution in drilling hard and soft alternate formation (from Zhang [1]); b) displacements caused by vibration waves, drilling rig working shock waves are similar to seismic waves (from Kramer [2]); c) the drilling soil sample (consolidated) mixed with water, cement, fine aggregate from site inspection
![a) Breaking resistance distribution in drilling hard and soft alternate formation (from Zhang [1]); b) displacements caused by vibration waves, drilling rig working shock waves are similar to seismic waves (from Kramer [2]); c) the drilling soil sample (consolidated) mixed with water, cement, fine aggregate from site inspection](https://static-01.extrica.com/articles/22755/22755-img1.jpg)
a)
![a) Breaking resistance distribution in drilling hard and soft alternate formation (from Zhang [1]); b) displacements caused by vibration waves, drilling rig working shock waves are similar to seismic waves (from Kramer [2]); c) the drilling soil sample (consolidated) mixed with water, cement, fine aggregate from site inspection](https://static-01.extrica.com/articles/22755/22755-img2.jpg)
b)
![a) Breaking resistance distribution in drilling hard and soft alternate formation (from Zhang [1]); b) displacements caused by vibration waves, drilling rig working shock waves are similar to seismic waves (from Kramer [2]); c) the drilling soil sample (consolidated) mixed with water, cement, fine aggregate from site inspection](https://static-01.extrica.com/articles/22755/22755-img3.jpg)
c)
From both figures, the interface medium (sand-clay, water, cement, fine aggregate, other mixtures) suffered from shear and compression harden formations. To describe this kind soil, Kondner [3] proposed the concept of ‘hardening soil model’ in his book, Shanz [4] expanded the hardening soil model with Isotropic hardening and small-strain stiffness (HSsmall) two subcategories respectively, these models are advanced models for simulating the behavior of different types of soil, both soft soils and stiff soils, they can be consider as the extension from ‘M-C’ model. A number of recent studies showed the development about the harden soil model: Alarcón et.al [5] adopt Hardening Soil Model (HSM) and perform finite element analysis in Geo-design, Chen et al. [6] described the birth mechanism of consolidated silt in a silty seabed by wave hardening. As per the geotechnic report description and the site inspection about the drilling soil samples from bore piles, which are remixed with cement and fine aggregate, refer Fig. 1(c), inspired by Surarak et al. [7] and Tsige et al. [8] about the harden soil model application in coastal area, author assumed that ‘HSs model’ can simulate the interface medium and compared with the settlements from ‘M-C model’ provided, therefore, it is possible to verify the availability of HSs model in this project.
2. Theoretical demonstrations and modeling parameters for the engineering case
2.1. Material model demonstration
The ‘M-C constitutive model’ has linear elastic with perfect plastic characteristic, and commonly wide used in linear material, in this case, to have better fitting with practical scenario, author introduced a hardening soil model (HSs), which is an advance model to simulate various stiff and soft soil, the yield surface of ‘M-C’ model are fixed in principal stress space, on the contrary, the surface in the ‘HSs’ model is flexible, and the yield surface can expand due to plastic straining, models yield surfaces depicted in Fig. 2(a, b). The ‘HSs’ model is non-linear soil model under cyclic loading, which followed Masing's rule [9, 10], the hardening plasticity accounts for more rapidly decaying small-strain stiffness during initial loading, therefore, the mechanic features showing in Fig. 2(c).
For the Hardening soil model, the most important parameters are the plastic straining from primary deviatoric loading , and compression loading , also with elastic unloading and reloading as the auxiliary parameters. As the advanced model, HSs model is restrained by initial shear modules and shear strain level as well. In this article, the induction procedures of ‘HSs’ model formula are not the priority, we focus on the model performance, the demonstration of ‘HSs’ model can be referred from Alarcón et al. [5], Surarak et al. [7] and Brinkgreve et al. [13], the relevant parameters mentioned above in this case depend on their methodology.
Fig. 2a) Yield surface of ‘M-C model’, b) yield surface of ‘HSs model’, c) stiffness reduction in initial or primary loading and in unloading / reloading on Hardening Soil Model [3, 11, 12]
![a) Yield surface of ‘M-C model’, b) yield surface of ‘HSs model’, c) stiffness reduction in initial or primary loading and in unloading / reloading on Hardening Soil Model [3, 11, 12]](https://static-01.extrica.com/articles/22755/22755-img4.jpg)
a)
![a) Yield surface of ‘M-C model’, b) yield surface of ‘HSs model’, c) stiffness reduction in initial or primary loading and in unloading / reloading on Hardening Soil Model [3, 11, 12]](https://static-01.extrica.com/articles/22755/22755-img5.jpg)
b)
![a) Yield surface of ‘M-C model’, b) yield surface of ‘HSs model’, c) stiffness reduction in initial or primary loading and in unloading / reloading on Hardening Soil Model [3, 11, 12]](https://static-01.extrica.com/articles/22755/22755-img6.jpg)
c)
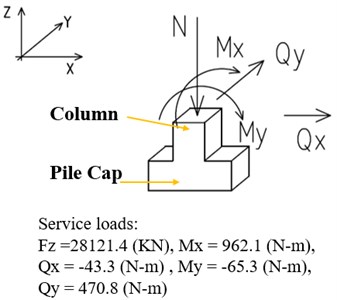
2.2. Engineering case description
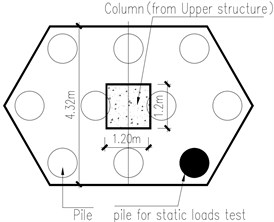
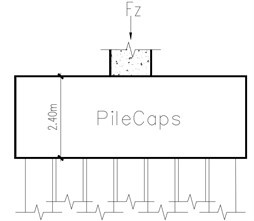
The structure building located in North-east Asian coastal area with constantly underground seawater level = –2.5 m, the upper structure is 12F concrete reinforcement building (RC) standing on the pile caps combined with Mat foundations, the vertical loads on the test pile cap from upper structure, = 28200 KN. The pile cap involved here has 10 piles (800 mm, 22 m) underground, the pile cap structure details refer Fig. 3(a), (b), (c), all endings of piles are embedded in the ‘Rock’ strata more than 1m (refer the Fig. 4(a), (b)), which means, each pile should be capable of 300 Ton bearing capacity to support upper structure. As per structure design demands and following the static loads test code [14, 15], the ultimate bearing capacity should reach to 600 Ton for each pile.
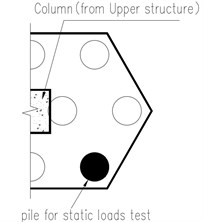
Fig. 3a) Top view of pile cap, b) front view of pile cap, c) symmetrical top part of pile cap
a)
b)
c)
In the modeling phase, it is obvious that the pile cap is symmetrical structure Fig. 3(a), hence, author adopt symmetrical part showing in Fig. 3(c).
Fig. 4(c) is a simplified test and data collection procedure, in the practical phase, the static loads test would experience 10 magnitudes loads at least, as per test plan, the static loads in each step are 120 Ton, 180 Ton, 240 Ton …600 Ton respectively (each step loads increased by 60 Ton). When start doing numerical analysis, setting initial stresses for soil (K0 procedure), then setting service loads step by step till 300 (Ton/pile) and the same loading periods followed the practical test scheme. The review of bore piles drilling, rebar cages installation and static loads tests showing in Fig. 5.
Fig. 4a) Perspective of modeling pile cap; b) stratigraphic profile; c) analysis procedure
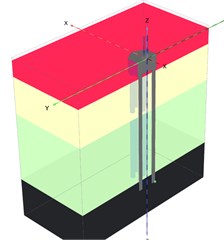
a)
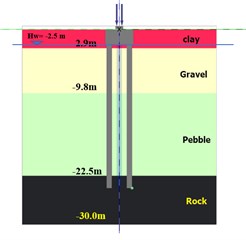
b)
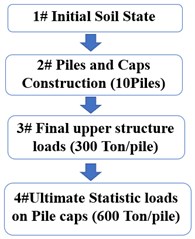
c)
Fig. 5a) Bored pile drilling, b) installation of rebar cage, c) static loads test (Max 600 ton/pile)
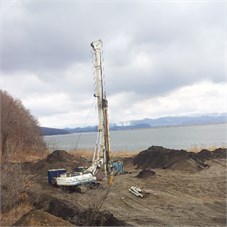
a)
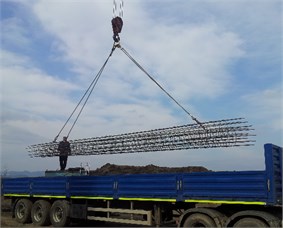
b)
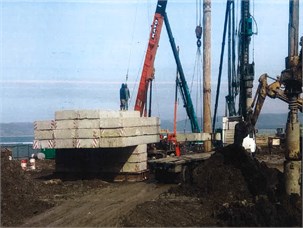
c)
2.3. Material model parameters collection
According to the pile concrete compressive strength test report and Geo-lab test, 25.6 MPa, 20 KPa, 60 KPa, initial shear modules 26 MPa. Thus, the complete parameters tables showing in Table 1.
Table 1Full set parameters in this project models
Strata layer | (KN/m2) | Poisson | (KN/m3) | (KN/m3) | (KN/m2) | Model type |
Clay + sand | 2.00E+03 | 0.30 | 19 | 20 | 18 | Mohr-Coulomb |
Gravel | 5.00E+04 | 0.31 | 21.58 | 22 | 20 | Mohr-Coulomb |
Pebble | 5.00E+03 | 0.32 | 22.3 | 23 | 25 | Mohr-Coulomb |
Rock | 3.20E+07 | 0.30 | 26 | 26 | 30 | Mohr-Coulomb |
Interface material | – | – | 19 | 20 | 15 | HSsmall |
Pile Concrete | 3.00E+07 | 0.20 | 24 | – | – | Non-porous |
3. The numerical study and relevant results analysis:
3.1. Demonstration of modeling and numerical analysis procedure
During the finite element analysis procedure, author established the pile-cap with soil models in Space-Claim, and pile caps and pile bodies are built by solid model with concrete material, the strata information from Table 1, addressed the soil materials properties, the numerical study and analysis procedures depicted in Fig. 6 series.
Fig. 6a) The basic workflow on the numerical analysis, the boundary conditions are described in Fig.12 where can be used for structure design and understood easily as well, b) the pile cap solid model in symmetrical form, c) the meshed node # 3966 track for post processing, d) the practical test position matched the model mesh location
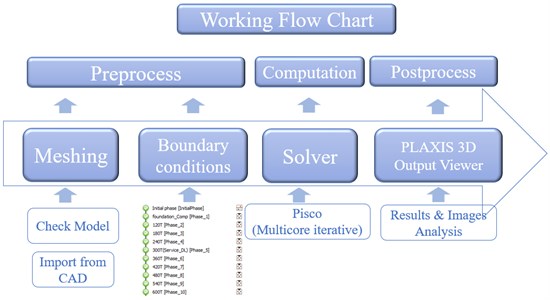
a)
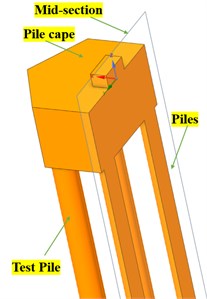
b)
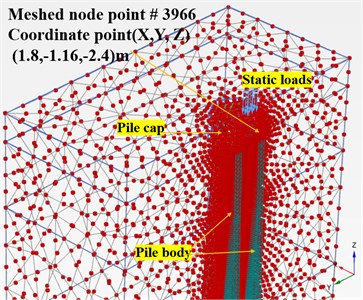
c)
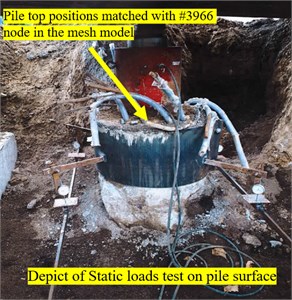
d)
3.2. Deformation results post processing
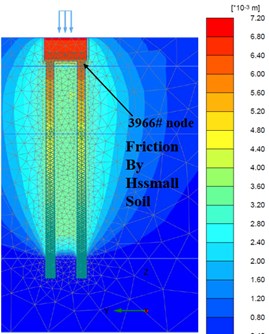
Extracting the deformation results from meshed model in PLAXIS, and captured main results in Fig. 7.
From Fig. 7 and Fig. 8, when adopting ‘M-C’ and ‘HSs’ model, it is obvious that there are huge disparities on the deformation of soil among piles in mesh. In terms of deformation time order and consequent, ‘HSs’ model performed much more reasonable: when drilling commenced, pile and caps broke the equilibrium of soil initial stress and soil deformation reached the maximum swell after the bore piles and pile caps construction (cycle loads from equipment during all drilling process), when upper loads reached service design loads (= 300 Ton/pile), the soil initial consolidation complete and the medium soil stress around pile body gradually keep equilibrium with surrounding soil. Due to the pile body already embedded into the rock strata and soils consolidated, when ultimate loads (= 600 Ton/pile) worked, the soil deformation had similar performance like the service loads (= 300 Ton/pile) did.
Fig. 7a) Initial state of foundation embedding, b) when Fz = 300 Ton/pile, c) when Fz = 600 Ton /pile
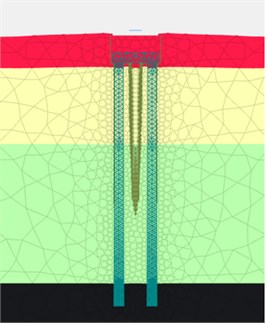
a) ‘M-C’ model
b) ‘M-C’ model
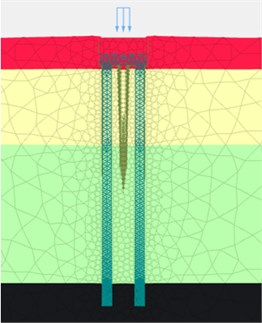
c) ‘M-C’ model
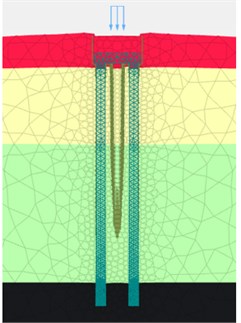
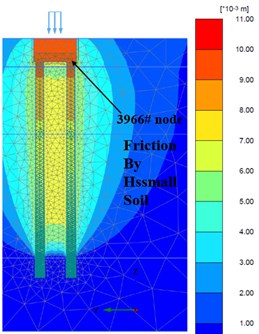
Fig. 8a) Initial state of foundation embedding, b) when Fz = 300 Ton/pile, c) when Fz = 600 Ton /pile
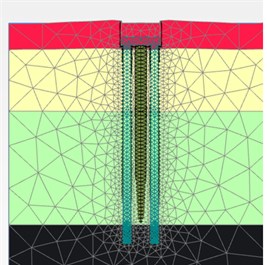
a) ‘HSs’ model
b) ‘HSs’ model
c) ‘HSs’ model
3.3. The settlement results post process
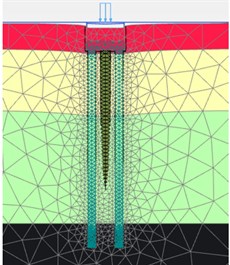
The numerical simulation of settlement on piles can be described in Fig. 9 and Fig. 10.
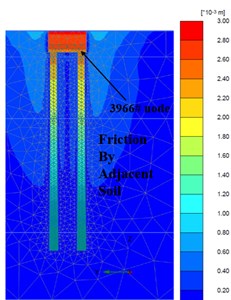
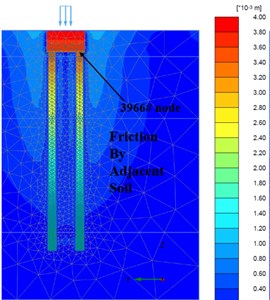
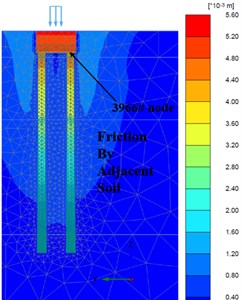
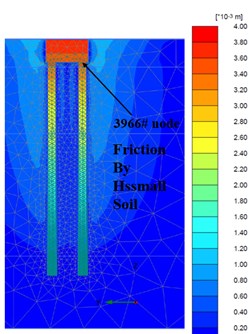
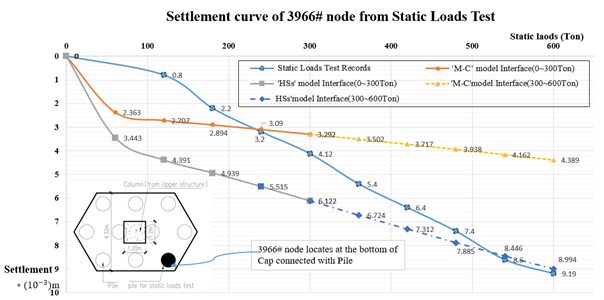
Selecting the typical node (#3966) which marked in Fig. 6(c, d) and Fig. 9 and Fig. 10, established the settlement curves chart in Fig. 11. In terms of pile settlement, during the static loads test procedure, when loads on mono plie commenced from initial self-weight to ultimate loads ( = 600 Ton/pile), the settlement by ‘M-C’ model as the interface medium whose frictions controlled by adjacent soil and reduction coefficient (0.7-0.9), performed smaller quantities than the practical test results, to be more precisely, when reached service and the ultimate loads (= 300 and 600 Ton/pile), the settlements –3.29×10⁻³ m and –4.39×10⁻³ m, these values are much lower than practical test ( –4.12×10⁻³ m and –9.19×10⁻³ m). On the other side, the ‘HSs’ models showed a similar settlement trend and displacement quantities approached the practical static loads test results, when reached the service loads (= 300 Ton/pile), the = –6.12×10⁻³ m, the smooth curve connected with previous checkpoint performed similar trend like practical test curve, when reached the ultimate loads ( = 600 Ton/pile), the = –8.99×10⁻³ m, nearly equal to 9.19×10⁻³ m.
In the practical situation, with the restrain of upper structure loads, most piles will resist service loads (= 300 Ton/pile) in their life cycle, the scenarios that suffering the ultimate load (= 600 Ton/pile), are mostly possible appeared in the static loads test only, therefore, the ultimate loads (= 600 Ton/pile) phrase can be predicted by numerical simulation, the dash line (yellow and blue) are the simulation results from settlement predictions.
Fig. 9a) Foundation complete, b) Fz = 300 Ton/pile; c) Fz = 600 Ton/pile
a)
b)
c)
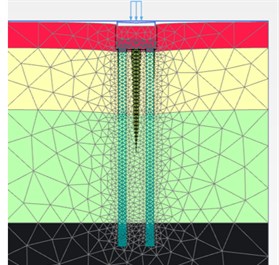
Fig. 10a) Foundation complete, b) Fz = 300 Ton/pile, c) Fz = 600 Ton/pile
a)
b)
c)
Fig. 11Settlement curves from static loads test and simulations
To cross verify the results, it is necessary to build numerical model in CSI SAFE with the same parameters, and illustrate the boundary conditions in Fig. 12(a), then record the final settlement result images in Fig. 12(b), focus the same test location, it is clear that when the service loads on the pile cap (= 300 Ton/pile), the maximum settlement of pile = –6.36×10⁻³ m, nearly match the ‘HSs model’ results at the same load magnitude in Fig. 11.
Fig. 12a) The boundary condition on Pilecap, b) the deformation on pilecaps performed by CSI SAFE unit (m)
a)
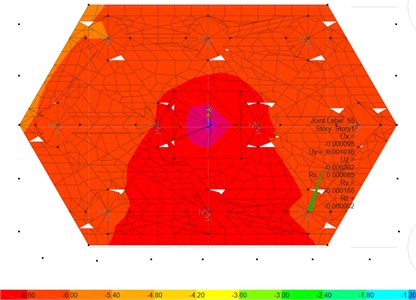
b)
4. Conclusions
In this article, author demonstrated the numerical modeling process and simulation results of bore piles intermedium soil based on the ‘M-C’ model and ‘HSs’ model, including the possible birth mechanism of interface medium (soil) among pile bodies, and made some assumptions about the soil model based on the geo-report and relevant academic paper, compared the deformation morphology and the settlements of different soil constitutive models by Finite Element Analysis, the conclusions listed below:
1) From the simulation results and deformation depicts, the hypothesis that ‘Bore piles interface soil can be considered as ‘HSs’ model when working under the vibration or cycle loads’ is true. In terms of deformation morphology, the ‘HSs model’ has better performance than the ‘M-C’ model does.
2) The ‘HSs’ model is capable to simulate the sand-clay mixture interface medium around piles in this coastal engineering, the cycle-vibration shockwaves from equipment nearby made a great contribution for the ‘HSs’ model consolidation and enhanced by the remix from cement and fine aggregate.
3) The settlement curves of bored pile, which adopt ‘HSs’ model, performed better results than the ‘M-C’ model, and more accurate than ‘M-C’ model.
4) The pile cap final settlement results from CSI-SAFE simulations matched the practical test results, CSI-SAFE gave some valuable insight into the way for cross verification, despite, CSI-SAFE cannot reflect the interactions and deformation morphology and trends among soil and pile bodies.
Overall, the frictions from interface soil among pile bodies, are critical loads for pile design, the mechanism birth of frictions mainly caused by the asymmetric deformations and stiffness among adjacent soils and pile bodies. The various stiffness soils determine the soil deformation behavior and directions, their deformation showed miscellaneous morphologies, especially functioned by the vibration and equipment cycle loads. In this case, the ‘HSs’ model with local empirical parameters, simulated the interface medium better than ‘M-C’ model successfully, and presented reasonable results, moreover, its settlement curve fit the static loads test better than ‘M-C’ model.
References
-
J. Zhang et al., “Rotary drilling with reduced WOB under special working conditions,” (in Chinese), Drilling Engineering, Vol. 6, pp. 109–112, https://doi.org/10.12143/j.ztgc.2021.06.017
-
S. L. Kramer, Geotechnical Earthquake Engineering. Upper Saddle River, N.J: Prentice Hall, 1996.
-
Kondner and R. L., “A hyperbolic stress-strain formulation for sands,” Northwestern University, 1963.
-
T. Schanz et al., “On the stiffness of sands,” in Pre-Failure Deformation Behaviour of Geomaterials, Thomas Telford Publishing, 2015, pp. 383–387.
-
A. J. Alarcón Posse, J. F. Rodríguez Rebolledo, J. A. Buriticá García, B. Caicedo Hormaza, and E. Rodríguez-Rincón, “Validation of a 3D numerical model for piled raft systems founded in soft soils undergoing regional subsidence,” Soils and Rocks, Vol. 44, No. 1, pp. 1–15, Mar. 2021, https://doi.org/10.28927/sr.2021.053620
-
X. Chen et al., “Evolution process and hardening mechanism of consolidated silt in silty seabed subject to waves,” Applied Ocean Research, Vol. 125, p. 103214, Aug. 2022, https://doi.org/10.1016/j.apor.2022.103214
-
C. Surarak, S. Likitlersuang, D. Wanatowski, A. Balasubramaniam, E. Oh, and H. Guan, “Stiffness and strength parameters for hardening soil model of soft and stiff Bangkok clays,” Soils and Foundations, Vol. 52, No. 4, pp. 682–697, Aug. 2012, https://doi.org/10.1016/j.sandf.2012.07.009
-
D. Tsige, M. Korita, and A. Beyene, “Deformation analysis of cement modified soft clay soil using finite element method (FEM),” Heliyon, Vol. 8, No. 6, p. e09613, Jun. 2022, https://doi.org/10.1016/j.heliyon.2022.e09613
-
O. A. Numanoglu, M. Musgrove, J. A. Harmon, and Y. M. A. Hashash, “Generalized non-masing hysteresis model for cyclic loading,” Journal of Geotechnical and Geoenvironmental Engineering, Vol. 144, No. 1, p. 06017015, Jan. 2018, https://doi.org/10.1061/(asce)gt.1943-5606.0001816
-
P. Haghdoust, A. Lo Conte, S. Cinquemani, and N. Lecis, “A numerical method to model non-linear damping behaviour of martensitic shape memory alloys,” Materials, Vol. 11, No. 11, p. 2178, Nov. 2018, https://doi.org/10.3390/ma11112178
-
“PLAXIS(CE),” Material Models Manual, Bentley, 2021.
-
T. Schanz, P. A. Vermeer, and P. G. Bonnier, “The hardening soil model: formulation and verification,” in Beyond 2000 in Computational Geotechnics, pp. 281–296, Jan. 2019, https://doi.org/10.1201/9781315138206-27
-
E. E. A. R. B. J. Brinkgreve and H. K. Engin, “Validation of empirical formulas to derive model parameters for sands,” in Numerical Methods in Geotechnical Engineering, pp. 153–158, May 2010, https://doi.org/10.1201/b10551-27
-
“Standard method of testing piles under static axial compressive load,” ASTM, Philadelphia, PA, 1994.
-
JGJ 94-2008, “Technical code for building pile foundations,” (in Chinese), China Architecture and Building Press, Beijing, 2008.
About this article

