Abstract
At present, the calculation of active earth pressure behind retaining walls is mainly based on the hypothesis that the fracture surface of rolling earth behind retaining walls is straight-running through wall heels. However, most experiments have proven that this hypothesis is false. In this study, active earth pressure behind retaining walls under seismic loading was discussed from the perspective of stress deflection. Stress on soil layer behind the vertical retaining wall was analyzed by quasi-static method. Then, the expression of seismic angle of rupture was proposed by referring to the balance of horizontal forces and changes with wall height. On this basis, the calculation formulas of active earth pressure, seismic active earth force, total moment at the wall and the point of application of active thrust from the base of wall were acquired by solving this balance equation. Calculated results were compared with test data and results of other methods. The rationality of the proposed method was verified. Thus, the proposed method is applicable to multi-layered filling behind the retaining wall.
1. Introduction
Due to frequent earthquakes that have happened recently, retaining wall failures caused by earthquake occur occasionally. Seismic load is an accidental loading. Whether the seismic load and its point of action can be calculated accurately has become extremely important to the seismic design of retaining walls. At present stage, the quasi-static and quasi-dynamic methods are two major approaches used to calculate earthquake-induced earth pressure of rigid retaining walls. The quasi-static method follows a simple principle and can be easily operated; thus, it is used frequently. The most typical quasi-static method is the Mononobe-Okabe(M-O) formula, which was established by Japanese scholars Mononobe [1] and Okabe [2] on the basis of the limit equilibrium theory. Under seismic loading, active earth pressure behind a retaining wall has a linear distribution, and the point of resultant action is one-third of the wall height above ground. This finding disagrees with the experimental result of Sherif [3] and Ishibashi [4], in which active earth pressure behind the retaining wall has a nonlinear distribution. Later, Choudhury and Singh [5], Saran and Gupta [6], Shukla et al. [7], Ghosh [8], Sharma and Ghosh [9], Lin et al. [10] improved the M-O formula and reported the calculation formula of nonlinear distributed active earth pressure under seismic loading. However, these formulas did not consider the active earth stress-deflection after the retaining wall. According to the mobile gate test of Terzaghi [11] and several theoretical studies (Handy [12]; Paik and Salgado [13]; Rao et al [14] and Cai [15]), stress-deflection in soil is objective. Zhou [16], Anindya [17] discussed effects of soil stress-deflection on earth pressure under seismic loading. These research methods were based on the hypothesis that the fracture surface is a surface running through the wall heel under seismic loading. However, Zhu [18] discovered in the laboratory test of earth pressure on the gravity retaining wall that the upper deflection of the retaining wall grows quickly, while lower deflection was relatively slight. Nevertheless, there are few studies on earthquake-induced active earth pressure based on the changing angle of rupture. Ellis [19] analyzed nonlinear distribution of the active earth pressure by viewing the fracture surface as a curved one. However, this hypothesized curved surface used cycloid under non-seismic loading as the fracture surface model, thus failing to reflect effects of seismic loading truly.
In this paper, to address the aforementioned issues, a novel approach for calculating the active earth pressure on rigid retaining walls with considerations to the seismic load and soil stress-deflection was proposed. Firstly, a balance equation was constructed by the principle of zero horizontal resultant force. As such, the calculation formula of soil angle of rupture which changes with wall height was established. Then, calculation formulas of the active earth pressure, the seismic active earth force, the total moment at the wall and the point of application of active thrust from the base of wall were constructed. The predictions of the proposed method were verified against results of other previously published methods.
2. Deduction of formula
For the purpose of simplification in this analysis, the following assumptions are made:
1) Influences of angle difference between and are neglected when calculating the arc radius of soil stress-deflection (). Where and represent the rotation angle of the principal stress on the differential flat element on the active sliding surface and the deflection angle of major principal stress at wall respectively.
2) Vertical soil stress is approximately .
The mechanical model of micro-smooth crack is shown in Fig. 1. When seismic load is neglected, the shear stress on the thin layer can be expressed as:
Since there’s no shear stress was observed on the horizontal layer, there’s:
By integrating Eq. (3) with respect to . It can get:
According to the assumption:
Substituting these into Eq. (7), it can be rewritten as:
If the retaining wall is divided into , and at the depth of , then:
Seismic angle of rupture can be expressed as:
According to this formula, the angle of rupture changes in a curve manner from the upper to bottom parts of the retaining wall. A small angle of rupture is observed at the upper positions, and a large angle at lower positions. With respect to failure mode, large failure area is observed at upper positions, but small failure area at lower positions, which is consistent with experimental results. If neither seismic load nor stress-deflection is considered, the angle of rupture is degraded to the angle of rupture of Rankine earth pressure.
Fig. 1The force model of the slip crack body
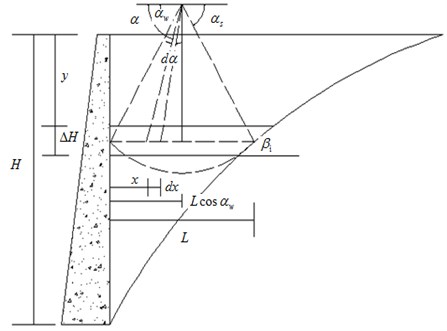
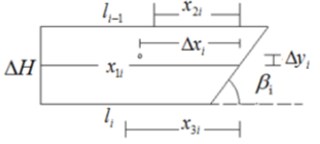
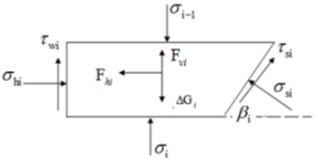
Fig. 2The size and stress analysis of layer I
a)
b)
The stress of the thin layer is analyzed. Component sizes and stresses are shown in Fig. 2. Based on sectional geometric calculation of soil layers, it gets:
The force and moment equilibrium equation of lay is presented:
The following relations should be satisfied when soil stress-deflection:
Above all kinds of simultaneous, it gets:
where:
Hence, the seismic active earth force (), the total moment at the wall (), the point of application of active thrust from the base of wall () can be calculated as follows:
Effects of soil stress-deflection and seismic loading are considered comprehensively in this formula. Earth pressure is in nonlinear distribution along wall height. If neither seismic load nor stress-deflection is considered, the formula becomes the formula of Rankine earth pressure.
3. Validation
3.1. Comparison with test data and other methods
To verify the rationality of the proposed method, calculated results were compared with the test data in References obtained by sensor networks [20] and results of other calculation methods. The results are listed in Table 1, where is the maximum active earth pressure and is the seismic active earth force. As shown in Table 1, the proposed method obtains the closest results with the test data than other methods. Among the test data, was a mean when 0. The maximum test value of was 557 N, whereas the calculated result of the proposed method was 580 N. Hence, the calculated results of the proposed method best match with test data.
Table 1Comparison with other methods
Test data | Proposed method | Zhou [16] | Mononobe-Okabe | |||||
(kPa) | (N) | (kPa) | (N) | (kPa) | (N) | (kPa) | (N) | |
0 | 1360 | 406 | 1417 | 580 | 1513 | 633 | 2080 | 646 |
0.3 | 2030 | 750 | 1496 | 744 | 2995 | 866 | 3670 | 991 |
Fig. 3The seismic wave’s data and structure calculation model
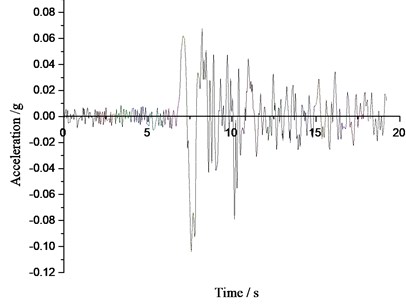
a) Acceleration time-history curve of Tianjin earthquake
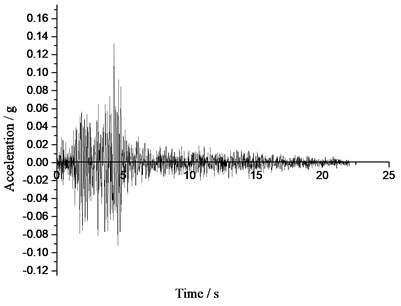
b) Acceleration time-history curve of Tangshan earthquake
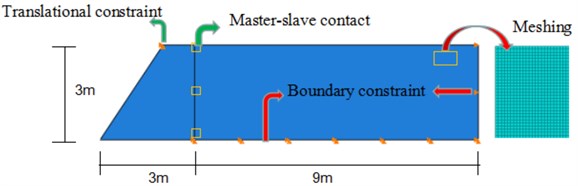
c) The model of structure calculation
3.2. Seismic wave’s data and FEM model
In addition, the proposed method was tested by integrating the ABAQUS finite element software [21-24]. The two-dimensional (2D) plane strain condition is considered. The wall height was 3 m, soil friction angle 30°, unit weight of the backfill soil 17 kN/m3 and the surface load 0. Seismic wave’s data were from the earthquake of Tianjin (NOV.25, 1976, 21:53) and Tangshan (AUG. 31, 1976. 11:25) which were showed in Fig. 3(a), (b). The former peak value was 0.1 g and continued for 19.19 seconds, the latter was 0.132 g and last for 22.02 seconds. Consider the effect of different models of the soil on the results, Mohr-Coulomb plasticity model and Drucker-Prager plasticity model were applied respectively. Master-slave contact was built between the wall and soil mass. Hard contact was adopted in the normal direction and penalty function was used in a tangential direction to simulate different wall-soil friction angles. In addition, the finite element mesh was constituted by CPE4 plane element. Employed in numerical simulation is shown in Fig. 3(c).
3.3. Comparison with FEM’s result
The whole analysis was accomplished in two steps, the dead weight of soil mass was initially added, and then seismic load was applied. The results are shown in Fig. 4, 5. The distribution clouds of active earth pressure of different models and earthquakes behind the retaining wall are shown in Fig. 4. In order to see the distribution of active earth pressure more directly, the active earth pressure behind retaining walls of different models and earthquakes was extracted by setting path, and then compared with calculated results which are shown in Fig. 5.
From the Fig. 5, we can find the active earth pressure behind the retaining wall is in nonlinear distribution easily. Fig. 4, 5 illustrates that no matter what plasticity model is used, the distribution of pressure is in nonlinear. According to Fig. 5 the result of Mohr-Coulomb plasticity model is better than Drucker-Prager. In addition, the parameters in the model of Mohr-Coulomb are less than Drucker-Prager, and the parameters need to be converted in the latter model. To avoid the adverse impact of parameter values on the results, the former plasticity model was adopted in the following discussion.
Fig. 4Stress cloud of soil active earth pressure behind the wall
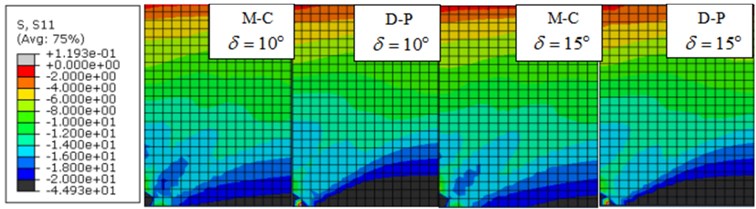
a) Tianjin earthquake
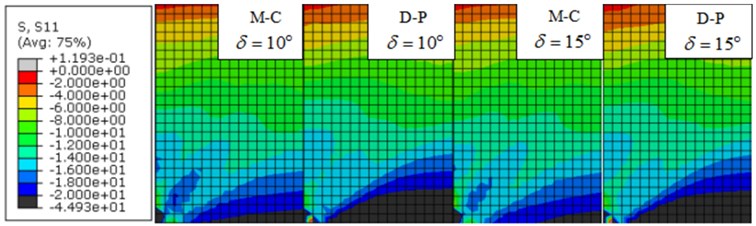
b) Tangshan earthquake
Fig. 5Active earth pressure distribution along the height of the rigid wall
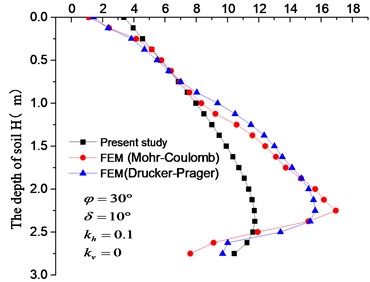
a) Tianjin earthquake
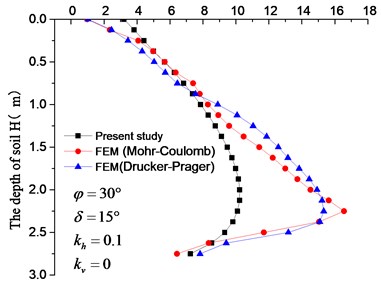
b) Tianjin earthquake
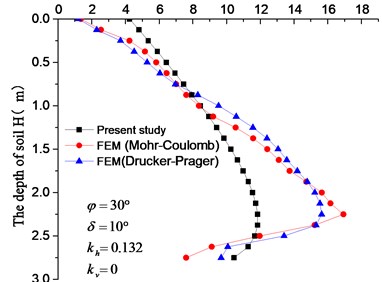
c) Tangshan earthquake
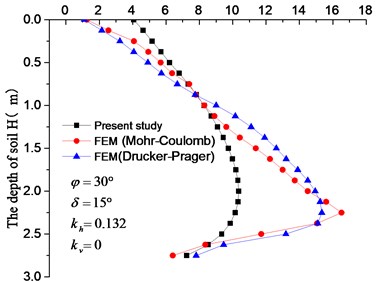
d) Tangshan earthquake
4. Discussion
The influence of each parameter is discussed in this part. Due to the quasi-static method (M-O formula; Zhou [16]; Sharma and Ghosh, et al. [9]) consider the peak value of the earthquake only, and in order to avoid the limitation of a real earthquake which represents a particular place at a particular time, the waveform is not to be considered here. The discussion results are listed as follows.
4.1. Distribution of earthquake-induced active earth pressure
Earth pressure distributions behind the retaining wall with considerations to the combined effect of seismic loading and soil stress-deflection are shown in Figs. 6-11. The retaining wall height was 3 m, soil friction angle 30°, wall-soil interface friction angle 10°, unit weight of the backfill soil 17 kN/m3and the surface load 0. In Fig. 6, earth pressure behind the retaining wall was in a nonlinear distribution under the combined effect of seismic loading and soil stress-deflection. With the increase of horizontal seismic coefficient , the upper active earth pressure soars up, while the lower active earth pressure increases slightly (and even remains same), thus resulting in a quick upper deformation and small lower deformation. This result conforms to the test results of the reference and the finite element simulation stress cloud in Fig. 7.
Fig. 6Effect of kh on active earth pressure distribution along the height of the rigid wall
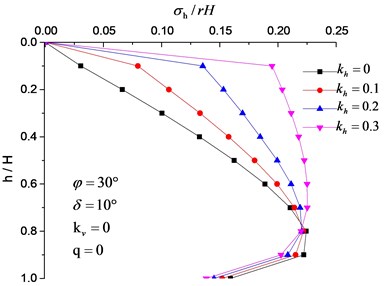
Fig. 7Active earth pressure cloud of different kh
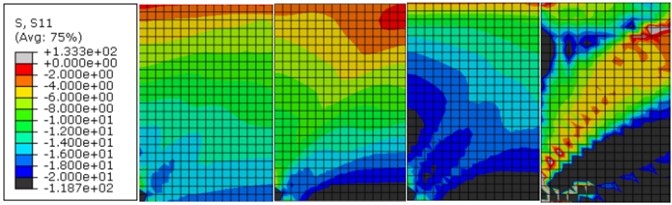
Fig. 8 present that the active earth pressure under seismic loading is negatively correlated with internal friction angle. The active earth pressure distribution cloud under different soil friction angle is shown in Fig. 9. The comparison of the colors of the corresponding nodes and figures concludes that earth pressure gradually decreases with the increase of internal friction angle.
Fig. 8Effect of φ on active earth pressure distribution along the height of the rigid wall
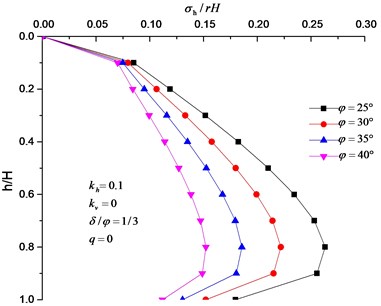
Fig. 9Active earth pressure cloud of different φ
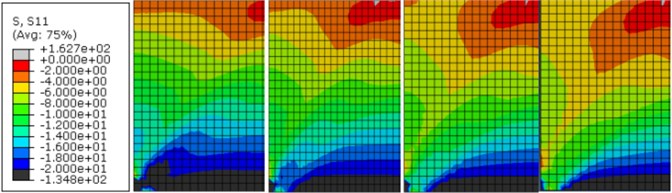
Fig. 10Effect of δ on active earth pressure distribution along the height of the rigid wall
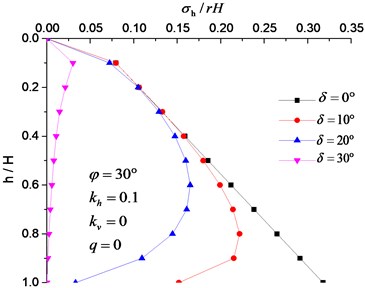
Fig. 11Active earth pressure cloud of different δ
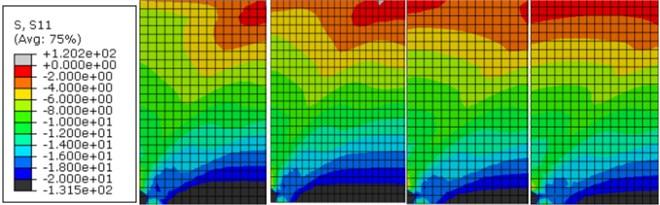
It can be seen from Fig. 10, 11 that the active earth pressure under seismic loading decreases with the increase of . Moreover, the active earth pressure behind the retaining wall has a straight distribution when = 0, which is consistent with the M-O theory. When approaches to , the active earth pressure tends to be 0, which evidently disagree with practical situations and the results presented in Fig. 11(d). This finding also demonstrates that this formula is inapplicable to the situation when approaches to .
4.2. Analysis on influencing factors against the relative height of point of active earth force
For the convenience of comparison with other methods (hereinafter inclusive), relative parameters were set as follows: retaining wall height 1 m, 30°, 15.4 kN/m3, 10° and 0. Fig. 12, 13 demonstrates that the relative height of point of active earth force is positively correlated with , , and . Moreover, Fig. 12 illustrates that the change rate of relative height of point of active earth force decreases from 10.2 % to 4.8 % with the increase of , indicating that effects of on the relative height is weaken with the increase of surface load. Fig. 13 shows that when 0, the relative height point of active earth force is 0.333, which is in accordance with earthquake-induced active earth pressure of MO theory. However, the proposed method considered soil stress-deflection comprehensively, making the result conform to practical situations better.
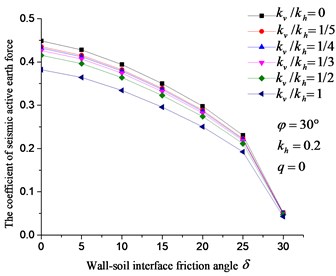
4.3. Analysis on influencing factors of the coefficient of seismic active earth pressure
The concept of earth pressure coefficient in soil mechanics was used. In this work, the earth pressure coefficient was defined as the ratio between seismic active earth force and 1/2 . In Fig. 14, 15, earth pressure coefficient increases with the increase of , but decreases with the increase of , and the vertical seismic coefficient (). Data in Fig. 14, 15 also reflect that the minimum change amplitude of earth pressure coefficient with , , is 28 %, 48 %, 49 % respectively. When increases from 0 to 1, the maximum reduction of earth pressure coefficient is 17 %, implying that is less important to earth pressure coefficient more than other factors.
Fig. 12Effect of φ, q on the relative height of point of active earth force
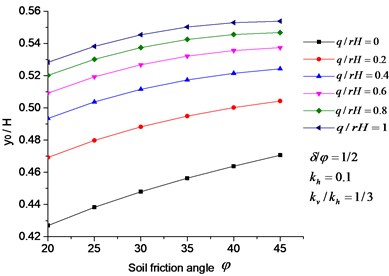
Fig. 13Effect of kh, δ on the relative height of point of active earth force
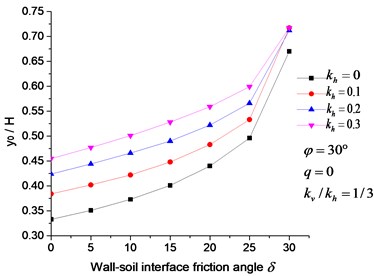
Fig. 14Effect of kh, φ on the coefficient of seismic active earth pressure
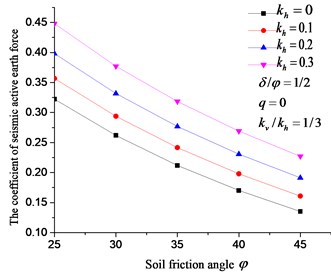
Fig. 15Effect of kv, δ on the coefficient of seismic active earth pressure
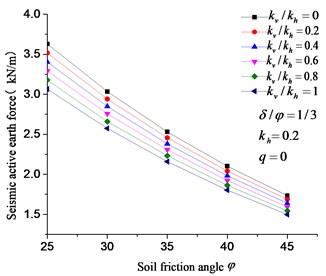
4.4. Analysis on influencing factors of seismic active earth force
As shown in Fig. 16-17, the earthquake-induced seismic active earth force is positively related with , but negatively correlated with , and . Similarly, Fig. 17 shows that is less important to resultant active earth pressure compared with other influencing factors, which slightly influences earth pressure. This finding agrees with the analysis results in Fig. 4.
Fig. 16Effect of kh, δ on the seismic active earth force
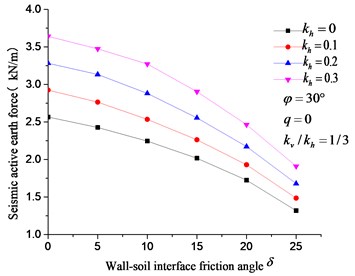
Fig. 17Effect of kv, φ on the seismic active earth force
5. Conclusions
1) Stresses on soil layers of the vertical retaining wall under seismic loading were analyzed by quasi-static method with considerations to soil stress-deflection. The calculation formula of the active seismic angle of rupture which changes in the retaining wall height was deduced, thus obtaining a seismic active earth pressure, seismic active earth force, the total moment at the wall and point of application of active thrust from the base of wall. The calculated results of the proposed method were compared with the test data and finite element simulation results, verifying the high efficiency of the proposed method. In addition, this method can be used to fill different properties.
2) In this study, the effects of , , , , and other factors on height of point of resultant pressure, earth pressure coefficient and earthquake-induced active earth pressure were discussed. The result finds that is less important to earth pressure coefficient compared with other parameters.
3) The calculated results based on the changing seismic angle of rupture agree basically agree with the test data and ABAQUS finite element simulation result, and are closer to the measured values compared with other theories. Therefore, the proposed method is reliable and can provide references for actual engineering.
References
-
Mononobe N., Matsuo H. On the determination of earthquake pressure during earthquakes. Proceedings of World Engineering Congress, Tokyo, Japan, 1929, p. 179-187.
-
Okabe S. General theory of earth pressure. Journal of the Japanese Society of Civil Engineers, Vol. 12, Issue 1, 1926, p. 123-134.
-
Sherif M. A., Fang Y. S. Dynamic earth pressure on walls rotation about top. Soils and Foundations, Vol. 24, Issue 4, 1984, p. 109-117.
-
Ishibashi I., Fang Y. S. Dynamic earth pressures with different wall movement modes. Soils and Foundations, Vol. 27, Issue 4, 1987, p. 11-22.
-
Choudhury D., Singh S. New approach for estimation of static and seismic active earth pressure. Geotechnical and Geological Engineering, Vol. 24, Issue 1, 2006, p. 117-127.
-
Saran S., Gupta R. P. Seismic earth pressures behind retaining walls. Indian Geotechnical Journal, Vol. 33, Issue 3, 2003, p. 195-213.
-
Shukla S. K., Gupta S. K., Sivakugan N. Active earth pressure on retaining wall for c-ψ soil backfill under seismic loading condition. Journal of Geotechnical and Geoenvironmental Engineering, Vol. 135, Issue 5, 2009, p. 690-696.
-
Ghosh P. Seismic active earth pressure behind a non-vertical retaining wall using pseudo-dynamic analysis. Canadian Geotechnical Journal, Vol. 45, Issue 1, 2008, p. 117-123.
-
Sharma R. P., Ghosh S. Pseudostatic seismic active response of retaining wall supporting c-φ backfill. Electronic Journal of Geotechnical Engineering, Vol. 15, 2010, p. 1-14.
-
Lin Y.-L., et al. Seismic active earth pressure of cohesive-frictional soil on retaining wall based on a slice analysis method. Soil Dynamics and Earthquake Engineering, Vol. 70, 2015, p. 133-147.
-
Terzaghi K. Theoretical Soil Mechanics. Wiley, New York, 1943.
-
Handy R. L. The arch in soil arching. Journal of Geotechnical Engineering, Vol. 111, Issue 3, 1985, p. 302-318.
-
Paik K. H., Salgado R. Estimation of active earth pressure against rigid retaining walls considering arching effects. Geotechnique, Vol. 53, Issue 7, 2003, p. 643-653.
-
Rao P. P., Chen Q. S., Zhou Y. T., Nimbalkar S., Chiaro G. Determination of active earth pressure on rigid retaining wall considering arching effect in cohesive backfill soil. International Journal of Geomechanics, Vol. 16, Issue 3, 2015, p. 4015082.
-
Cai Y. Y., Chen Q. S., Zhou Y. T., Nimbalkar S., Yu J. Estimation of passive earth pressure against rigid retaining wall considering arching effect in cohesive backfill under translation mode. International Journal of Geomechanics, Vol. 17, Issue 4, 2016, p. 4016093.
-
Zhou Y. T., Chen F. Q. Seismic active earth pressure for non-vertical rigid retaining wall considering soil arching effect. Chinese Journal of Rock Mechanics and Engineering, Vol. 31, Issue 3, 2015, p. 640-648, (in Chinese).
-
Pain Anindya, Chen Qingsheng, et al. Evaluation of seismic passive earth pressure of inclined rigid retaining wall considering soil arching effect. Soil Dynamics and Earthquake Engineering, Vol. 100, 2017, p. 286-295.
-
Zhu T. H., Zheng S. Z. Model tests of the gravity retaining wall when considering the seismic load. Sichuan Building Science, Vol. 1, Issue 7, 1983, p. 35-37, (in Chinese).
-
Ellis H. B. Use of cycloidal arcs for estimate ditch safety. Journal of the Soil Mechanics and Foundation Division, Vol. 99, 1973, p. 165-179.
-
Wei W., Song H., Li W., et al. Gradient-driven parking navigation using a continuous information potential field based on wireless sensor network. Information Sciences, Vol. 408, 2017, p. 100-114.
-
Cui K., Qin X. Virtual reality research of the dynamic characteristics of soft soil under metro vibration loads based on BP neural networks. Neural Computing and Applications, 2017, https://doi.org/10.1007/s00521-017-2853-7.
-
Cui K., Yang W. Experimental research and finite element analysis on the dynamic characteristics of concrete steel bridges with multi-cracks. Journal of Vibroengineering, Vol. 19, Issue 6, 2017, p. 4198-4209.
-
Yang A., Han Y., Pan Y., et al. Optimum surface roughness prediction for titanium alloy by adopting response surface methodology. Results in Physics, Vol. 7, 2017, p. 1046-1050.
-
Cui K., Zhao T. T. Unsaturated dynamic constitutive model under cyclic loading. Cluster Computing, Vol. 20, Issue 4, 2017, p. 2869-2879.
Cited by
About this article

The authors gratefully acknowledge the financial supports provided by the National Natural Science Foundation of China (51679093, 51774147), the Training Program for Distinguished Young Scholar in Fujian Province University, China, the Program for New Century Excellent Talents in Fujian Province University, China, the Open Research Fund of State Key Laboratory for Geomechanics and Deep Underground Engineering, China University of Mining and Technology, China (SKLGDUEK1701) and the Scientific Research Program for Young and Middle-Aged Teacher of Fujian Provincial Education Department (JAT160554).
The idea in this paper was finished by Yao Liang Zhu, it was written by Jin Yu, data processing was conducted by Jian Feng Zhou, and Bing Xiong Tu, Yan Yan Cai were responsible for translating and polishing this paper.
