Abstract
Creep of the asperities on joint surface will change the stiffness characteristics of joint surface. Based on creep mechanics, a novel creep model of asperities between two rough surfaces is established from a microscopic point of view in this paper. The change of joint stiffness caused by creep of asperities under constant pre-tightening force is analyzed. The results show that the creep of the asperities leads to the increase of the stiffness of the joint surface with the increase of time when the joint force is constant. Moreover, the influence of key parameters of joint surface on creep of asperities is further studied. It is found that the change rate of joint stiffness increases with the increase of initial contact distance and contact area. According to the proposed creep model and the findings in this paper, more accurate stiffness characteristics of joint surface can be achieved for analysis of dynamic and static characteristics of structures with time.
1. Introduction
The creep of the metal causes the change of its stress and strain, thereby changing the characteristics of the structure.
In order to discover creep properties, scholars have conducted extensive research on the creep properties of metallic materials. Maximov et al. [1] used a power-law model to describe the creep properties of metals at room temperature. The combination of experiments and simulations was used to iteratively calculate the coefficients in the model. Then the creep model was optimized and a combined optimization iterative method was proposed. Bouzid et al. [2] carried out a creep relaxation model for flange bolted joints. The stiffness of the various parts in the joint were taken into account. Therefore, the comprehensive stiffness model of bolted joints under different joint forms was obtained. Moreover, the method of reducing the creep of the bolt was quantitatively analyzed and verified by finite element analysis. Sun et al. [3] established the creep model of the flange bolt subjected to bending moment with finite element method. The change of gasket stress with time was analyzed and the sealing performance of flange connection was predicted. Xu et al. [4] studied the relationship between bolt drawing stiffness and creep damage by bolt drawing test and established the corresponding model. Delhomme et al. [5] and Kim et al. [6] studied the creep behavior of anchor bolts in concrete and found the law of prestress loss. Gurinsky et al. [7] studied the creep phenomenon of bolts in viscous soils and analyzed the creep properties by means of experimental tests.
According to the above references, most scholars study the creep properties of the structure from a macroscopic point of view. Therefore, most of the established creep models only consider the macroscopic creep of structures. The existing models rarely study the effect of the creep of the rough surface asperities on joint surface stiffness from a microscopic point of view.
In this paper, the effect of the creep of the asperities on the stiffness of the joint surface is researched from the microscopic point of view. Therefore, a novel creep model of asperities between two rough surfaces is established based on creep mechanics. As the model established from the microscopic point of view, the creep characteristics of the asperities of the joint surface is considered and the more accurate results can be achieved. The variation of the joint stiffness due to the creep of the asperities under the constant preload is analyzed. The influence of key parameters of the joint surface on creep is also studied. This paper is organized as follow. A creep model of asperities between two rough surfaces is established in Section 2. The model is used to study the variation of joint stiffness due to asperities creep under constant preload in Section 3. In Section 4, the influence of the key parameters of the joint surface on the creep of the asperities is studied. Section 5 concludes the paper.
2. Creep modeling of asperities on joint surface
2.1. Creep modeling of single asperity
The asperities are subjected to compressive stress when the joint surface is subjected to the preload force. Therefore, the asperities will generate creep. In order to study creep characteristics of joint surface under preload force, the creep of a single asperity is analyzed in this section.
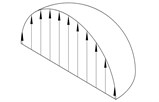
Timoshenko et al. [8] analyzed the stress distribution of the spherical contact. The theoretical derivation proves that the pressure on the contact surface satisfies the hemispherical pressure distribution during the elastic deformation stage. The pressure distribution cross-sectional view is shown in Fig. 1. According to the pressure distribution in Fig. 1, the pressure at the edge of the contact surface is zero. When entering the elastoplastic deformation stage, the plastic deformation occurs first at the center of the contact surface. According to Timoshenko's derivation, the pressure at the edge of the contact surface is still zero.
Fig. 1The pressure distribution cross-sectional view
According to above analysis, the following assumptions are made in the creep modeling of a single asperity: 1) During the creep modeling of the asperity, only the pressure of the corresponding cylinder in the contact surface and its creep are considered [8]. 2) The creep of the asperity does not affect the shape of the asperity, that is, the equivalent curvature radius of the asperity is constant.
The average contact pressure of the -th asperity at the initial moment (i.e. 0) can be obtained according to [9, 10], which is shown as Eq. (1). Then, the strain according to the asperity creep at time t can be achieved based on creep mechanics, i.e. Eq. (2):
where , , p represents the contact load, contact area, and contact surface pressure of the th asperity, respectively, , , are constants associated with the joint surface.
Therefore, the deformation of the th asperity due to creep at time can be obtained as Eq. (3):
where is the distance between the peak of th asperity and lowest horizontal line of the surface roughness profile when 0, is the strain of the th asperity due to creep at time .
2.2. Creep modeling of asperities on two rough surfaces
According to the microscopic contact characteristics of the rough surface, all asperities in contact should satisfy that the distance between the peak of each asperity and the lowest horizontal line of the surface roughness profile is equal to each other at time , as shown in Eq. (4):
where represents the distance between the height average line of the asperity peaks and the lowest horizontal line of the surface roughness profile, represents the deformation of the th asperity at time , including the elastoplastic deformation and the creep deformation , is the distance between the smooth rigid plane and the height average line of the asperity peaks of the rough surface [10], represents the change of the distance between the rigid plane and the height average line of the asperity peaks due to creep at time , and is positive when the distance between the two surfaces is reduced.
Based on Eq. (4), a creep model of the asperities of rough contact surfaces is proposed in this paper, as shown in Eq. (5):
where represents the force of the th asperity at time , represents the total load of the joint at time ; represents the function of calculating the force applied to a single asperity, is the elastoplastic deformation of the asperity, represents the stress of the th asperity at time ; represents the contact area of the th asperity at time .
3. Study on the influence of creep of asperities on joint surface stiffness
The influence of creep of asperities on joint surface stiffness under constant preload is mainly researched in this paper. Therefore, in Eq. (5) is set as a constant, i.e.
Since the stress of the asperity changes with the creep of the structure, Eq. 3 cannot be used directly in Eq. (5). Therefore, Eq. (5) is difficult to solve. In order to deal with this problem, this paper proposes a discrete analysis method that discretizes the continuous time parameter into a finite accumulation of tiny time periods , i.e. . Meanwhile, the stress is considered to remain constant during each tiny time period and the initial stress value in the time period is taken as the stress in this segment. Therefore, Eq. (3) can be used in each segment and Eq. (5) can be calculated to obtain the change of parameters of the rough joint surface in the time period . Furthermore, the curve of the joint surface stiffness with time can also be obtained.
In order to research the influence of creep of asperities on joint surface stiffness specifically, sample 1 in Table 1 [11] is set as the analysis object and the creep model proposed in this paper is used. The number of unilateral asperities is 100, that is, the length of the side is 6.5795e-04 m. The initial distance between the smooth rigid plane and the height average line of the asperity peaks of the rough surface is 0. The creep parameters of typical metal materials are selected according to [5], which is 2.8975e-6, 1.016, 0.02108. The stiffness changes of the sample within 50,000 seconds are calculated for = 0.1 s, 1 s, 60 s and 3600 s, respectively, as shown in Fig. 2.
There are several conclusions according to Fig. 2:
(1) As time increases, the joint stiffness changes significantly at the beginning, and then tends to be flat, which is consistent with Eq. (2). Since the initial stage of creep is very complicated, this paper does not analyze it. This paper mainly considers the situation after entering the steady state.
(2) When the total load is constant, the effect of creep of the asperities leads to the increase of the stiffness of the joint surface with time. This is because the deformation of each asperity tends to be equal with the generation of creep. Specifically, the change rate of the deformation of the contact asperity in is , where is the change amount of the deformation between two rough surfaces in and is the initial deformation. As is a consistent for all the contact asperities, the larger is, the smaller the change rate is. Therefore, as time increases, the deformation of each contact asperity will become closer and closer. In addition, the greater the initial elastic-plastic deformation , the greater the applied force and the greater the creep deformation. As is a consistent for all the contact asperities in , the smaller the increment of elastic-plastic deformation occurs in this time period. Therefore, the elastoplastic deformation and force of each contact asperity tend to average, which results in an increase in the total stiffness of joint surface.
(3) As the unit time increases, the stiffness error in the initial time period becomes larger and larger. The reason is that the resolution gradually decreases with the increase of the unit time . Meanwhile, the joint stiffness changes significantly in the initial time period. Therefore, a large error is generated. In addition, the curve gradually moves up with the increase of the unit time when the stiffness change tends to be stable. Table 2 shows the stiffness values corresponding to the different unit time at 46800 s. According to the error analysis in Table 2, the errors of the calculation results corresponding to 1 s, 60 s and 3600 s compared with which corresponding to 0.1 s are small. Therefore, in order to comprehensively consider calculation time and analysis accuracy, 60 s is selected as the unit time in the initial stage to ensure the analysis accuracy while 3600 s is selected as the unit time in the stable stage to improve calculate efficiency.
Fig. 2Curve of joint stiffness with time under different unit time ∆t
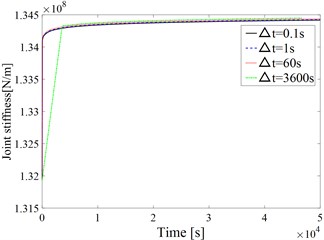
Fig. 3Joint stiffness dimension curve for different initial contact surface distances
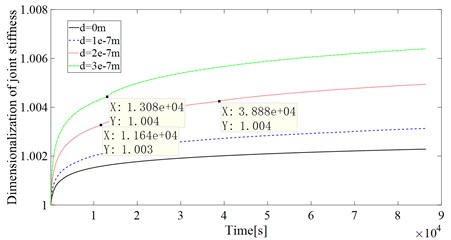
Table 1Typical rough surface parameters
Sample number | Mean asperity height [μm] | S.D. of surface height [μm] | S.D. of peak height [μm] | Asperity radius [μm] | Asperity density [1/μm2] |
1 | 0.123952 | 0.158242 | 0.139192 | 16.8148 | 2.3094e-2 |
Table 2The stiffness value corresponding to different unit time ∆t at t= 46800s
Unit time [s] | Stiffness [N/m] | Calculate error compared with 0.1 s |
0.1 | 1.3441e8 | – |
1 | 1.3442e8 | 0.01 % |
60 | 1.3443e8 | 0.01 % |
3600 | 1.3445e8 | 0.03 % |
4. Effect of joint surface parameters on creep of joint surface
The contact area of the joint surface and the distance between the two contact surfaces have an effect on the joint stiffness. Therefore, the influence of the contact area and the contact distance on the time-varying characteristics of the joint surface stiffness is further analyzed in this section.
Since this paper mainly considers the situation after entering the steady state, the analysis time starts from 120 s. The curve of joint surface stiffness with time at different initial contact surface distances in one day is calculated and analyzed. Due to the difference in joint stiffness between different initial contact surface distances, the stiffness is dimensioned for a more intuitive comparison. The stiffness value at each moment is divided by the stiffness value at 120 s. The resulting curve is shown as Fig. 3. It can be seen from Fig. 3 that the tendency of the joint surface stiffness increases gradually as the initial contact distance increases.
Fig. 4Variations of the numbers of contact asperities over time with different initial contact surface distances: a) d=0m; b) d=1e-7m; c) d=2e-7m; d) d=3e-7m
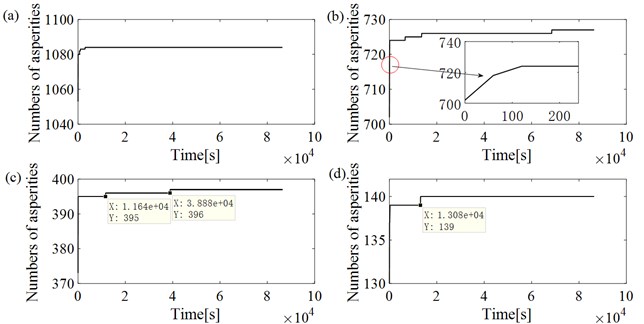
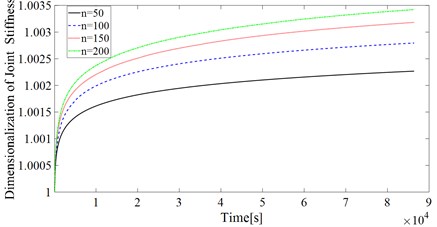
Fig. 5Joint stiffness dimension curve for different contact areas (n: the single-sided asperity number)
Further analysis of the reasons for the change of the joint stiffness in Fig. 3 is carried out. It can be seen that the change tendency of the joint stiffness changes when the number of contact asperities changes according to Fig. 4. The curves corresponding to the initial contact surface distance and clearly reflect this phenomenon. The numbers of contact asperities increase when the time is , and , respectively, resulting in an increase in the change rate of joint stiffness. The phenomenon also exits in the curves corresponding to 0 m and , where 0 m represents the distance between the smooth rigid plane and the height average line of the asperity peaks of the rough surface is 0 m. However, there are many contact asperities in the initial state. Therefore, the influence of the asperity increment on the curves is small.
In addition to the distance between the two contact faces, the contact area is also one of the important factors affecting the joint stiffness. Therefore, the influence of the contact area on the joint stiffness is also researched in this paper. The distance between the two contact surfaces is set as 0 m. Square contact surfaces with single-sided asperity numbers 50, 100, 150 and 200 are analyzed. The results are shown as Fig. 5.
According to Fig. 5, the change rate of the joint stiffness increases as the contact area of the joint surface increases.
5. Conclusions
1) The creep model of a single asperity is first established and then used in creep modeling of asperities between two rough surfaces in this paper. Moreover, the geometric constraint relationship between asperities is considered during modeling. Therefore, a creep model of asperities between two rough surfaces is proposed in this paper, based on creep mechanics.
2) The time-varying characteristics of the stiffness of a typical rough surface joint are analyzed using the proposed creep model. A discrete analysis method is applied to calculate the proposed creep model. By studying the influence of different unit time values on the calculation results, suitable unit time is obtained. According to the results, the stiffness of the joint surface increases with time due to the creep of the asperities when the total load is constant. Moreover, the influence of the contact area of the joint surface and the distance between the two contact surfaces on the time-varying characteristics of the joint surface stiffness is also studied.
According to the creep model proposed in this paper, the time-varying characteristics of the stiffness of a typical rough surface joint can be achieved for more precise joint modeling. Therefore, the dynamic and static characteristics of the structure with time can be calculated more accurately.
References
-
Maximov J. T., Duncheva G. V., Anchev A. P. An approach to modeling time-dependent creep and residual stress relaxation around cold worked holes in aluminium alloys at room temperature. Engineering Failure Analysis, Vol. 45, 2014, p. 1-14.
-
Bouzid A. H., Nechache A. The modelling of bolted flange joints used with disc springs and tube spacers to reduce relaxation. International Journal of Pressure Vessels and Piping, Vol. 87, Issue 12, 2010, p. 730-736.
-
Sun Z., Gu B. Effect of external bending moment and creep on sealing behavior of bolted flanged connections. 2009 International Conference on Measuring Technology and Mechatronics Automation, Vol. 3, 2009, p. 75-78.
-
Xu H., Wang F., Cheng X. Pullout creep properties of grouted soil anchors. Journal of Central South University of Technology, Vol. 14, 2007, p. 474-477.
-
Delhomme F., Debicki G. Numerical modelling of anchor bolts under pullout and relaxation tests. Construction and Building Materials, Vol. 24, Issue 7, 2010, p. 1232-1238.
-
Kim N. Performance of tension and compression anchors in weathered soil. Journal of Geotechnical and Geoenvironmental Engineering, Vol. 129, Issue 12, 2003, p. 1138-1150.
-
Gurinsky M. A. Long-term strength of prestressed ground anchors in creep-sensitive soils. ASEC Geotechnical Special Publication, Vol. 116, Issue 1, 2002, p. 37-52.
-
Timoshenko S., Goodier J. N. Theory of Elasticity. Translated by Xu Zhilun. Higher Education Press, Beijing, China, 1990, p. 481-489.
-
Zhao Y., Lu Y., et al. New elastic-plastic model for the contact of rough surfaces. Chinese Journal of Mechanical Engineering, Vol. 43, Issue 3, 2007, p. 95-101.
-
Li L., Cai A., Cai L., et al. Micro-contact Model of Bolted-joint Interface. Chinese Journal of Mechanical Engineering, Vol. 52, Issue 7, 2016, p. 205-212.
-
Nuri Ka, Halling J. The normal approach between rough flat surfaces in contact. Wear, Vol. 32, Issue 1, 1975, p. 81-93.
About this article

The work was supported by 2017 Science and Technology Support Plan of Nanjing Jiangsu China (Grant No. 201701213) and 2018 Science and Technology Support Plan of Yunnan China (Grant No. 2018IC30).
