Abstract
The paper presents a study regarding the effect of the friction coefficient on the behavior of structures isolated by friction pendulums. A laboratory-scale structure and its model created in SolidWorks are employed in the research. The excitation, ensured by a shaking table, follows a displacement after sinusoidal and complex rules. The study revealed the frequency at which the chosen friction pendulum assures efficient isolation is higher then 3 Hz irrespective to the friction coefficient. Experimental results coincide with those obtained from simulations.
1. Introduction
Earthquakes occur along the fractures of the Earth’s crust when there is relative movement between the rocks along a fault. Shaking the resulting soil can affect large areas around the epicenter, causing material damage and loss of human lives. From this point of view, Romania presents a high risk due to the characteristic seismic activity originating from the Vrancea source. The first Romanian strong ground motion, which was recorded in Bucharest during the destructive 1977 earthquake, attracted attention due to its characteristics [1]. The review of the record of this earthquake firstly leaded to the impression that something must be wrong because the accelerogram is so different from those of other destructive earthquakes. Despite, the inspected instruments were properly installed and maintained and no reason to doubt the record was found [2]. The record is characterized by a single strong pulse with a period of about 1.4 seconds and a magnitude that exceeds that of the 1940 El Centro earthquake, which was a long time a point of reference for strong ground motion [3]. This shows that strong ground motions can differ considerably from those adopted for design of earthquake-protected structures on the basis of recordings taken from the West Coast of the US [4].
A solution to reduce the effect of ground motion is the insertion of elastomeric elements between the soil and the protected structure. These devices, largely presented in the literature are the natural rubber [5-7], lead rubber [8] or hybrid lead rubber bearings [9, 10]. Models of such devices can be found in [11, 12]. Another class of seismic isolation devices is the friction pendulum (FP), a concept firstly introduced by EPS in 1985. Since then, the devices were constantly improved and offer nowadays several types of advanced FP bearings that optimize seismic performance with reduced construction costs. Among advanced solutions, we can mention the double and triple friction pendulum [13, 14].
The characteristics of the earthquakes in Romania qualify the FPs for use in seismic isolation because these permit large displacements. We present in following a numerical study regarding the behavior of a multi-storey building isolated with FPs exposed to a ground movement similar to that recorded during the devastating earthquake in Bucharest in the year 1977. In previous studies [15] we deduced mathematical relations between the forces, displacements and accelerations acting on structures isolated with FPs. These findings along with the information about the mentioned earthquakes time-history are used to model the structure. The main goal was to identify the static and dynamic friction coefficients ensuring the best isolation of the structure against ground tremors.
2. Materials and methods
2.1. Description of the experimental stand
The experiments were performed on a shaking table developed in the Laboratory for the study of seismic actions of the Eftimie Murgu University of Resita. The dimensions of the shaking plate are 600×300 mm. During operation, it performs a linear reversible displacement with magnitude 5 mm. The actuation system consists in an electrical engine and two linear rolling bearings positioned on both sides of the table. The rotation of the electric engine is transformed in translation motion with a crank mechanism. Engine speed and the frequency of the shaking plate are ordered by the automatic control system. Calibration is necessary to have the correct relations between the electrical tension, the engine’s rotational speed and the sliding plate frequency. The process of calibration is described in [16].
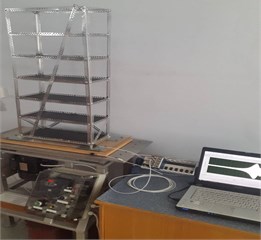
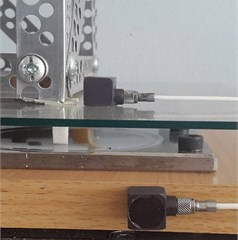
Fig. 1The excitement and measurement systems
a)
b)
c)
The engine and the automation system are visible at the bottom-left side of Fig. 1(a). The shaking plate is the mounted on the frame having intermediately positioned the linear bearings. A rigid 6-storey structure was employed in the study. It is 1200 mm high, 400 mm large and 200 mm width and is made of steel profiles with an L-shaped section 20×20 mm. The base isolation system, detailed in Fig. 1(b), (c), consists of four spherical FPs made of polished stainless steel and four pivots made of Teflon. The spherical sliding surface has the radius 260 mm. An almost punctual contact is ensured between the sliding surface and the pivot, in order to maintain the structure in vertical position during the tests.
The accelerations are measured in two points, on the shaking plate and on the structure. The acquisition system contains two Kistler accelerometers 8772A10T, a NI cDAQ-9172 chassis, a NI 9234 module and a laptop on which LabVIEW is installed.
2.2. Implementing the model in the motion module of SolidWorks
The laboratory-scale structure was implemented in the Motion module of SolidWorks. Because unidirectional displacement in direction is considered in this study, for simplicity, instead of the real spherical devices, cylindrical friction pendulums with the same radius are employed in the model.
Fig. 2The 3D model of the test structure implemented in SolidWorks
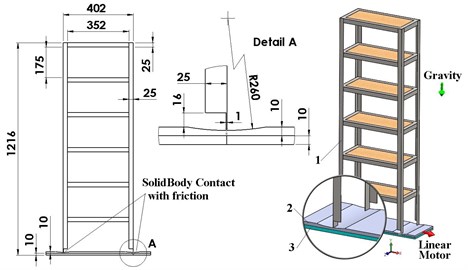
The test structure is an assembly with three parts: 1 – the base plate 600×200×10 mm, 2 – the shaking plate 600×200×10 mm and 3 – the structure 1200×400×200 mm, shown in Fig. 2. The base plate is fixed. The shaking plate is moved on the direction with a Linear Motor that imposes displacement with parameters described in the next section. A SolidBody Contact with friction is imposed between the bottoms side of the structure and cylindrical surface of the pendulums. The gravitational force oriented on direction is imposed for a 9806.65 mm/s2 value of the gravitational acceleration.
2.3. Defining the test methodology
In first attempts, the response of the FP to harmonic excitation is analyzed. Thus, we selected the frequencies of the ground displacement to: 0.75; 1; 1.5; 2; 2.5; 3; 3.5; 4.5 and 6 Hz. The amplitude of the displacement imposed to the shaking plate is 5 mm. The cases for the contact between the structure and the shaking plate are presented in Table 1. Contacts 1 to 3 are predefined by the software, while case 4 is customized by setting the dynamic and static friction coefficients and , respectively the dynamic and static velocity coefficient and . One can observe that for case 2 and case 3 the software takes similar friction coefficients, hence these two similar cases will be treated as a single case. The time of analysis is 10 seconds.
Table 1Contact condition based on friction coefficients
Components | Contact case 1 | Contact case 2 | ||
Structure | Steel (dry) | 0.25; 10.16 mm/s2 0.3; 0.1 mm/s2 | Steel (greasy) | 0.05; 10.16 mm/s2 0.08; 0.1 mm/s2 |
Shaking plate | Steel (dry) | Steel (greasy) | ||
Contact case 3 | Contact case 4 | |||
Structure | Acrylic | 0.05; 10.16 mm/s2 0.08; 0. 1 mm/s2 | Custom material | 0.03; 10.16 mm/s2 |
Shaking plate | Steel (greasy) | 0.05; 0.1 mm/s2 | ||
Next, the particularity of the earthquakes with high magnitude produced by Vrancea source is considered. In Bucharest, a large predominant period in the range 1.3-1.7 seconds was found, resulting ground oscillations in the range 0.59-0.79 Hz. The INCERC record of the 1977 Vrancea earthquake clearly shows the predominant period around second 15 of the registration [1]. This accelerogram was taken as a reference for the simulated excitation signal, thus the frequency of 0.75 Hz is used to simulate the ground shaking. For simplicity, just this spectral component will be considered in the experiments.
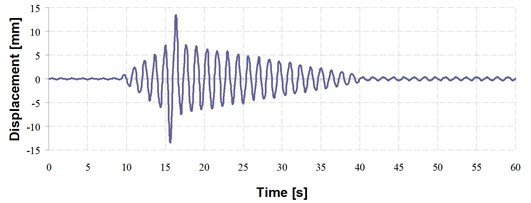
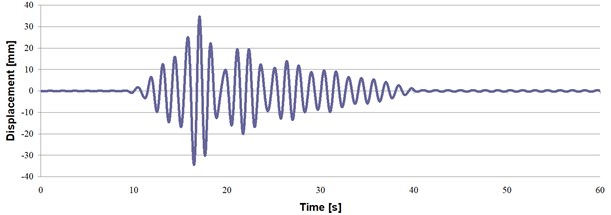
The shaking plate displacement follows the evolution scheme presented in Fig. 3. In the first 9 seconds, a normal seismic activity is simulated. In the next 5 seconds, which correspond to approximately 4 cycles of oscillation, the amplitude of the displacement continuously increases to 6 mm. Then, for one cycle of 1.33 seconds, a sudden amplitude increases to almost 14 mm is simulated. Finally, the amplitude of the sinusoidal signal slowly decreases, but small amplitude is imposed even after 45 seconds. The time of analysis is set to 60 seconds.
Fig. 3Displacement evolution imposed to the shaking plate
3. Results and discussions
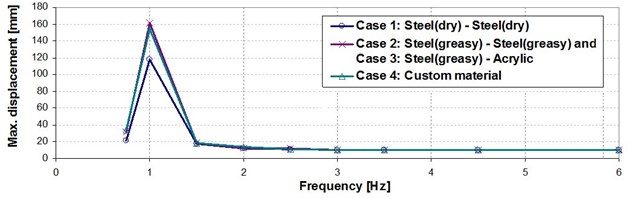
The simulations results in terms of maximum displacements in the direction (that of the excitation) are found and summarized in figure 4. The FP has the isolation period , in our case it being 1.0231 s. This determines the occurrence of resonance for excitation frequencies close to 0.9774 Hz, the largest displacement resulting for these excitations, as it can be seen in Fig. 4. If the excitation is in the range of 1-3 Hz, the displacement exceeds the amplitude of the excitation, while for an excitation frequencies bigger than 3 Hz the maximum achieved displacement does not change and takes the value of the excitation amplitude.
Fig. 4Maximum displacement in X direction achieved between the shaking plate and the fixed support
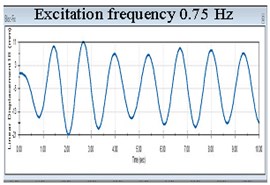
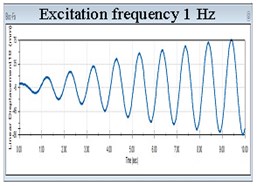
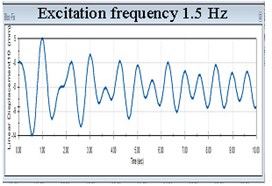
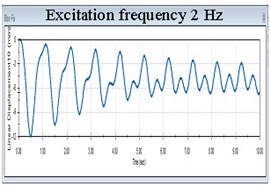
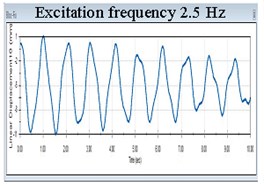
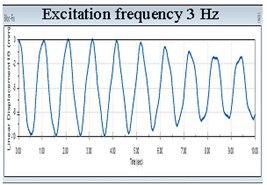
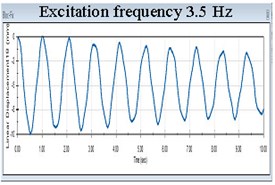
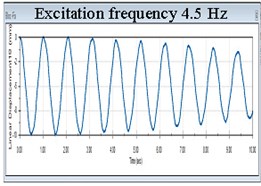
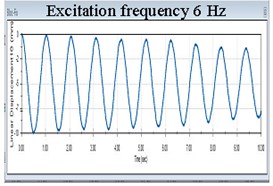
Another remarkable conclusion refers to the response amplitudes. Until the excitation achieves 1 the frequency of the isolated structure takes the value of the excitation, see the first diagram in Fig. 5. For excitation in the range 1-3 Hz, the response signal has two components among which one is 0.9774 Hz. This can be observed in the next five diagrams in Fig 5. Once the excitation frequency exceeds 3 Hz, the frequency remains always 0.9774 Hz and the amplitudes of the isolated structure remain unchanged, see the last three diagrams in Fig. 5. Because both the displacement and the frequency of the isolated structure remain unchanged irrespective to the value of the excitation frequency exceeding 3 Hz, it clearly results that the acceleration do not change. Hence, the force acting on the structure does not increase if the ground acceleration increases. This shows that the FP works optimal for these conditions, but ensures an acceptable level of isolation in the range 1-3 Hz.
An additional advantage is that for 3 Hz the structure’s amplitudes decrease in time, consequently the forces are supplementary diminished.
Fig. 5Evolution of the displacement in X direction of the structure isolated with FPs having acrylic pivots and stainless steel sliding surfaces for nine frequency excitations
a)
b)
c)
d)
e)
f)
g)
h)
i)
The isolated structure’s response to the displacement described in Fig. 3 is given in Fig. 6. The frequency is similar to that of the excitation, while the displacement is double. This shows that the FP is not efficient for an excitation with variable amplitude and a frequency of 0.75 Hz.
Fig. 6Evolution of the displacement in X direction for the isolated structure
Comparison of results for several accelerations achieved from measurements and simulation is made in Table 2. One can observe that the acceleration for 1 Hz excitation is lower in the experiment because the friction coefficient is probably higher in the real case. For the other excitations the results are in better agreement and the FP proves its utility.
Table 2Displacement in X direction of the isolated structure – contact case 3
Frequency | 1 Hz | 2 Hz | 3 Hz | 4.5 Hz | 6 Hz |
Acceleration – measured [mm/s2] | 897 | 102.7 | 73.1 | 69.2 | 64.1 |
Acceleration – simulated [mm/s2] | 1011.593 | 75.39822 | 62.83185 | 62.83185 | 62.83185 |
4. Conclusions
The study revealed that the friction coefficient has a relevant influence for excitation periods close to (i.e. for frequencies near ); the higher the friction coefficient, the lower the achieved amplitude is. If increasing the oscillation frequency, the effect of the friction coefficient decreases. A proper isolation is achieved for for all the four contact cases.
It was also found that the frequencies of the isolated structure follow the frequencies of the excitation until the excitation exceeds . For higher excitation frequencies, the isolated structure maintains the frequency . By increasing the amplitudes decrease, for the amplitudes equaling the amplitudes of the excitation. Because the frequencies of the structure do not increase, remaining , result that for higher frequencies the FP is highly efficient. Knowing that depends on just on the friction pendulum radius , the latter can be calculated to result a much smaller then the earthquakes dominant frequency.
References
-
Aldea A., Neagu C., Udrea A. Site response assessment using ambient vibrations and borehole-seismic records. 15th World Conference on Earthquake Engineering, Lisbon, Portugal, 2012, p. 6086-6096.
-
Berg G., Bolt B., Sozen M., Rojahn Ch. Earthquake in Romania. March 4, 1977. An Engineering Report, National Research Council and Earthquake Engineering Research Institute, National Academy Press, Washington, D.C., 1980, p. 39.
-
Fattal G., Simiu E., Culver Ch. Observation on the behavior of buildings in the Romanian earthquake of March 4, 1977. NBS Special Publication 490, U.S. Department of Commerce, 1977, p. 160.
-
Ambraseys N. N. Long-period effects in the Romanian earthquake of March 1977. Nature, Vol. 268, 1977, p. 324-325.
-
Kelly J. M. Earthquake-Resistant Design with Rubber. 2nd Edition, Springer-Verlag, London, 1997.
-
Haque M. N., Bhuiyan A. R., Alam M. J. Seismic response analysis of base isolated highway bridge: effectiveness of using laminated rubber bearings. IABSE-JSCE Joint Conference on Advances in Bridge Engineering-II, Dhaka, Bangladesh, 2010.
-
Skinner R. I., Robinson W. H., Mcverry G. H. An Introduction to Seismic Isolation. John Wiley and Sons, London, 1993.
-
Hameed A., Koo M.-S., Do T. D., Jeong J.-H. Effect of lead rubber bearing characteristics on the response of seismic-isolated bridges. KSCE Journal of Civil Engineering, Vol. 12, 2008, p. 187-196.
-
Tanaka K., Hirasawa M., Ishiguro Y., Ohyama H., Nakamura Y. Base-Isolation System with Hybrid Lead Rubber Bearings. SMiRT 12, K25/5, 1993, p. 381.
-
Iancu V., Vasile O., Gillich G. R. Modelling and characterization of hybrid rubber-based earthquake isolation systems. Materiale Plastice, Vol. 49, Issue 4, 2012, p. 237-241.
-
Iancu V., Gillich G. R., Iavornic C. M., Gillich N. Some models of elastomeric seismic isolation devices. Applied Mechanics and Materials, Vol. 430, 2013, p. 356-361.
-
Gillich G. R., Bratu P., Frunzaverde D., Amariei D., Iancu V. Identifying mechanical characteristics of materials with non-linear behavior using statistical methods. Proceedings of the 4th WSEAS International Conference on Computer Engineering and Applications, Harvard, USA, 2010, p. 96-103.
-
Constantinou M. C. Behavior of the double concave Friction Pendulum bearing. Earthquake engineering and Structural dynamics, Vol. 35, Issue 11, 2006, p. 1403-1424.
-
Fenz D. M., Constantinou M. C. Spherical sliding isolation bearings with adaptive behavior: experimental verification. Earthquake Engineering and Structural Dynamics, Vol. 37, Issue 2, 2015, p. 2008-185.
-
Jurcau C. S., Gillich G. R., Iancu Amariei V. D. Evaluation and control of forces acting on isolated friction pendulum. The 3rd WSEAS International Conference, Corfu Island, Greece, 2010, p. 220-225.
-
Iancu V., Galuska I., Mănescu T. Shaking table for the analysis of pillars with top mass. The 14th International Symposium Acoustics and Vibrations of Mechanical Structures Timisoara, Romania, Springer Proceedings in Physics SPPHY, Vol. 198, 2017, p. 405-410.
About this article

