Abstract
Dynamic visual cryptography (DVC) is a technique for the encryption and decryption of visual secret information. The confidential visual information in DVC is concealed embedding the secret image into the regular moiré grating. The secret can be perceived from the cover image if only the cover image is oscillated according to a predefined law of motion and time-averaging techniques are used. The security of the encryption procedure and the quality of the decrypted image depend on the proper preselection of the pitches of a moiré grating used in the encryption stage. This paper presents the main principles of the determination of near-optimal pair of the pitches of moiré grating as well as graphical schemes and analytical equations in case of harmonic and chaotic oscillations.
1. Introduction
Visual cryptography (VC) is a technique which allows to encrypt visual information in a way that decryption becomes a mechanical operation that requires neither cryptography knowledge nor complex computations. It uses only the human vision to decrypt the secret. The main idea of this cryptographic technique is to divide the original image into the set of semi-transparent shares. It is not possible to leak the secret information from each share individually, but if all the shares are superposed at the right angle and at the right position, a secret information is decrypted [1, 2]. A great progress has been made in VC since 1994, when this encryption technique was first presented by Moni Naor and Adi Shamir [1]. Methods for visual cryptography of greylevel and color images based on initial studies of black-and-white visual cryptography, the halftone technology, and the color decomposition method were introduced in [3]. Probabilistic models of VC for greyscale images and color images were reported in [4]. In 2007 Shyong Jian Shyu with coauthors proposed a visual secret sharing scheme that encodes a set of not less than two secrets into two circle shares, such that none of any single share leaks the secrets and all the secrets can be obtained by overlaying the first share and the rotated second share [5]. In 2013, Hsiao-Ching Lin et al. presented a letter-based visual cryptography scheme (LVCS) where natural language letters are used to represent pixels of secret images to construct meaningful shadow images and implemented the scheme in different programming languages [6]. Furthermore, various aspects of the security of VC schemes were discussed in [7-9].
Dynamic visual cryptography (DVC) was first mentioned in [10]. The main idea of image hiding in DVC is not based on the superposition of the set of shares like in VC. On the contrary – DVC is based on a single encoded share, which should be oscillated in time in order to decrypt the hidden message. In DVC, the hidden information is perceived from time-averaged image in a form of a pattern of time-averaged moiré fringes if harmonic oscillations are considered. In case of chaotic motion, pattern of time-averaged fringes does not form but secret information can still be leaked due to the different levels of blur in the time-averaged secret and time-averaged background regions. Furthermore, the amplitude of harmonic oscillations and variation of chaotic oscillations must be the same as were used for the encoding in order to decrypt the hidden information.
The level of the security of the encryption and the sharpness of the decrypted information mostly depends on the pitches of a moiré grating in case of both harmonic and chaotic motion. The difference between pitches of the grating representing the area of the concealed information and pitches representing the background should be sufficiently small – otherwise, one can observe the secret by a naked eye even in a static share. Simultaneously, these pitches should differ significantly; otherwise, it will not be possible to obtain the sufficient contrast between the area of the background and the area of the concealed information in the time-averaged image.
The main aim of this investigation is to propose the scheme for the determination of near-optimal pitches of the moiré grating in case of harmonic and chaotic oscillations, providing the highest possible contrast of the decoded secret message.
2. Optical background
One-dimensional harmonic moiré grating can be expressed as a harmonic function [11, 12]:
where is the coordinate, is the pitch of the moiré grating. The numerical value 0 of function corresponds to black color, 1 – to white color, all intermediate values from the interval (0; 1) correspond to the intermediate greyscale levels.
2.1. Harmonic oscillations
Let’s consider that the harmonic moiré grating is formed on the surface of one-dimensional non-deformable body, which oscillates around the state of equilibrium according to a harmonic time function , where is the amplitude of harmonic oscillation, is the angular frequency and is the phase. Intensity of the greyscale color of the oscillating moiré image at time moment at coordinate reads [12]:
Application of time-averaging techniques results in time-averaged moiré image. The greyscale intensity of the time-averaged moiré image at coordinate can be expressed as [12, 13]:
where is the exposure time, is the zero order Bessel function of the first kind. It is clear that oscillation frequency and phase have no effect on the time-averaged image in Eq. (3) [12, 13]. Note, that time-averaged fringes are observed at such coordinate , where time-averaged image becomes uniformly grey. Such effect occurs at the roots of :
where is the th root of the zero order Bessel function of the first kind.
Standard deviation of the greyscale intensity in Eq. (3) reads [14]:
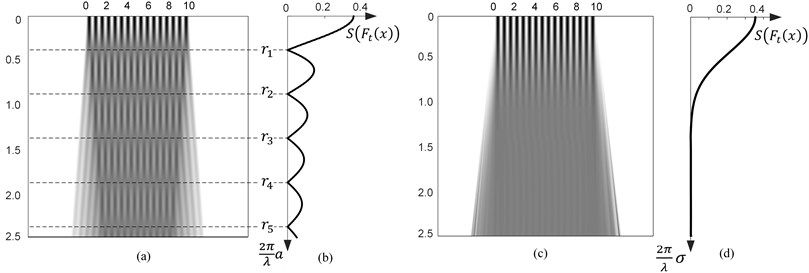
A set of one-dimensional time-averaged moiré images at increasing amplitudes is shown in Fig. 1(a). Note, that the centers of time-averaged fringes are located at amplitudes , 1, 2,.... Standard deviation of the time-averaged greyscale color intensity from 0.5 at amplitudes a is proposed in Fig. 1(b).
Note that the standard deviation vanishes at such amplitudes , where the greyscale intensity is equal to 0.5 or, in other words, at the centers of the time-averaged fringes. Sufficiently high values of the standard deviation correspond to clear structure of the moiré grating lines.
2.2. Chaotic oscillations
If one-dimensional moiré grating oscillates in time according to a chaotic function , then greyscale intensity of time-averaged moiré grating reads [15]:
where is a chaotic function representing the deflections from the steady state. Let us suppose that is a Gaussian normal ergodic process, which is represented by a series of zero-mean Gaussian random numbers. If the standard deviation of this series is equal to , the greyscale intensity in time-averaged image at point can be calculated according to [15]:
It is known that the pattern of time-averaged fringes does not form, if Gaussian oscillations are considered [15]. One-dimensional image of time-averaged moiré at increasing standard deviations of Normal distribution is shown in Fig. 1(c). Higher values of correspond to more intensive blur in time-averaged image. The structure of the grating lines is clearly visible if value of is close to zero.
Fig. 1Time-averaging of one-dimensional moiré grating (at λ=0.625): a) time-averaged one-dimensional moiré gratings in case of harmonic oscillations at increasing a; b) standard deviation of greyscale color from 0.5 in one-dimensional moiré images in part a); c) time-averaged moiré in case of Gaussian oscillations at increasing σ; d) standard deviation of greyscale color from 0.5 in time-averaged moiré in part c)
The standard deviation of time-averaged image in Eq. (7) reads [14]:
Fig. 1(d) illustrates that larger values of standard deviation of Normal distribution correspond to smaller standard deviations of greyscale intensity in time-averaged moiré image.
3. Encoding and decoding in DVC
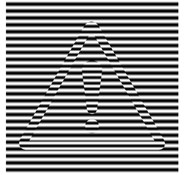
DVC is a technique for the encoding and decoding of the visual secret information. The encoding procedure requires computational techniques and algorithms while the decoding is completely visual. Optical registration of time-averaged images can be implemented by means of time-averaged photography or a naked eye. Let us suppose a dichotomous secret information shown in Fig. 2(a); the encoding of this image is illustrated in parts (b), (c) and (d) of Fig. 2. At first secret image is straightforwardly embedded into the stationary moiré grating– one pitch of the moiré grating is preselected for the area of the encrypted information and slightly different – for the background (part (b)). Such encoding is not safe – contours of the secret information are clearly visible in part (b) of Fig. 2. Therefore, we recalculate phases on the edges between secret information and the background in order to avoid discontinuities (part (c)) and additionally use random scrambling of the initial phases, which conceals the secret completely. It is not possible to perceive the concealed visual information from the encrypted image (Fig. 2(d)).
Fig. 2Encoding procedure in DVC: a) secret image; b) secret image is straightforwardly embedded into stationary moiré grating at λs=0.33,λb=0.40; c) encoded secret image after phase regularization; d) random scrambling of the initial phases completely hides the secret

a)
b)
c)
d)
The secret image can be decoded from the time-averaged encrypted image, if only this cover image oscillates according to a preselected law of oscillations with the predefined parameters (we consider only harmonic or chaotic oscillations in this research). In case of harmonic oscillations, secret message is decrypted as a pattern of time-averaged fringes and can be perceived due to the different standard deviations in the areas of the encrypted information and the background. In case of chaotic oscillations, the pattern of time-averaged fringes is not produced [15] but the secret can still be perceived due to the contrast between the time-averaged secret and the time-averaged background areas. In this study, we evaluate the contrast as the difference between the standard deviation in the time-averaged secret area and the standard deviation in the time-averaged background. Let us suppose that the contrast is sufficient if , where is the minimal interpretable contrast in the time-averaged image. If parameters of the oscillation are fixed before the experiment, the difference depends only on and .
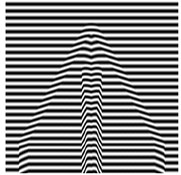
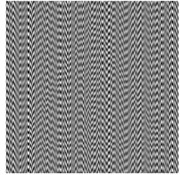
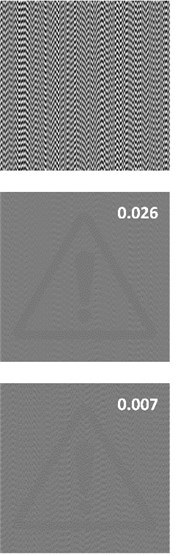
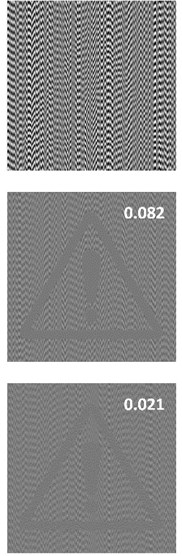
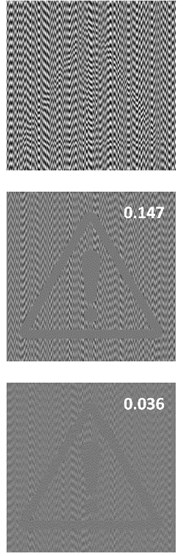
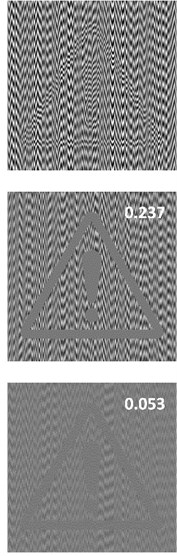
Fig. 3 provides the decoding results in case of chaotic and harmonic oscillations at different pairs of pitches of the moiré grating. The encoded images are shown at the top row, the decoded images in case of harmonic oscillations – at the middle row, and in case of chaotic oscillations – at the bottom row. Pitch of the grating in the secret area is preselected to 0.33. Pitch of the background is different in every column of this figure: (a) (b) (c) , (d) . Amplitude of harmonic oscillations is equal to 0.126 and standard deviation of Gaussian oscillations is equal to 0.036 in all parts of Fig. 3. The smaller is the difference between and , the worse is the contrast in time-averaged image (part (a) in Fig. 3). And on the contrary – the larger is the difference between and , the better is the contrast. Unfortunately, very large difference between and compromises the encoding scheme – the hidden secret can be perceived simply by a naked eye even from the stationary encoded image (part (d) in Fig. 3).
Therefore, it is essential to determine how pitches of the moiré gratings should be preselected in order to ensure the safe encoding and to obtain the high-enough contrast between the region of the hidden information and the rest of the area in the decoded image.
Fig. 3Encryption and decryption of the secret information at λs=0.33: the encoded images (top row), the decoded images in case of harmonic oscillations (middle row) and in case of chaotic oscillations (bottom row). Pitch of the background λb differs in every column of the figure: a) λb=0.35; b) λb= 0.4; c) λb= 0.475; d) λb=0.66. Numerical estimates of the contrast σs- σb between the time-averaged secret and background areas are presented at the top-right corner of each decoded image
a)
b)
c)
d)
4. Near-optimal pitch of a moiré grating
The difference between pitches of moiré gratings and should be small enough (, otherwise the confidential information can be leaked simply by a naked eye even from the stationary encrypted image (Fig. 3(d)), as it was discussed in Section 3. At the same time, the difference between and should guarantee the clear contours of the hidden information in the decrypted image.
4.1. Harmonic oscillations
In case of harmonic oscillations, the secret is decrypted as a uniformly grey region while the blurred pattern of the cover image is still visible in the background. The standard deviations and according to Eq. (5) read: [14, 16]:
In the previous section, it was mentioned that the contrast in the decoded image is appropriate, if the inequality holds true. The variation of standard deviations and is illustrated in Fig. 4(a).
Fig. 4Standard deviations of the time-averaged moiré: a) harmonic oscillations; b) Gaussian oscillations. Thick solid line represents σs at λs=0.45; thin solid line and thin dashed line correspond to σb1 and σb2 at λb1=0.7, λb2=0.35 accordingly
a)
b)
The time-averaged area where the secret information is concealed becomes uniformly grey if only the relationship between the amplitude and the pitch of the grating in Eq. (4) holds true. Therefore, the standard deviation is equal to zero when and the contrast between the region of the hidden information and the background depends on the value only (note that in Fig. 4(a) the distance AC is equal to and the distance AB is equal to at the point where ). In other words, contrast in the time-averaged image depends only on the standard deviation of the background as standard deviation is equal to zero in the uniformly grey time-averaged secret area. The larger are the values of , the better is the contrast in the time-averaged-image.
Let’s suppose that the leaked secret can be clearly interpreted by a naked eye if the contrast between the background and the region of the decoded hidden information in time-averaged cover image is sufficient ():
If amplitude is predetermined to , Eq. (10) reads:
Computational solutions of the inequality in Eq. (11) are demonstrated in Fig. 5: light grey color indicates areas where , dark grey areas – where . The approximate solutions of this inequality if contrast is relatively small were derived and presented in [16]:
Black lines in Fig. 5 correspond to the boundaries of the approximate solutions in Eq. (12).
The predetermined contrast () between the background and the region of the hidden information is achieved if we preselect the values that coincide with the contour of the light or dark grey areas in Fig. 5. When is small, the approximate near-optimal solution for the determination of can be used [16]:
However, the values and still should not differ significantly if we want to ensure the safety of the DVC scheme.
Fig. 5Solutions of the inequality J0λsλbr1/8≥δ: light grey color indicates areas where J0λsλbr1/8≥δ, dark grey – areas where J0λsλbr1/8≤-δ, black solid lines correspond to the boundaries of the approximate solution in Eq. (12)
4.2. Chaotic oscillations
In the previous subsection, graphical scheme and the approximate equations for the determination of the near-optimal pair of pitches in case of harmonic oscillations were presented. Now, let us assume that oscillations are chaotic. Then standard deviation in the region of the time-averaged image where the secret information is concealed is equal to ; standard deviation of the time-averaged background is equal (Eq. (8)).
The hidden information is revealed only when the sufficient difference between and in the time-averaged image is obtained. Let’s suppose that time-averaged moiré fringes become almost fully developed in the areas of the hidden secret information when , where is a small positive real number.
Fig. 6Graphical interpretation of inequalities in Eq. (14) and Eq. (15) at 𝜀 = 0.075, 𝜎 = 0.6 (thick black line represents the optimal solution)
In such a case the values of must be as large as possible: . If the oscillations are chaotic, the variation of the standard deviations in the area of the encrypted information and in the area of the background is illustrated in Fig. 4(b).
When , the following inequality is true [17]:
Similarly, when [17]:
Graphical interpretation of the inequalities in Eq. (14) and Eq. (15) is presented in Fig. 6, where black solid line represents the optimal solution of Note that in Fig. 6 depends on the value of : . For example, if is preset to 0.075, is 2.2 mm, should be not smaller than 0.075, then must be not smaller than 2.8 mm (Fig. 6).
5. Experimental results
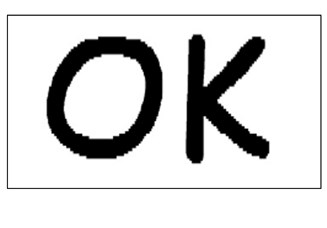
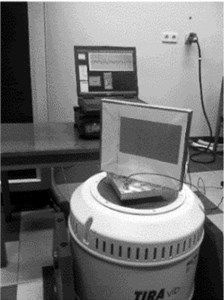
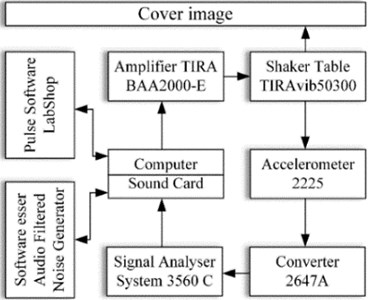
Experimental investigations were carried out in order to test theoretical relationships and to validate results obtained by computer modelling techniques. At first, the secret image in Fig. 7(a) is encoded into the moiré grating using algorithm described in Section 3. Pitches of the grating are preselected to 2.2 mm and 2.8 mm in accordance to Fig. 6. Then an ordinary laser printer is used to print the encrypted cover image (Fig. 7(a)). The experimental setup is shown in Fig. 8. We use shaking-table TIRAvib 50300 and the amplifier TIRA BAA 200-E. White noise signals are produced using noise-generating software, then transferred through the low-frequency filter and transmitted to the amplifier. The encrypted image is printed, attached onto the panel and mounted on the shaking table (Fig. 8(a)). A piezoelectric accelerometer Endevco 2225, analyzer “Pulse Multi-analyzer system Type 3560” and Pulse LabShop software are used for the observation and control of the parameters of chaotic oscillations [18].
Fig. 7a) Secret image and b) printed encoded secret image at λs= 2.2 mm, λb= 2.8 mm
a)
b)
Fig. 8a) Vibration generation equipment and b) the schematic representation of the experimental setup
a)
b)
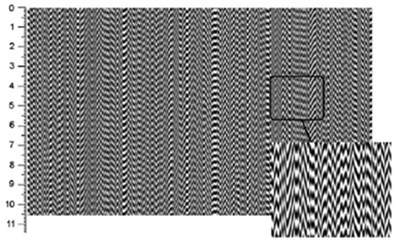
Amplification of the control signal is the only parameter that varies during the whole experiment. If the standard deviation of oscillations is equal to zero, the encrypted cover image does not move, and the secret image cannot be perceived. When standard deviation of oscillations is preselected , the secret image appears in the time-averaged image. Fig. 9 shows time-averaged cover image recorded using ordinary digital camera at exposure time 0.63 s.
Fig. 9Experimentally produced time-averaged cover image in case of chaotic oscillations at λs= 2.2 mm, λb= 2.8 mm, σ= 0.6, T= 0.63 s
6. Conclusions
It is well known that the security of the encrypted image and the sharpness of the decrypted secret in DVC depends on the pitches of a moiré grating used for the encoding of the secret information. However, a proper determination of these pitches remains an important question in the design of any DVC scheme.
The encrypted information is leaked in time-averaged image in a form of a pattern of time-averaged fringes in case of harmonic oscillations. Therefore, the pitch representing the region of the secret in a cover image should guarantee zero standard deviation in the time-averaged secret area and pitch of the background should ensure the maximum possible standard deviation in the time-averaged background. The approximate equations as well as graphical scheme for the preselection of the near-optimal pair of pitches of a moiré grating are presented in this paper.
Time-averaged fringes do not form, and the secret image is perceived from the time-averaged image only due to the difference of blur intensities in time-averaged secret and time-averaged background in case of chaotic oscillations. The pitch representing the secret information should ensure low standard deviation in the secret time-averaged area while the pitch of the background should yield sufficiently high standard deviation in the time-averaged background. The exact equations and the graphical scheme enabling easy preselection of the near-optimal pair of the pitches of a moiré grating are presented.
Such near-optimal set of the pitches of moiré gratings provides the high-enough contrast in the decoded secret image and guarantees the safety of the encoded secret information.
References
-
Naor M., Shamir A. Visual cryptography. Eurocrypt ’94 Proceedings LNCS, Vol. 950, 1995, p. 1-12.
-
Verheul E. R., Van Tilborg H. C. A. Constructions and properties of k out of n visual secret sharing schemes. Design Codes and Cryptography, Vol. 11, Issue 2, 1997, p. 179-196.
-
Hou Young Chang Visual cryptography for color images. Pattern Recognition, Vol. 36, Issue 7, 2003, p. 1619-1629.
-
Wang Daoshun, Yi Feng, Li Xiaobo Probabilistic visual secret sharing schemes for grey-scale images and color images. Information Sciences, Vol. 181, Issue 11, 2011, p. 2189-2208.
-
Shyu Shyong Jian, Huang Shih Yu, Lee Yeuan Kuen, Wang Ran Zan, Chen Kun Sharing multiple secrets in visual cryptography. Pattern Recognition, Vol. 40, Issue 12, 2007, p. 3633-3651.
-
Lin Hsiao Ching, Yang Ching Nung, Laih Chi Sung, Lin Hui Tang Natural language letter based visual cryptography scheme. Journal of Visual Communication and Image Representation, Vol. 24, Issue 3, 2013, p. 318-331.
-
Horng Gwoboa, Chen Tzungher, Tsai Du Shiau Cheating in visual cryptography. Designs, Codes and Cryptography, Vol. 38, Issue 2, 2006, p. 219-236.
-
Lin Pei Yu, Wang Ran Zan, Chang Yu Jie, Fang Wen Pinn Prevention of cheating in visual cryptography by using coherent patterns. Information Sciences, Vol. 301, 2015, p. 61-74.
-
Bert Leung W., Felix Ng Y., Duncan Wong S. On the security of a visual cryptography scheme for color images. Pattern Recognition, Vol. 42, Issue 5, 2009, p. 929-940.
-
Ragulskis M., Aleksa A. Image hiding based on time-averaging moiré. Optics Communications, Vol. 282, Issue 14, 2009, p. 2752-2759.
-
Kobayashi A. S. Handbook on Experimental Mechanics. Second Edition, SEM, Bethel, 1993.
-
Patorski K., Kujawinska M. Handbook on the Moiré Fringe Technique. Elsevier, Amsterdam, 1993.
-
Ragulskis M., Ragulskis L., Maskeliunas R. Applicability of time-average geometric moiré for vibrating elastic structures. Experimental Techniques, Vol. 28, 2004, p. 27-30.
-
Ragulskis M., Saunoriene L., Maskeliunas R. The structure of moiré grating lines and influence to time-averaged fringes. Experimental Techniques, Vol. 33, Issue 2, 2009, p. 60-64.
-
Ragulskis M., Sanjuan M., Saunoriene L. Applicability of time- average moire techniques for chaotic oscillations. Physical Review E, Vol. 76, 2007, p. 36208.
-
Saunoriene L., Aleksiene S., Ragulskiene J. Near-optimal pitch of a moiré grating for image hiding applications in dynamic visual cryptography. Vibroengineering Procedia, Vol. 13, 2017, p. 266-271.
-
Guangqing Lu, Saunoriene L., Aleksiene S., Ragulskis M. Optical image hiding based on chaotic vibration of deformable moire grating. Optics Communications, Vol. 410, 2018, p. 457-467.
-
Petrauskienė V., Saunoriene L. Application of dynamic visual cryptography for optical control of chaotic oscillations. Vibroengineering Procedia, Vol. 15, 2017, p. 81-87.
About this article

This research was supported by the Research, Development and Innovation Fund of Kaunas University of Technology (grant No. PP32/1813).
