Abstract
In order to analyze the effect of strain rate under tensile load on microcrack growth in Alpha Titanium, molecular dynamics simulation was used to analyze the results of atomic location, dislocation distribution, lattice phase transition, potential energy distribution and volume strain distribution. It was found that the cracks gradually evolved into holes after unstable propagation, and the holes were occupied by clusters on both sides of the material in the later stage under the necking of the material. The higher the tensile strain rate, the earlier the crack initiation and the larger the evolution of the through-hole. When the same strain value is reached, the lattice transformation ratio is higher under high strain rate loading. HCP is transformed into amorphous structure, BCC lattice type and a small amount of FCC type. Moreover, the larger the strain rate, the less the compatible deformation ability of the lattice is, and the more twins are produced. In addition, it is found that there are volumetric strain wave emission and diffusion in the model at the moment of void birth, and voids play a role in dividing the energy absorption region. Dislocation emission occurs at the crack tip and energy competition exists between dislocation and crack propagation.
Highlights
- The higher the strain rate is, the earlier the initiation of crack growth takes place, the more lattice phase transitions happen.
- Dislocation emission and movement during void expansion and dislocation retention after void healing were presented.
- The potential energy of the system depends on the geometric properties of the alpha-Ti lattice and is independent of the size of the model.
- The propagation of crack tip and dislocation emission take place in turn, and they have a competitive relationship.
- Only when the crack grows into a hole, will the volume strain appear and diffuse in the model in the form of wave.
1. Introduction
Titanium has low density, high specific strength, good corrosion resistance, good heat resistance, strong low temperature brittleness resistance, excellent thermal stability and creep resistance, low cycle and high cycle fatigue properties, high toughness, excellent fatigue crack growth resistance, notch sensitivity, which make Titanium metal the main material in aerospace and military industries [1, 2]. In the process of casting and heat treatment, metal parts will inevitably have internal defects such as impurity voids and uneven structure. Small voids or cracks may well develop into macro voids, which can be hidden dangers for fatigue failure of components. In subsequent forming and surface removal processes, it is difficult to ensure the integrity of the material surface. Poor roughness, surface damage, and surface residual stress can damage the surface state of the material [3]. Like other metals, the fatigue life of titanium and its alloys is very sensitive to the surface state of the materials. The main factor determining fatigue life is the formation of fatigue cracks. For components with poor surface integrity, the crack initiation period is very short, and once the micro-crack initiation occurs, the first essential in determining the fatigue life of components is the process of crack propagation into holes.
Given the fact that the existence of cracks and their number, location and size are difficult to control in actual production and processing, it is more difficult to study microcrack propagation by experimental method. In addition, the common finite element analysis method has inherent shortcomings. In the simulation process, the crack propagation cannot pass through the mesh elements in the model, and cannot reflect the behavior of materials in nanoscale [4]. Molecular dynamics has been favored by more and more scholars [5-7]. Molecular dynamics, a mature numerical algorithm, based on Newton mechanics equation, solves the motion of micro particles, extracts samples from a large number of particles, and then calculates the configuration integral of the system, and obtains the macroscopic properties of the system. The basic idea of molecular dynamics is that a large number of particle systems will be built and run under the set temperature, pressure and boundary conditions. The interaction between atoms is expressed by Newton equations of motion of particles. The instantaneous velocity and coordinates of atoms are calibrated, and the displacements of each atom are further solved. Finally, the macroscopic properties of the system are obtained by sampling statistics. With molecular dynamics simulating the crack propagation, the behavior and physical parameters of atoms, the distribution and evolution of materials and crystals can be clearly displayed at the micro-scale, and the mechanism of micro-defects evolving can be analyzed.
Indian material scholars S. Chandra and M. K. Samal simulated the interaction between brittle cracks and preexisting holes in the crack tip at the nanoscale of face-centered cubic aluminium using embedded atomic potential function. They found that the existence of a gap in front of a propagating crack prevents further crack propagation [8]. German scholars Johannes J. Möller and Erik Bitzek found that the plastic property of crack tip caused by deformation twin is large, and then the spiral dislocation along the crack front slips transversely. These processes together with the interaction of dislocation and twin determine the fracture behavior of highly bent nanoscale cracks [9]. Divya Singh and Pankaj Sharma investigated the fracture toughness of single crystals and with crack surfaces in different directions by molecular dynamics method and concluded that the deformation of and single crystals is either controlled by twinning or caused by dislocations at crack tip and surface [10].
2. Establishment of alpha titanium model with cracks preset
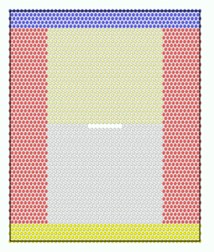
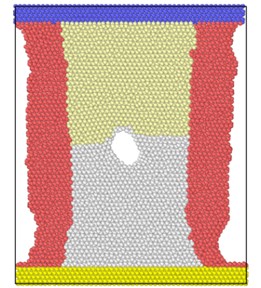
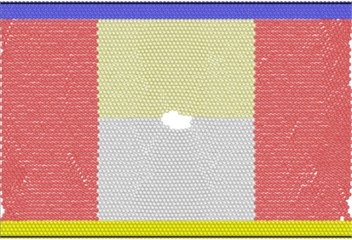
The lattice constant of - is 2.95 Å, the ratio of / is 1.59, which is lower than the ideal HCP (hexagonal closed-packed) lattice’s 1.83. A is the hexagonal edge length of the cell, and represents the cell height. As shown in Fig. 1, the model size is 50×30×4 lattice units, containing a total of 48865 atoms. The blue region is the upper boundary layer, the yellow is the lower boundary layer, and the middle region is the Newtonian layer. The boundary layer is used to maintain the integrity of the system and control the load and heat transfer. The flow layer is the main region for the growth of voids, and the atomic parameters in this region deserve attention. By eliminating atoms in the designated region, the long microcracks of 8×0.2×0.2 lattice units are preset in the center of the model. Fig. 2 shows an plane slice of 2 Å thickness.
Fig. 1Model diagram
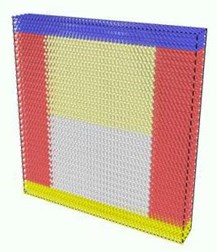
Fig. 2XoY plane slice
After presetting the microcracks, the temperature is fixed at 300 K by hot bath method, and the energy relaxation is minimized by 10,000 steps. When the energy of the system decreases slightly to a stable level, the atoms reach the equilibrium position and keep thermal motion. The shrink-wrapped boundary condition is chosen in the tensile direction, and the periodic boundary is used in the other two directions. Under the NVE micro-canonical ensemble, the model is loaded with tensile loads of different strain rates: 1×10-14/ps, 2×10-14/ps, 3×10-14/ps, 4×10-14/ps, 5×10-14/ps, 6×10-14/ps, 7×10-14/ps, 8×10-14/ps. Tensile direction proceeds along crystal direction [12-30]. The simulation consists of 50,000 steps. The atomic position information output by the software LAMMPS is imported into the visualization software for analysis. Afterwards, the distribution of atomic potential energy, the total potential energy of the system and other important parameters are calculated.
EAM is used as the type of potential function between atoms. Compared with the common monomer potential functions, such as , tersoff, EAM is a more complex multi-body potential function model, which takes into account the charge force field formed by the electron array around the nucleus, so as to express the interaction between metal atoms more accurately:
where: is the energy of atom ; is embedding energy, a function of atomic electron density ; stands for atomic pair potential interaction; and stand for the types of atoms and respectively. Atom is all adjacent atoms within the truncation radius of atom . term is embedded energy, the important term to characterize EAM potential function as a kind of multi-body potential function.
Another important factor is the selection algorithm for solving Newton equation. Verlet algorithm is a classical algorithm proposed earlier, which has high stability and good accuracy. Leap-frog algorithm has the advantage of avoiding calculating the difference between two large numbers and the same calculation and position of velocity accuracy. The calculation amount is relatively small. The disadvantage of leap-frog algorithm is that velocity and position cannot be calculated synchronously, so kinetic energy and potential energy cannot be calculated simultaneously. Velocity-Verlet algorithm is a derivative form of Verlet algorithm that can improve the accuracy of results. Velocity-Verlet algorithm is used in this paper, which takes into account the position , velocity and acceleration of particles at each time:
Atom centro-symmetry parameter computation is one of common methods for MD result processing. This method Defines a computation calculating the centro-symmetry parameter for each atom in the group, in which lattice argument can be selected according to the lattice type. In solid-state systems the centro-symmetry parameter is a useful measure of the local lattice disorder around an atom and can be used to characterize whether the atom is part of a perfect lattice, a local defect, such as a dislocation or stacking fault, or even at a surface:
where the neighbors of each atom within the cutoff are identified and and are vectors from the central atom to a particular pair of nearest neighbors.
3. Results and discussions
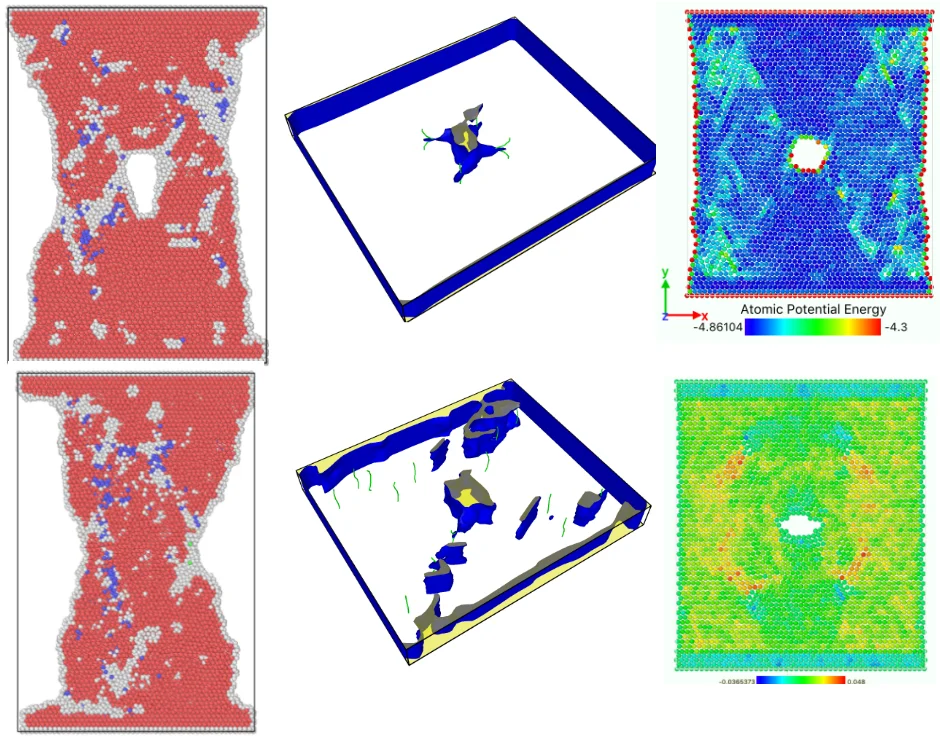
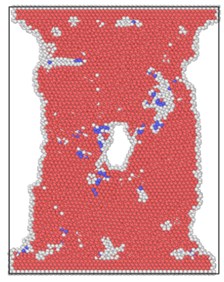
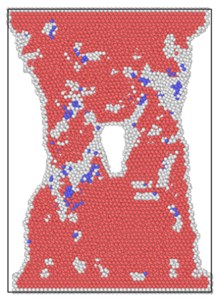
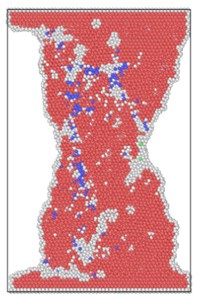
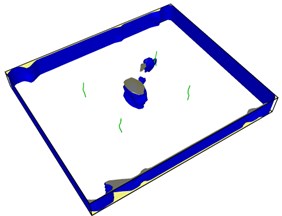
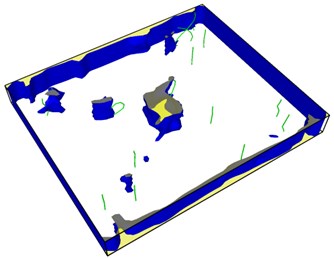
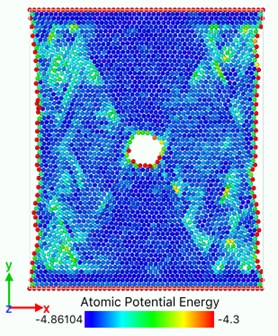
Fig. 3 shows the atomic position of the model after loading at different strain rates at the end of the simulation. From the atomic potential diagram, it can be seen that the cracks begin to propagate under the excitation of load and gradually evolve into holes through the model. Under high-speed uniform load, the crack propagation in the model starts earlier, but the voids in the model are narrower, that is, the transverse size of the voids is smaller than that under low strain rate load. At the end of the same simulation step, the shape variables of high strain rate tension are proportionally higher than those of low strain rate, so the necking of the model is more obvious, and the upper and lower boundaries are staggered. Because of necking, the void is gradually filled by clusters on both sides. The void vanish, but the model has undergone severe deformation.
Fig. 3Model diagram at the end of simulation at different strain rates tension
a) 2×10-14/ps
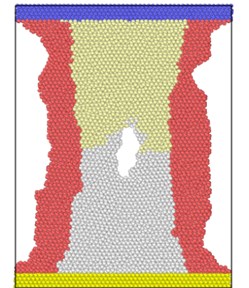
b) 4×10-14/ps
c) 6×10-14/ps
d) 8×10-14/ps
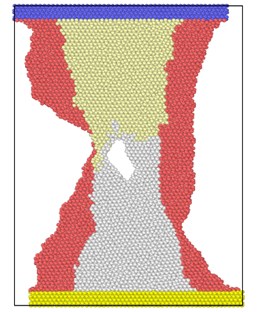
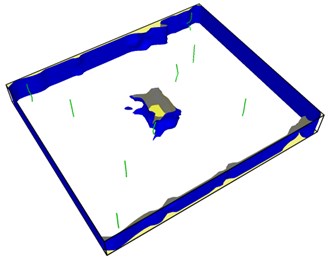
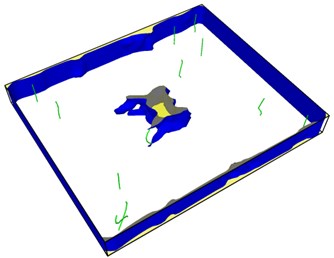
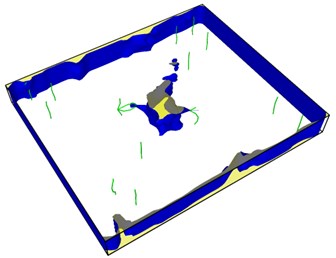
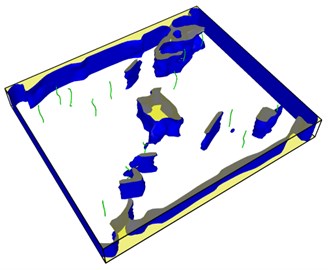
The lattice distribution of HCP (hexagonal closed-packed) at the minimum number of lattices in the model is shown in Fig. 4. The red atoms in the figure belong to the HCP lattice structure, the dark blue atoms are BCC (body centered cubic) lattice, a small number of green atoms are atoms in FCC (face center cubic) lattice, and the gray white is unrecognized crystal structure or amorphous state.
The number of perfect HCP lattices in the model was 22627 before the stretching started. From the lattice quantity nephogram, with the stretching simulation, the perfect HCP lattice fluctuates constantly, which indicates that the lattice structure change to a certain extent is a reversible process. The decrease of high strain rate is greater, and the lowest number of unchanged lattices is lower than other strain rates, which proves that rapid and violent deformation can lead to a higher proportion of HCP lattice structure transformation. From the bottom projection, the projection area of the low strain rate load is basically occupied by red, meaning that the low strain rate load has less damage to the hexagonal close packed lattices in the model, and the preservation ratio of the original structure of the lattice is very high during the tensile process.
Table 1Number of each lattice type at different strain rates when lattices change most
Strain rate | 1×10-14/ps | 2×10-14/ps | 4×10-14/ps | 6×10-14/ps | 8×10-14/ps |
HCP | 21218 | 21120 | 19754 | 17994 | 17460 |
BCC | 156 | 219 | 379 | 456 | 777 |
Others | 5253 | 5288 | 6494 | 8177 | 8390 |
Fig. 4Lattice type diagram at different strain rates when lattices change most
a) 2×10-14/ps
b) 4×10-14/ps
c) 6×10-14/ps
d) 8×10-14/ps
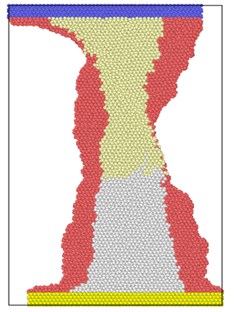
Fig. 5Number of HCP lattices under tension at different strain rates
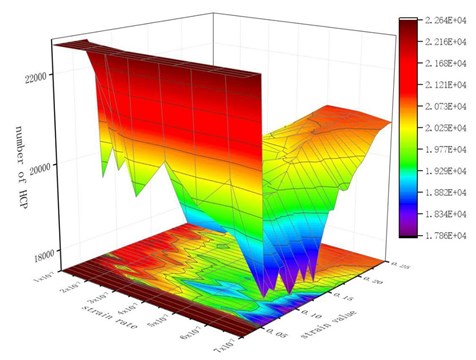
In the later stage of simulation, a certain number of HCP lattice types were restored. When the strain value is high, the necking of material becomes more and more obvious. With the shrinkage of the transverse size of the hole, a considerable part of the atoms on the inner surface of the hole re-approach the neighboring atoms, and the distance is less than the radius of the atom interaction, the binding force restores and the atomic bond regenerates. When these atoms regenerate atomic bonds broken before, these atoms are immediately recognized as HCP lattices. They reconstitute the HCP structure and increase the number of HCP lattices.
Fig. 6Potential energy curves of the system under different strain rates
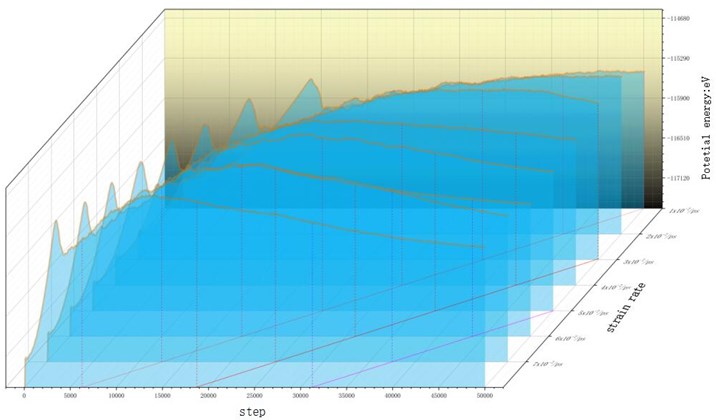
By comparing the energy curves, the potential energy of high strain rate load rises faster. The direct reason is that the distance between atoms increases faster. When the elongation ability of atomic bond reaches, the energy pool of the model saving external work has been saturated. The potential energy curve begins to decline after reaching a critical peak value under continuous stretching, and the decreasing speed and amplitude of high strain rate load are greater than that of low strain rate load. Load curve. At the end of the simulation, the total potential energy is negatively correlated with the strain rate. Obviously, this is because the higher strain rate load stretching makes the final deformation degree of the model very large. The model is nearly fractured, and the number of atomic bond breaks is more than the number of fracture bonds caused by the low strain rate load with small final strain. Draw three red isostrain lines on the bottom of the simulation step-to-strain rate correlation plane, and stretch them vertically upward to intersect the isostrain surfaces with the curves. When the same strain is reached, the potential energy of the system under high strain rate loading is lower than that under low strain rate tension. This is because, in the energy decreasing region, a large number of atom bonds saturated with absorbing energy have been broken in succession, and the deformation caused by high strain rate loading is more intense than that caused by low strain rate loading. The number of atomic bond breaks is more, so the energy of the system is released more and the potential energy decreases more obviously. It can be considered that even if the strain is the same, different strain rate tensile processes will result in different results, and high strain rate loads will cause more damage to the internal structure of the material.
The dynamic force of dislocation motion is derived from the shear stress component of elastic stress on the slip plane in the crystal. The resultant force formula acting on the dislocation is expressed as follows:
where: is force on dislocation, is Burgers vector, is Dislocation element, is Lattice stress.
Fig. 7First emission dislocation from crack
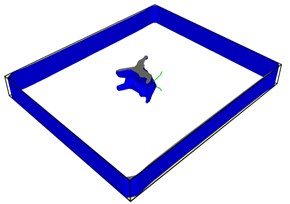
a)
b)
c)
d)
Dislocations are indeed emitted from nucleation at the crack tip. Fig. 7(a) shows that no dislocations are formed in the expansion of the left crack tip, while the shape of the right crack tip changes little, and dislocations appear before the left. After another 20-step simulation, dislocations were also emitted from the left crack tip. Fig. 7(c) and Fig. 7(d) clearly show that each crack tip emits two dislocations upward and downward respectively. Under the continuous action of tensile stress, the dislocations begin to move and leave from the crack tip.
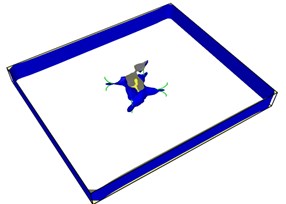
Fig. 8Second emission and proliferation of dislocations
a)
b)
c)
d)
From Fig. 8, it can be seen that the dislocation is still emitted even after the crack has evolved into a hole, and the second wave dislocation is emitted as shown in the Fig. 8(b). When the dislocation emission in the graph approaches the edge of the model, it has multiplied.
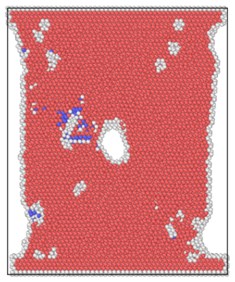
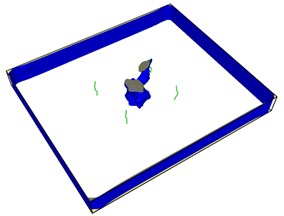
Fig. 9Distribution of dislocations before and after healing of the lower right hole
a)
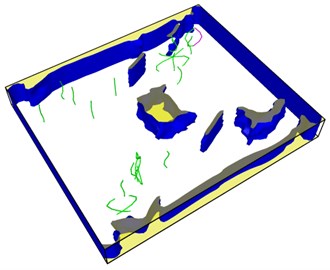
b)
It is obvious that the holes in the upper left corner and the lower right corner heal rapidly and disappear in 60 steps of simulation, leaving a large number of dislocations instead in the region. The purple dislocation in the upper left corner is [1-100] type. The green dislocation is type 1/3 [1-210]. At this time, the total dislocation length is 296 Å, which contains a considerable amount of energy. The length of dislocation line is directly related to the strain energy in the crystal. The total strain energy of dislocation per unit length is as follows:
where: is a parameter determined by the density and type of dislocation, usually between 0.5-1.0, is slip distance, is shear modulus.
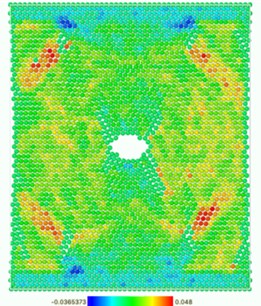
Fig. 10Atomic potential energy distribution (Unit: eV)
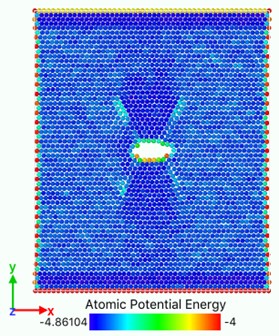
a)
b)
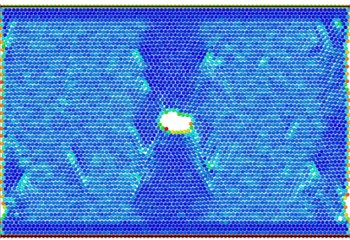
In Fig. 10, the bright region is a slip zone along which atoms are rearranged in layers and dislocations nucleate and emit. The location of the slip band is determined by the position of the crack tip. Each pair of slip bands on the left and right sides intersects near the crack tip, and the upper and lower dislocation bands are symmetrical. With the continuous tension of the load, dislocations emit, multiply and move on this plane. With the increase and movement of dislocations, the system absorbs external work and the potential energy increases. The potential energy distribution of atoms near dislocations increases significantly, and the potential energy of atoms around dislocations with larger Bernoulli vectors is higher. Energy dissipation occurs mainly through the growth of voids accompanied by elongation or breakage of atomic bonds and the emission and movement of dislocations. With the crack growth and dislocation emission, the total potential energy system of model atomic bond breaking decreases, releases energy and reaches stability. Metals containing both cracks and dislocations can be regarded as the steady-state force field superimposed by two stress systems. One is the force field generated by external loading, the other is the stress field of cracks themselves or the group of crack dislocations. When the external load changes to break the balance, the system will release energy through the breaking of atomic bonds, dislocation propagation stress, transfer energy and other forms to form a new force field and reaching equilibrium.
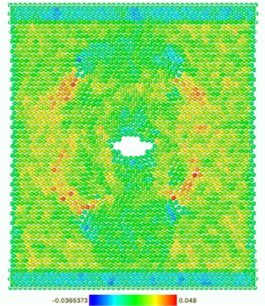
Fig. 10(a) shows that at the beginning of the simulation, the potential energy of the atoms in the slip zone is higher than that in other regions, and the atoms with high potential energy are first activated. From Fig. 10(b) we can see that in the follow-up simulation, the potential energy distribution is divided into four distinct regions by the slip zone. The left and right regions are stretched regions. The material has vacancies, the atomic spacing increases, and the potential energy increases. The upper and lower regions are denser due to material necking, and the potential energy basically does not change significantly. The reason is that there are holes between the upper and lower regions so there is no force-bearing material as connection to transfer energy. The potential energy distribution region of the model is divided by the combination of voids and slip zones. In Fig. 11, the size of the model is widened to verify that the direction of the potential energy boundary is independent of the size of the model.
Fig. 11Atomic potential energy distribution of widened size model
a)
b)
There are dislocations or holes in each bright blue region with higher potential energy. The atomic potential energy near the dislocations or holes is higher. In other words, the generation of holes and the emission of dislocations require energy excitation. Therefore, for the energy distribution absorbed by the system, the existence of dislocations and holes is in a competitive relationship.
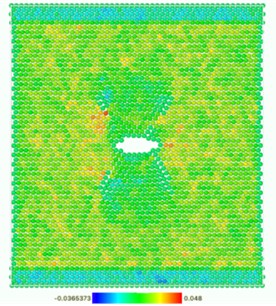
Fig. 12 shows the volume strain distribution of the model slice. The red region is the region with higher strain, the positive strain is subjected to tensile stress, and the blue region is the region with negative volume strain. It is noteworthy that at the moment when the crack develops into a hole, four strain planes with high strain values are emitted around it, and then these compressive strain planes propagate around in the form of waves. The original model with uniform strain is like a calm water surface. The voids formed in the model is like a stone falling into the water surface. Then strain wave spreads around like ripples caused by the “stone”. From Fig. 12(c), it can be seen that when the strain wave propagates near the edge of the model, it occupies the largest area and has the widest influence area. At this time, the energy is the highest. When the strain wave propagates near the edge, a dark blue negative strain region will appear at the intersection of the upper and lower boundary layers. Fig. 12(d) shows that when the strain wave completely diffuses to the boundary, it will retreat from the four corners of the model and propagate out of the system. Looking at the energy curve from the corresponding simulation steps, there is always an obvious drop in the model. It is reasonable to speculate that the wave will release a certain amount of energy when leaving. In addition, the special significance of this strain wave is that the strain wave appears only at the moment when the crack evolves into a hole from the beginning to the end of the simulation process. Once the voids are formed, there are no obvious high value regions in the strain distribution of the model. Large areas in the cloud are green, and occasionally a few blue areas appear. The negative strain of these blue areas is caused by the local compaction and slight extrusion of the material caused by the necking of the later tensile model.
Fig. 12Volume strain distribution diagram
a)
b)
c)
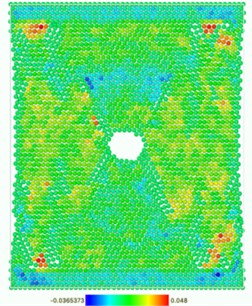
d)
4. Conclusions
With molecular dynamics simulation, it is found that Alpha Titanium with microcracks will gradually lose stability and expand into holes under the excitation of tensile load. The higher the strain rate is, the higher the working power of the model is, the earlier the initiation of crack growth is, and the more the number of lattice phase transitions is, the more damaged the material is. At the same strain value, the model will absorb higher energy under low strain rate load, and the potential energy of the system is higher than that of high strain rate load. When the latter deformation value is very high, the material necks, the holes are filled by clusters on both sides of the holes, and the upper and lower boundary layers are staggered. At the same time, when the crack grows into a hole, the volume strain wave is generated and diffused in the model, and the hole plays a role in dividing the energy absorption region of the model. The propagation of crack tip and dislocation emission take place in turn, and they have a competitive relationship.
References
-
Huang Z. W., Yong P. L., Liang N. N. Slip, twinning and twin-twin interaction in a gradient structured titanium. Materials Characterization, Vol. 149, 2019, p. 52-62.
-
Cruz Marcio Fernando, Borille Anderson Vicente Decision methods application to compare conventional manufacturing process with metal additive manufacturing process in the aerospace industry. Journal of the Brazilian Society of Mechanical Sciences and Engineering, Vol. 39, Issue 1, 2017, p. 177–193.
-
Poulon-Quintin, Angéline, Watanabe Ikuya, Watanabe Etsuko, et al. Microstructure and mechanical properties of surface treated cast titanium with Nd: YAG laser. Dental Materials, Vol. 28, Issue 9, 2012, p. 945-951.
-
Pond R. C., Serra A., Bacon D. J. Dislocations in interfaces in the h.c.p. metals – II. Mechanisms of defect mobility under stress. Acta Materialia, Acta Materialia, Vol. 47, Issues 5-31, 1999, p. 1441-1453.
-
Ackland G. J., Jones A. P. Applications of local crystal structure measures in experiment and simulation. Physical Review B, Vol. 73, Issue 5, 2006, p. 054104.
-
Van Swygenhoven H., Caro A., Farkas D. A molecular dynamics study of polycrystalline FCC metals at the nanoscale: grain boundary structure and its influence on plastic deformation. Materials Science and Engineering A, Vols. 309-310, 2001, p. 440-444.
-
Moghaddam Masoud Ghorbani, Achuthan Ajit, Bednarcyk Brett A., et al. Grain size-dependent crystal plasticity constitutive model for polycrystal materials. Materials Science and Engineering A, Vol. 703, 2017, p. 521-532.
-
Chandra S., Samal M. K., Kumar N. N., et al. An atomistic modelling and statistical analysis study of crack-void interaction in aluminum. Philosophical Magazine Letters, Vol. 97, Issue 12, 2017, p. 504-514.
-
Möller Johannes J., Bitzek Erik On the influence of crack front curvature on the fracture behavior of nanoscale cracks. Engineering Fracture Mechanics, Vol. 150, 2015, p. 13-19.
-
Singh Divya, Sharma Pankaj, Jindal Sahil, et al. Atomistic simulations to study crack tip behaviour in single crystal of bcc niobium and hcp zirconium. Current Applied Physics, Vol. 19, Issue 1, 2019, p. 37-43.
Cited by
About this article

The authors would like to thank the National Natural Science Foundation of China No. NSFC 51206011, Jilin Province Science and Technology Development Program of Jilin Province No. 20170204064GX, Project of Education Department of Jilin Province No. JJKH20190541KJ, Changchun Science and Technology Program of Changchun City No. 18DY017.
