Abstract
In order to improve the reliability and stability of hybrid electric vehicle driving motor system, according to the performance parameters of the hybrid electric vehicle, the driving motor system is designed and analyzed for the hybrid electric vehicle. Based on the performance parameters of the hybrid electric vehicle, the power parameters of the permanent magnet synchronous motor (PMSM) are calculated and determined, then the parameters of the stator core, the permanent magnet and the rotor core are designed and calculated, as well as other main characteristic parameters of the driving motor system are calculated. The model of a PMSM is established and simulated by ANSOFT Maxwell according to the obtained motor parameters, and then the steady state and transient state of the driving motor are simulated in different working points, and the electromagnetic and performance curves are combined to determine the overall performance requirements of the driving motor, which can be used to match the hybrid electric vehicle. The simulation results show that the designed PMSM can be used to match the hybrid electric vehicle and meet the performance requirements of the vehicle. The final simulation analysis results are in good agreement with the theoretical calculation results, which indicates that this method can be used to afford a theoretical basis to reduce the cogging torque and optimize the in-wheel motor of electric vehicle in the future.
Highlights
- According to the performance parameters of the hybrid electric vehicle, the driving motor system is designed and analyzed for the hybrid electric vehicle.
- The analytical method proposed in this paper can be used to afford a theoretical basis to reduce the cogging torque and optimize the in-wheel motor of hybrid electric vehicle in the future.
- The transient no-load and load state curves of the drive motor model are accurately obtained.
1. Introduction
As the most popular means of traffic and transportation, automobile plays an increasingly important role in people's life and industrial production [1]. To a certain extent, Hybrid electric vehicle has injected new vitality into the automobile, and gradually become the century cleaner, efficient and convenient vehicle, and the driving motor system is the cornerstone to guarantee the performance of hybrid electric vehicle [2-4]. Excellent driving motor system is of great significance of the development of hybrid electric vehicles.
Driving motor system is an important system of electric vehicles, as well as the design of hybrid electric vehicle. At present, according to the driving motor system design theory, scholars at home and abroad design the drive system from all aspects of the driving motor. Huang et al. [5] determined the selection method of the key parameters of the driving motor, but the selected parameters was not simulated and analyzed. Sun et al. [6] constructed the loss model of dual motor system, and deduced the optimal torque distribution coefficient Eq. of double motor energy efficiency, but the internal electromagnetic analysis of the driving motor was not done. Xiao et al. [7] researched the electromagnetic interference prediction method of motor and its drive system under Multi-field coupling, but the model of driving motor was not simulated. Baitade A. et al. [8] studied the harmonic suppression and power factor improvement technology of three phase asynchronous motor drive system using passive LC element, but lacked the analysis of the magnetic field of each part of the driving motor. Yang et al. [9] predicted the common mode interference, and compared with the experiment in the drive system of electric vehicle, but lacked of software simulation analysis. Guo et al. [10] described the equivalent circuit of the drive system under different working conditions in detail, but the stability of the internal structure of the drive system was not studied.
Based on the above analysis of references, this article will design the driving motor system according to the performance parameters of hybrid electric vehicle, combining with the hybrid electric vehicle driving motor design features and performance requirements, and will use the magnetic field analysis software of ANSOFT Maxwell to simulation and analyze the driving motor of hybrid electric vehicle, make it suitable for different road conditions, and achieve high efficiency and low emission requirements.
2. Determination of hybrid driving motor system
2.1. Selection of driving motor system
Hybrid electric vehicles have many characteristics of ordinary cars. The internal combustion engine and the driving motor are output as power source to drive system obtains energy through two ways of fuel and battery. However, the structure and control process of hybrid electric vehicle is complex, and there still has the problem of waste emission with the participation of internal combustion engines [11-13].
According to the energy flow of internal combustion engine and the driving motor, and the connection relationship in structure between them, hybrid electric vehicle can be divided into three types [14]: series, parallel and mixed type.
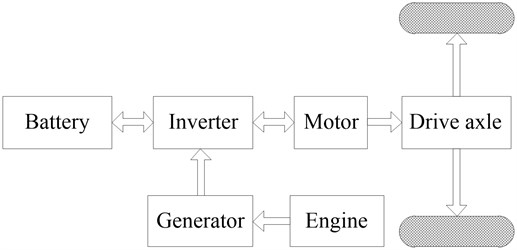
(1) The series.
The series hybrid drive mode is shown in Fig. 1. It can be seen that the engine is not involved in the driving work, but to provide power for the generator. When the battery power is insufficient, the mechanical energy of the engine will be converted into electricity, and only the motor is driving the vehicle during the driving process.
Fig. 1Series hybrid drive mode
(2) The parallel.
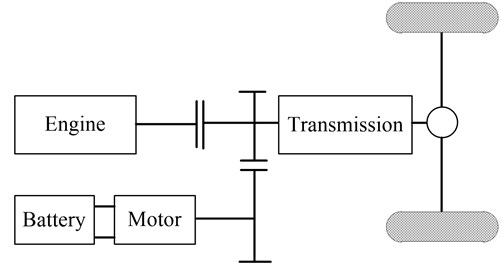
The parallel hybrid drive mode is shown in Fig. 2. From the diagram, we can see that the system has different driving modes. The motor can not only drive the vehicle, but also sometimes act as a generator to restore energy for the battery. Since two powers can work together on the transmission system, the vehicle can require less power for the engine.
(3) The mixed.
The mixed hybrid drive mode is shown in Fig. 3. The driving system is a combination of the former two. More importantly, it can recover the excess energy of the engine. When braking, it also recharges the energy wasted by ordinary automobiles by using generators as batteries.
In this article, the parallel hybrid drive mode is selected, and the parallel power transmission line is shown in Fig. 4. The system structure is simple, but it is a good way to reduce the energy loss, and to realize long distance driving.
Fig. 2Parallel hybrid drive mode
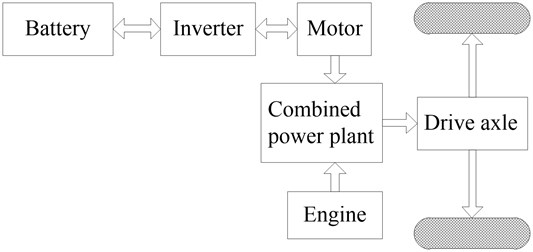
Fig. 3Mixed hybrid drive mode
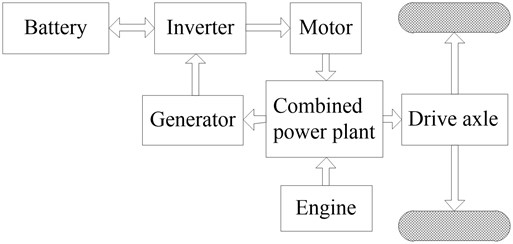
Fig. 4Parallel power transmission line
2.2. Selection and parameter determination of driving motor
Hybrid electric vehicle is usually changes running status with the driver's consciousness change and the actual different road, so it is usually stricter than normal driving motor on the performance requirement. Due to PMSM with low loss, large range of speed and good performance, it is suitable for hybrid electric vehicle driving characteristics, so this article select PMSM as hybrid electric vehicle driving motor.
In the process of driving, the power of the hybrid electric vehicle mainly comes from the internal combustion engine and the driving motor, so when considering the overall performance of the hybrid electric vehicle, the power of the internal combustion engine and the driving motor should be considered simultaneously. By matching the demand of the vehicle power first, then according to certain good mixing degree, the power of the driving motor is obtained through using mixing degree calculation Eqs. (1-3):
where, is the drive total power , is the power of the driving motor, is the power of engine, is the maximum speed, which is 180 km/h; is rolling resistance coefficient, which is 0.015; is coefficient of air resistance, which is 0.367; is face area, which is 1.96 m3; is transmission efficiency, which is 0.9; is the maximum grade ability, which is 0.3; is the air-gap length, which is 1 mm.
From the Eqs. (1-4) and combined with the actual use of the car, the drive total power is 100 kW; the mixing degree () is 50 %. Combined Eq. (4), the peak power of the driving motor can be calculated. Further, the other main parameters of the driving motor can be obtained. The result is shown in Table 1.
Table 1The main parameters of the driving motor
Parameters | Value |
Rated power (kW) | 20 |
Rated torque (Nm) | 63.66 |
Rated voltage (V) | 360 |
Rated electricity (A) | 35.92 |
Rated speed (r/min) | 3000 |
3. Electromagnetic design of driving motor
3.1. Dimension design of stator and permanent magnet
In order to design the superior performance of the driving motor, it is needed to design analysis for the electromagnetic of the driving motor, mainly includes the key parts, such as stator, air-gap length, magnetic circuit structure and permanent magnet rotor [15].
When calculating the inner diameter of the stator, it is necessary to know the calculation power of the PMSM, and the calculation formula is as in Eq. (5):
where, is rated load, is power angle, which is 12.02°; is ratio of electric potential to voltage, which is 0.96.
The motor constant represents the material that specifies how much capacity is required to calculate the torque, and the expressions are as in Eq. (6) and Eq. (7):
where, is the electricity density; is armature length, which is 142 mm; is rated speed, which is 3000 r/min; is motor torque.
The range of value can be determined by motor speed according to the type of designed motor. After the value of is selected in combination with the design manual, the range of stator size can be known. The expression of is as in Eq. (8):
For the selection of the air gap length () of the delta, when selecting larger delta has many positive effects, it can get the more regular change of wave shape. Harmonic flux density will reduce in the magnetic, which makes energy dissipation smaller. However, it leads to a decrease in the torque of the slot, which makes the output torque smaller. Usually, the air gap length () of the PMSM should be large. Take into consideration various factors, the air gap length delta () is 1mm.
Combined with the calculation power and the air gap length [16], therefore, the internal and external diameter parameters of the driving motor stator and rotor can be determined, as shown in Table 2.
Table 2Internal and external diameter parameters of stator and rotor
Project | Parameters | Value | ||
Internal diameter | External diameter | Internal diameter | External diameter | |
Value | 135 mm | 215 mm | 133 mm | 75 mm |
According to the structure way of permanent magnet, the magnetic circuit structure of rotor can be divided into the surface mounting type, embedded type and claw pole type [17]. Because the surface mounting type rotor has the radial structure characteristics and the simple manufacturing process can reduce the PMSM production costs. Therefore, this article selects the surface mounting type rotor magnetic circuit structure.
Permanent magnet material plays a key role in the magnetic power of the motor. The permanent magnet materials are diverse, and the performances are very different. Therefore, in the design process of the driving motor, it is necessary to conduct a reasonable analysis of permanent magnet material. The driving motor of hybrid electric vehicle need a relatively high demand, this article selects N35H.
The size of the permanent magnet means that the magnetic field produced by the inner coil is fully utilized. Select the appropriate size of permanent magnets can not only reduce the energy loss, but also can save the materials. The calculation formula for the size of permanent magnet is as in Eq. (9):
where, is the coefficient associated with the rotor structure, and the scale value is [0.7, 1.2]; is saturation coefficient, and the scale is value is [1.05, 1.3]; is no load point of permanent magnet, which is 0.8992; is no load leakage coefficient, which is 1.2; is polar distance, which is 70.65 mm; is flux density of air gap, which is 0.6689; is remanence, which is 1.1395T; is waveform coefficient of air gap flux, which is 0.9129; is axial length of permanent magnet, which is 140 mm.
3.2. Calculation of permanent magnet parameters
The permanent magnet material brand is RbFeB-N35H, the calculation for a series of its parameters are as in Eqs. (10-13).
The expression of the remanence is as in Eq. (10):
where, is the residual magnetic density at 20 °C, which is 1.22; is the reversible temperature coefficient, which is 0.12 K-1; is the loss efficiency of , which is 0 %; is the predicted operating temperature, which is 75 °C.
The expression of the coercivity is as in Eq. (11):
where, is the coercivity at 20 °C, which is 923 kA/m.
The expression for the sectional area of each pole flux is as in Eq. (12):
where, is the per pole permanent magnet width, which is 39 mm; is the axial length of permanent magnet, which is 140 mm.
The expression of the permanent magnet mass is as in Eq. (13):
where, is the pole logarithm of motor, which is 3; is the magnetization direction length, which is 6 mm; is the permanent magnet density, which is 7.45×10⁻⁶.
3.3. Basic theory of electromagnetic field
The theoretical basis of electromagnetic field analysis for Maxwell’s equations is presented in two forms as follows.
The expression of the integral form is as in Eq. (14):
where, is the surface boundary of , is the magnetic density, is the electric field strength, is the charge bulk density, is the conduction current density, is displacement current density, is the volume area enclosed by closed surface.
The differential form can be obtained by derivation of Eq. (14):
The relationship between , , and depends on the properties of the medium. If the medium is linear, their relation is expressed as Eq. (14):
where, is the dielectric constant of the medium, is the permeability of the medium, is the conductivity of the medium.
The above basic equations used in the analysis usually need to import different auxiliary quantities automatically according to different situations, which not only reduces the amount of calculation, but also makes the physical concepts clearer.
4. Simulation and analysis of driving motor
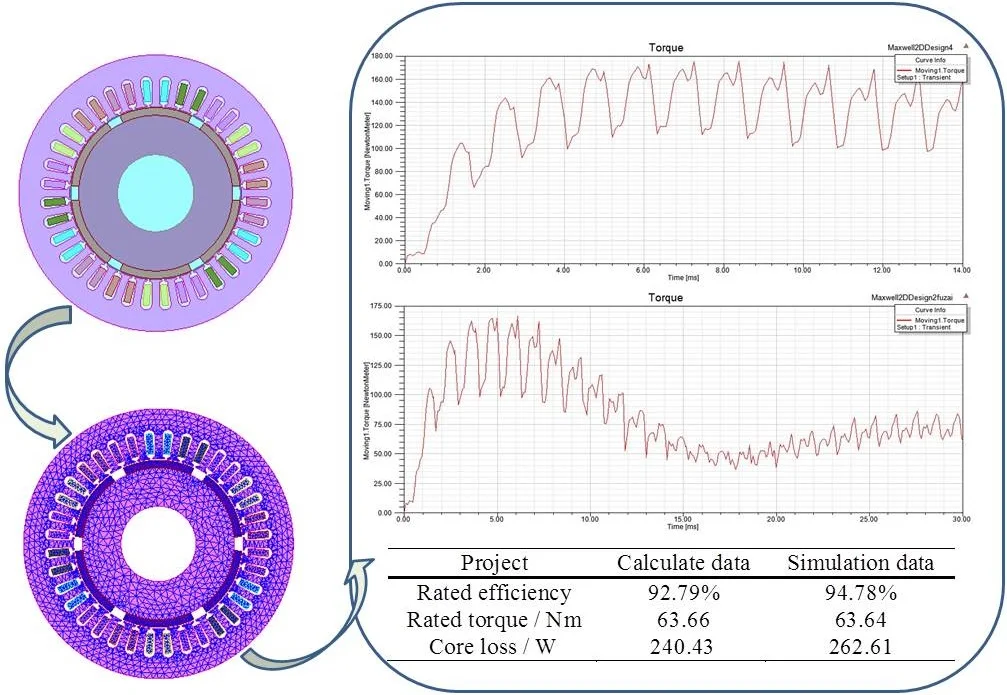
The transient solver and static magnetic field solver will be used in the ANSOFT Maxwell software, to do a simulation analysis for the design driving motor. Before the analysis, according to vehicle parameters and performance indicators, the performance requirements of hub motor are determined. The power, torque and speed of hub motor are analyzed and calculated, and the dynamic parameters of hub motor of electric vehicle are matched. According to the basic parameters of the hub motor, the basic dimensions of the hub motor are determined, and the silicon steel sheet is chosen as the material of the inner stator and outer rotor of the hub motor. The electromagnetic parameters of the hub motor are calculated, and the finite element model of the hub motor is established, which verifies the accuracy of the model, as shown in Fig. 5.
Fig. 5Driving motor simulation model
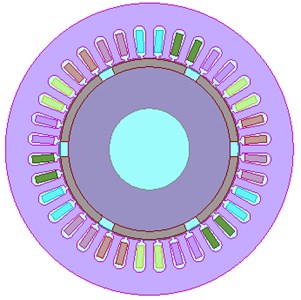
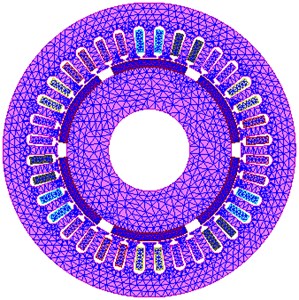
Fig. 6Driving motor mesh split chart
4.1. Finite element analysis
The discretization of the driving motor model is achieved through mesh segmentation. The number of mesh directly affects the calculation results of the finite element. Set the mesh, and a two-dimensional finite element meshing of the entire driving motor model can be obtain, as shown in Fig. 6. The number of mesh divisions is 51483 cells. Meshing is the most important step in the discretization of finite elements, and it is usually directly related to the accuracy of solving the analysis. These blocks represent discrete small cells. As shown in the Fig. 6, the boundary shapes are linear or curved, and the curve type can pick up more points when simulating, which can improve the accuracy of the calculation [18].
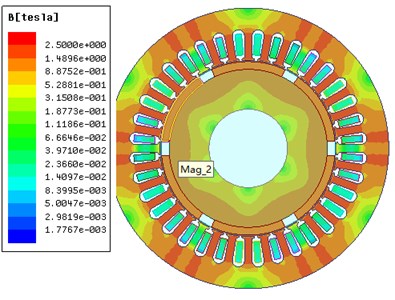
Further, the magnetic lines distribution analysis of the driving motor is shown in Fig. 7. From Fig. 7, it can be concluded that the large magnetic lines density around the permanent magnet means that the magnetism is stronger and the change is more rapid. At the same time analysis the driving motor magnetic cloud as shown in Fig. 8. The same color in the Fig. 8 shows the same magnetic flux density. We can determine the magnetic flux density combined the color arrangement on the left. The maximum magnetic flux density is about 2.5.
Fig. 7Driving motor magnetic field lines distribution
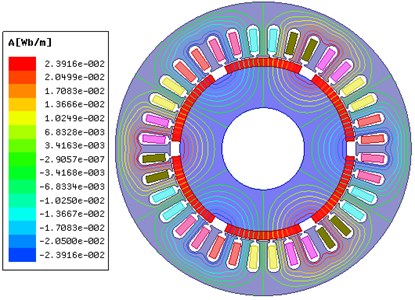
Fig. 8Driving motor magnetic cloud image
4.2. Analysis of transient no-load magnetic field of driving motor
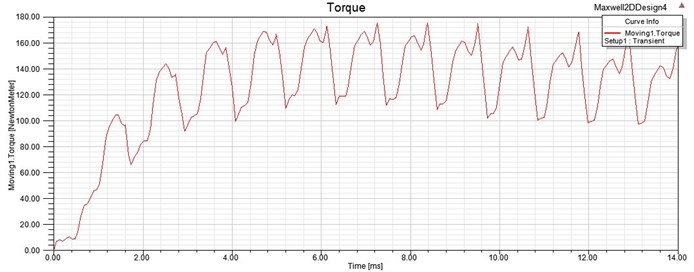
The no-load magnetic circuit of the driving motor refers to the magnetic circuit generated by the permanent magnet when the excitation current is zero. And then setting its speed to rated speed 3000 r/min, as shown in Fig. 9, the transient electromagnetic torque curve at the speed of 3000 r/min is obtained. According to the Fig. 9, the torque can be clearly seen in torque curve after 3 times large amplitude rise and fall to reach a relatively high value, this is accompanied by the driving motor static starting up to the rated speed of the phenomenon, the torque will float up and down in 140 Nm after the driving motor speed reaches the rated speed.
Fig. 9Electromagnetic torque curve of the driving motor at the speed of 3000 r/min
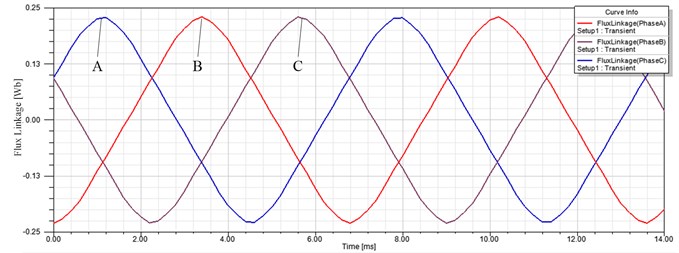
Furthermore, as shown in Fig. 10, the back EMF waveform diagram of the driving motor at no load is shown. As can be seen from Fig. 10, there is only the role of permanent magnets and four harmonics in the no-load magnetic field, these harmonics can be eliminate by stator winding star connection. Meanwhile, the amplitude of electromagnetic torque is about 180V can be seen from Fig. 10. As shown in Fig. 11, the winding flux linkage curve of the driving motor is shown. As can be seen from Fig. 8, three different colored lines on behalf of A, B, C three-phase winding magnetic flux change. Besides, it shows a sinusoidal waveform and winding flux linkage is in a normal state of change.
Fig. 10Back electromotive force waveform of the driving motor at no load
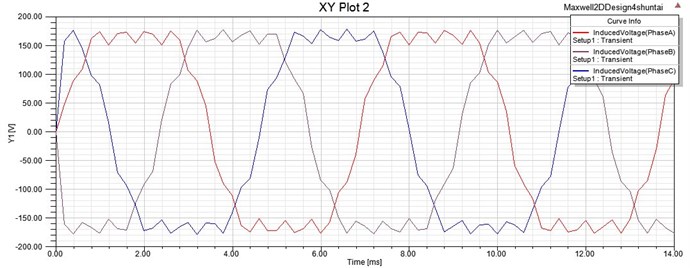
Fig. 11Winding flux linkage curve
4.3. Analysis of transient load magnetic field of driving motor
The stator and the permanent magnets of the driving motor are symmetrically distributed, so only part of the model analysis of the driving motor need to be analyzed in the simulation analysis. With the design of the slot number is 36 and the permanent magnet number is 6, the common denominator can be drawn between them is 6, so the minimum unit model of the driving motor is 1/6 model. And the unit model can reduce the computing time and greatly improve the computational efficiency, and the whole data can be obtained directly or by symmetry. The 1/6 model of driving motor is used for dynamic simulation in transient load analysis, as shown in Fig. 12, the magnetic lines diagram at different time is shown. The position of the rotor varies at different time, and the magnetic field line still has obvious separation in the middle of the permanent magnet. The magnetic lines basically change periodically, and the magnetic lines are relatively dense in the critical part, which accords with the distribution rule of magnetic lines.
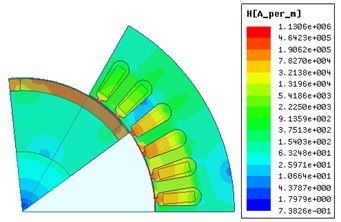
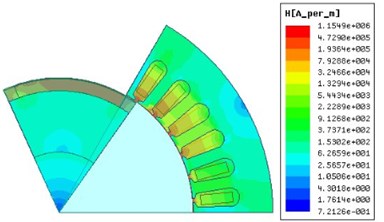
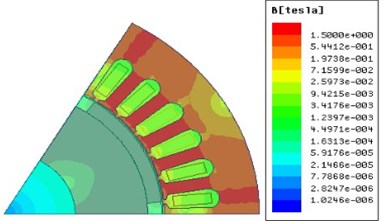
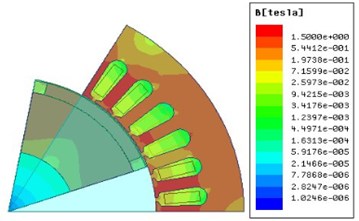
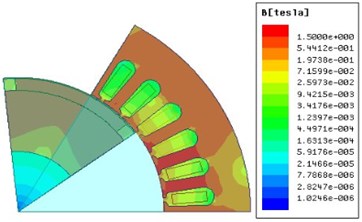
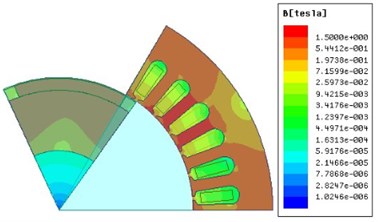
As shown in Fig. 13, the magnetic induction intensity diagram at different times is shown. It can be seen that when the rotor starts to rotate, the magnetic induction intensity of the moving boundary is higher, and when the driving motor runs to the next moment, the magnetic induction intensity of the part is relatively small, and tends to be stable. It is concluded that the distribution of magnetic induction intensity changes regularly with time. As shown in Fig. 14, the magnetic cloud diagram at different time are presented, it can be seen from the magnetic cloud near the rotating axis is smaller at the 0 s than that at the other moment, because the driving motor does not start up to the starting torque angle. The magnetic cloud varies periodically with time when the driving motor starts more than the starting torque angle.
Fig. 12Diagram of magnetic lines of force at different times
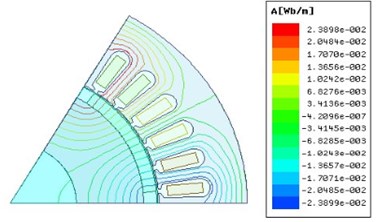
a) 0 s
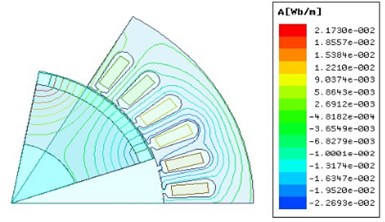
b) 0.01s
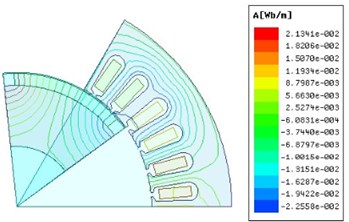
c) 0.02 s
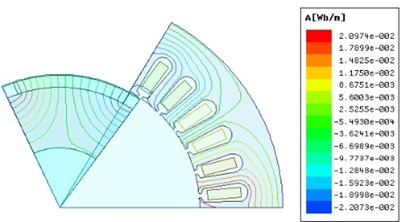
d) 0.03 s
Fig. 13The magnetic induction intensity at different time
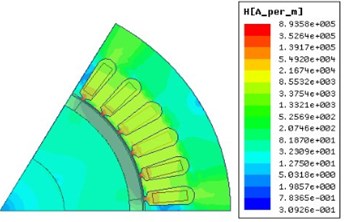
a) 0 s
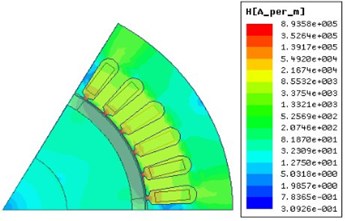
b) 0.01 s
c) 0.02 s
d) 0.03 s
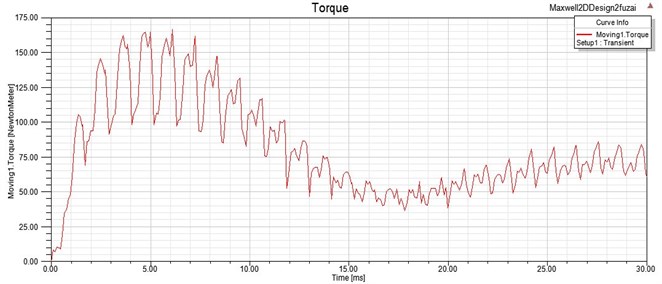
Analyze the driving motor torque curve, as shown in Fig. 15. As can be seen, permanent magnet synchronous driving motor rise to 160 Nm gradually reduce after several harmonics under the load of electromagnetic torque which remain at 70 Nm, which is larger than the rated torque of 63.66 Nm.
Fig. 14The magnetic cloud at different time
a) 0 s
b) 0.01 s
c) 0.02 s
d) 0.03 s
Fig. 15Transient electromagnetic torque curve
4.4. Analysis of simulation results
ANSOFT software has the function of automatically identifying the integrity of the model. According to the prompt, we can modify the wrong settings. When all the settings are selected, we can carry out simulation analysis. The results shown in Fig. 16 and Fig. 17 can be obtained by solving and analyzing the comprehensive performance of the designed motor with ANSOFT Maxwell software.
The relationship between input current and torque angle is shown in Fig. 16. It can be seen from the figure that the input current of permanent magnet synchronous motor varies with the increase of the torque angle. Between 10° and 35°, the input current has a gentle trend after reaching 50 A; after 35°, the input current increases rapidly to a peak of 400 A, and after reaching the peak, the acceleration begins to drop to 90 A.
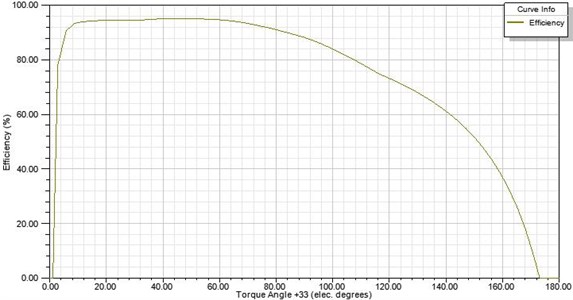
The relationship between efficiency and torque angle is shown in Fig. 17. We can see that the efficiency of the motor rises linearly to 95 % after starting and slowly decreases after 60°, because the rotor is sensitive to the magnetic field when it is in the middle torque angle.
As shown in Table 3, through the ANSOFT Maxwell software to solve the driving motor calculation, the results of the simulation can be compared with the calculated data after the previous section of the model analysis.
Fig. 16Relationship between input current and torque angle
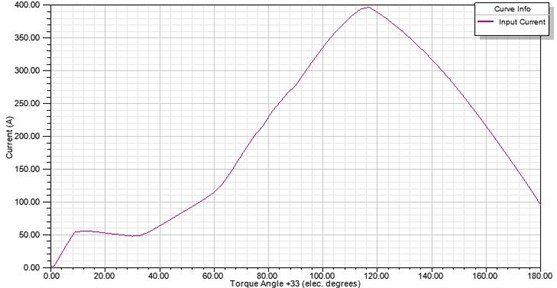
Fig. 17Relationship between efficiency and torque angle
As can be seen from Table 3, there are different between the calculated and simulated data, but they are still within the allowable error range. Because the driving motor is used to simulate the model and there are artificial selection of various coefficients about the calculation of many times, the results of both are necessarily biased. Slight deviation on the overall design of the driving motor is not much impact. In contrary, it is a good test of the design of the driving motor's overall parameter, which can meet the design performance requirements.
Table 3Comparison of calculated and simulated data
Project | Calculate data | Simulation data |
Rated efficiency | 92.79 % | 94.78 % |
Rated torque / Nm | 63.66 | 63.64 |
Core loss / W | 240.43 | 262.61 |
5. Conclusions
1) According to the vehicle performance parameters of hybrid electric vehicles to calculate and determine the design of the driving motor, the PMSM power parameters from the common hybrid system and the driving motor system. The basic parameters of the motor design were obtained by theoretical analysis of the other main parameters of the driving motor.
2) According to the electromagnetic field theory and the driving motor working principle, the size of the PMSM was calculated and determined, as well as stator and rotor size, magnetic circuit structure and the fixed rotor gap size.
3) The overall performance parameters and partial characteristic curves of the driving motor were obtained. The different states of the driving motor model under transient no load and load were analyzed by ANSOFT Maxwell. Simulation results verify that there were difference between the overall performance parameters and partial characteristic curves of the driving motor. It was proved that the design of the driving motor system was reliable and accurate.
References
-
Ren H., Zhang R. Research and development of in-wheel motor drive technology. Journal of Chongqing University of Technology, Vol. 29, Issue 7, 2015, p. 10-18.
-
Chen Q., Liao C., Ouyang A., Li X., Xiao Q. Research and development of in-wheel motor driving technology for electric vehicles. International Journal of Electric and Hybrid Vehicles, Vol. 8, Issue 3, 2016, p. 242-254.
-
Li H. Research on matching and energy management of plug-in hybrid electric vehicle. Agricultural Equipment and Vehicle Engineering, 2017.
-
Liu M., Gu F., Huang J., Wang C., Cao M. Integration design and optimization control of a dynamic vibration absorber for electric wheels with in-wheel motor. Energies, Vol. 10, Issue 12, 2017, p. 2069.
-
Huang B., Zou Y. Calculation and analysis of key parameters of drive motor for pure electric vehicle. South Agricultural Machinery, Vol. 48, Issue 11, 2017, p. 138-13.
-
Sun B., Gao S., Wang P., Li J., Li Y. A research on torque distribution strategy for dual-motor four-wheel-drive electric vehicle based on motor loss mechanism. Automotive Engineering, Vol. 39, Issue 4, 2017, p. 386-393.
-
Xiao P., Wang J., Wang M., Nie B., Du P. Research on electromagnetic interference prediction method of motor and its drive system under field circuit multi coupling. Journal of Electronics, Vol. 35, Issue 2, 2017, p. 325-431.
-
Baitade A., Chopade S. Harmonic reduction, power factor improvement and speed detection for 3-phase induction motor drive system. IEEE Advances in Signal Processing, 2016, p. 406-411.
-
Yang Y., Peng H., Wang Q. Common model EMI prediction in motor drive system for electric vehicle application. Journal of Electrical Engineering and Technology, Vol. 10, Issue 1, 2015, p. 205-215.
-
Guo Q., Liu H., Peng D. Current source inverter fed electric vehicle motor drive system with high performance. Electric Machines and Control, Vol. 19, Issue 5, 2015, p. 74-80+89.
-
Chen X., Chen X. K. Research on a novel vehicle charger of hybrid electric vehicle. Electric Drive Automation, Vol. 37, Issue 6, 2015, p. 21-25.
-
Qin D., Yang G., Liu Y., Liu Y. A research on energy consumption optimization control strategy for plug-in hybrid electric vehicle. Automotive Engineering, Vol. 37, Issue 12, 2015, p. 1366-1370.
-
Yan D., Chen S. Performance compare of driving motors on EV. Auto Electric Parts, Vol. 2, 2004, p. 4-6.
-
Tian G. Key technology of hybrid electric vehicle. Automobile Technology, Vol. 1, 2002, p. 8-11.
-
Wang X., Gao P., Zhao Y. Key Technology of high power density motors in electric vehicles. Transactions of China Electrotechnical Society, Vol. 30, Issue 6, 2015, p. 53-59.
-
Wang T., Wang K., Lin C. Model and simulation for hybrid electric vehicle based on bond graph. Journal of Hebei University, Vol. 37, Issue 4, 2017, p. 419-425.
-
Chen Q., Shu H., Chen L. Simulation analysis of cogging torque of permanent magnet synchronous motor for electric vehicle. Journal of Mechanical Science and Technology, Vol. 26, Issue 12, 2012, p. 4065-40718.
-
Barba P., Bonislawski M., Palka R., Paplicki P., Wardach M. Design of hybrid excited synchronous machine for electrical vehicles. IEEE Transactions on Magnetics, Vol. 51, Issue 8, 2015, p. 8107206.
About this article

The authors would like to thank anonymous reviewers for their helpful comments and suggestions to improve the manuscript. This research was supported by the National Natural Science Foundation of China (Grant No.51565011) and the Foundation of Educational Department of Jiangxi Province (Grant No. GJJ190305).
