Abstract
This paper derived the expression to estimate the effective line moment mobility of a non-deterministic thin plate under moment excitation by a piezoelectric patch actuator. The piezoelectric patch actuator is assumed to generate purely line moments at each of its edges and regarded as a finite number of point moments acting on an infinite plate, which is achieved by integration method. The theoretical model is validated using MATLAB simulation and compared with experimental measurements on a randomized thin plate. The derived effective line moment mobility managed to closely estimate high-frequency response while cutting significant computational time and resource. Results from this study can be used in many applications ranging from vibration isolation where power transmission between the isolator with an area distribution and its host structure can be determined more accurately, and to design the optimal shunt circuit of a piezoelectric shunt damper for maximum power dissipation in order to reduce vibration of a non-deterministic thin plate.
1. Introduction
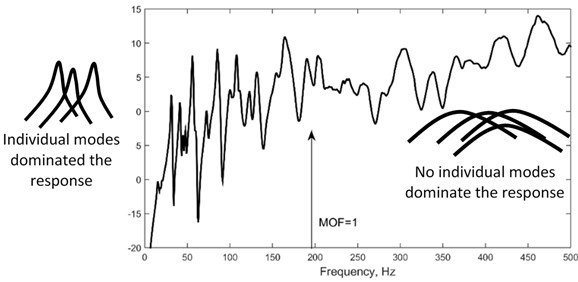
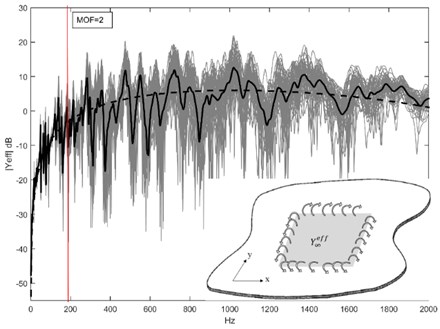
Non-deterministic substructures (Non-DS) are structures that are subjected to short wavelength, vibrates at the high-frequency range and produce a response that cannot be determined using a deterministic method. The term ‘high’ in high-frequency vibration is not merely numerical; it implies that the frequency range extends to many times the fundamental natural frequency of a structure under consideration. In Statistical Energy Analysis (SEA), modal overlap factor (MOF) is used to quantify the degree of overlap in modal response, i.e. the ratio of the half-power bandwidth to the local average interval between natural frequencies [1]. Hence:
where is the modal density, is the modal loss factor, frequency in rad/s, is the surface area of the structure, , and are the density, thickness and the flexural rigidity of the structure, respectively. At low-frequency range (1), individual modal responses are distinctly visible therefore response can be effectively simulated using the conventional finite element method (FEM). The mid-frequency range (1 2) is when the modal response is beginning to overlap and 2 is the high-frequency range where: (i) the vibration response is increasingly sensitive to uncertainties [2, 3] and (ii) no distinct resonant peaks are visible in the response since the modal responses are combined to be broader peaks (Fig. 1). Additionally, vibrations at higher frequency range has much smaller wavelength than the lower modes, which means i) higher number of degrees of freedom is needed to model the response that requires high computational time and cost, ii) the wave can efficiently propagate through smaller cracks in structures and later intensifies the damage [4]. The needs for Non-DS vibration control is therefore important, however scarce due to the complexity of modelling and implementation. [5]
Fig. 1Frequency response function of a rectangular plate to show modal overlap factor, MOF
Piezoelectric (PZT) patch transducers have received significant attention for vibration analysis and control due to its unique direct and inverse PZT effect, making it possible to be used as actuator or sensor, with an addition of its small-volume, high-strength and high-stiffness properties. Connecting the terminals of a PZT patch (in sensor mode) to an external electrical circuit is called shunting, which capable of extracting vibration energy from the host structure and dissipate the energy through Joule heat, i.e. provide damping to the system [6, 7]. For this, the shunt circuit needs to be designed such that maximum power dissipation from the host structure can be achieved, usually through impedance matching technique.
The concept of mobility is normally used in the study of vibration isolation, particularly in determining the characteristics of power transmission over the contact region between the isolator and the host structure. Similarly, this knowledge can be applied to the concept of designing the optimal shunt circuit for PZT shunt damping; with the goal to maximize energy dissipation from a non-deterministic substructure [8]. In classical studies, the connection between the isolator and host structure is assumed to be point-like with the assumption that the excitation area is less than approximately one-tenth of a wavelength [9, 10]. For the apparent reason, this assumption is not accurate for PZT patch transducers in which the connection area generally has dimensions comparable to the governing wavelength and therefore has more complicated spatial distribution at the higher excitation frequency.
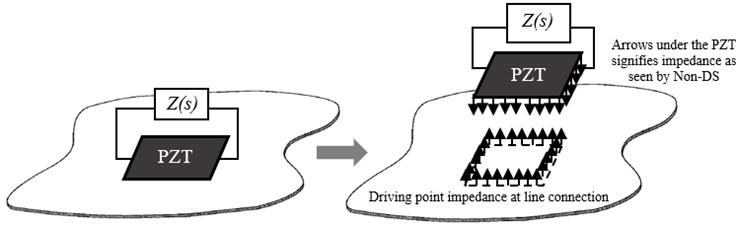
Fig. 2A shunted PZT patch acting on a non-deterministic plate. Impedance, as seen by the Non-DS, needs to be known to design the optimal shunt circuit Zs
The concept of surface mobilities has been introduced and derived throughout the years to better approximate power transmission between the contact region of source and receiver. Hammer and Petersson in [11] introduced the concept of strip mobility to investigate power transmission to a thin plate excited by transverse strip excitation. Later, Norwood et al. [9] have developed the concept of surface mobility on a circular contact area using time-averaged input power and effective mobility. The work was extended to square-shaped contact area by Li et al. in [12] and Dai et al. in [13] by using a discretized model to find the effective point mobility and the corresponding surface mobility. In this paper, a multi-point connection model is employed through integration method to determine the effective line mobility of an infinite thin plate excited by line moments induced by a PZT patch actuator. For this, the PZT patch is assumed to generate purely line moments at each of its edges when attached to a host structure.
2. Modal model for randomized thin plate excited by a piezoelectric patch actuator
A thin plate attached with a PZT patch actuator as moment exciter is taken as a benchmark model for simulation studies. The PZT patch actuator is assumed to generate line moments only (no transverse force), along its four edges [14, 15]. A number of distributed point masses are introduced and located randomly on the thin plate to create uncertainties in the system i.e. making it a Non-DS. The PZT constitutive equation is:
where is stress vector, is the vector of electrical displacement, is the modulus of elasticity matrix, is the piezoelectric coupling coefficient and relates the stress to the applied electrical field, and is the dielectric permittivity matrix. The superscript , and indicates that the parameter was measured at constant electric field (short circuit) and strain, and matrix transpose, respectively. is strain and is electric field. For an isotropic, two-dimensional element:
where is a vector containing PZT strain coefficients, is [3×3] diagonal matrix consists of dielectric permittivity at constant stress, is Young’s modulus, is Poisson’s ratio, is voltage applied to the PZT patch, and is thickness of the patch. Lagrange equation is employed to obtain the total equation of motion for the thin plate excited by a PZT patch actuator:
where , and and are the total kinetic and potential energies of the system, respectively and is the modal coordinate. The total kinetic energy of the randomized thin plate attached with a PZT patch is:
where is transverse displacement, is the density of the PZT actuator, is the area of the PZT patch and the term is a product of Heaviside function which takes care of the presence of PZT patch on the plate. The term is mass per unit area of the point masses and the delta function takes care of the spatial distribution of the point masses on the plate. The total potential energy of the system has contributions from the thin plate and PZT patch. The integration of product of stress and strain w.r.t volume of the system is:
where:
where is the shifted neutral axis measured from the plate center due to the single patch attachment. , and are Young’s modulus, thickness and Poisson’s ratio of the plate, respectively. Integrating the product of Heaviside function and partial derivative for the last term in Eq. (11) will show that the PZT patch induces line moment along its edges in the following form:
where and represent the induced bending moment per unit length along the and -axis respectively. The terms and signify the line moment along x and y-direction on the edge of the patch, respectively. Since a simply-supported plate is used, the deflection of the plate during vibration can be assumed as the double series:
where is the modal coordinate, and are the length and width of the thin plate. The mobility between angular velocity at a point of the thin plate when excited by the induced line moment by PZT actuator are [15]:
where and , represent the th and th element of the total modal mass and total complex modal stiffness; is used to account for structural loss where and is modal loss factor of the plate. , , and are the shape functions for line moment at each of the edge of the patch. is the amplitude of induced bending moment by PZT actuator. is the shape function for angular velocity i.e. first derivative of Eq. (17) with reference to and , respectively, i.e.:
Assuming the PZT patch is isotropic i.e. and therefore has the same magnitude for both and directions:
Eqns. (18) to (21) can be simplified as:
where is total the shape function of the line moment at each of the PZT edges which can be written as follows:
The angular velocity at one point on the plate due to the excitation of all the line moments is, therefore:
Therefore, the modal model for effective point mobility at th connection on a thin plate under moment excitation by a PZT patch actuator, assuming the moment excitation point is uniform along the line is:
3. Derivation of effective line moment mobility on an infinite thin plate
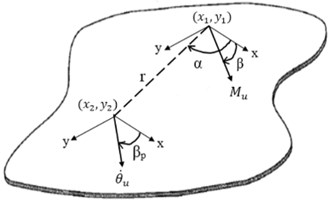
To acquire the effective line moment mobility, we must first derive the effective point moment mobility; that is the resulting angular velocity at one point on the plate by excitation moments from all connection points. Work by Ljunggeren in [16] had derived effective point mobility from expressions for point-excited fields where a source in the form of a force applied along an infinite line can be regarded as infinite number of point forces. Reasonably, one can acquire effective point moment mobility generated by a finite line moment on an infinite thin plate by following the same principle i.e. doing a definite integration of the angular displacement due to a point moment along the length of the line moment. The angular displacement at position , in response to a couple of point moment with orientation which acts on a rigid indenter fixed to the plate, is given by [10] as:
where is the second kind of Hankel function of the th order, is the second kind of modified Bessel function of the th order, is the bending wavenumber, is the distance between the applied force and measured velocity, . The term is the angle between axis and moment arm, . is the angle between -axis measured velocity and is the angle between -axis and the radius line that connects point and . These notations are shown in Fig. 3. The angular displacement at a point resulting from line moment excitation with length - can be taken as:
where and are finite numbers which account for the length of the line moment and is the distance between the response point and the moment excitation along the line:
Since angular velocity is taken at one fixed point (), then the coordinate of the point moment will be the variable to be integrated.
Fig. 3Sign conventions for resulting angular velocity at point (x2, y2) subjected by a point moment excitation at (x1, y1)
The effective point moment mobility, for the infinite thin plate at point on the line moment is therefore:
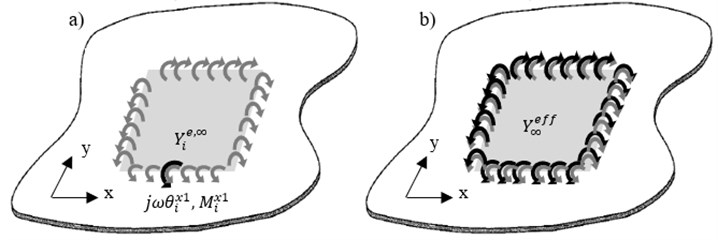
where , is the excitation moment at th connection point. Extending the same method to an infinite plate attached with a PZT patch actuator and considering pure line moments are induced at the edges as depicted in Fig. 4, the effective point moment mobility at point can be evaluated by considering the line moments separately and by using Eq. (31).
Fig. 4Induced line moments and resulting angular velocity, θ˙x1 on the PZT patch
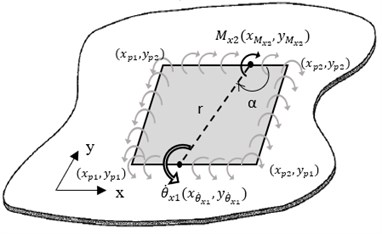
Assuming the moment excitation is uniform along the line, the effective line moment mobility, can be obtained as a summation of for all connection points. In this case, the connection point is assumed to be along the length of the edges of the PZT patch or can be simply put as integration along the patch length in and direction:
The solutions for Eqs. (31) and (32) are obtained numerically using computational software. Since the mobility of an infinite plate gives approximately the mean response of the mobility of a finite structure [17], Eqns. (31) and (32) will be validated with a randomized finite model (via Monte Carlo simulation) and with experimental studies shown in a later section. For comparison with the derived modal model, the effective point moment mobility for finite plate as in Section 1 is therefore Eq. (27), and the corresponding effective line moment mobility can be derived as:
That is by integrating Eq. (27) w.r.t patch dimension for each of the edges.
Fig. 5Illustration of a) effective point moment mobility at one point on line x1, b) effective line moment mobility of the infinite thin plate
4. Simulation Studies
This section presents simulation studies done using MATLAB for validating the effective point moment mobility and effective line moment mobility for infinite plate as derived in Eqs. (31) and (32), by comparing them with effective point and line moment mobility on a randomized thin plate (Eqns. (27) and (33)). The mobility of an infinite plate can be approximated to the mean response of the mobility of a finite structure via Monte Carlo simulation. Therefore, 50 data ensembles for the finite model are taken and later averaged out and compared with the infinite model.
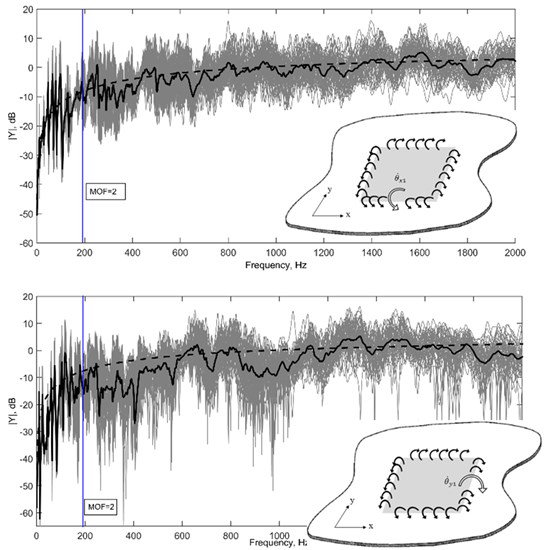
Fig. 6 and Fig. 7 showed the comparison between finite and infinite effective point and effective line moment mobility, respectively. The estimation curves showed good agreement with the average responses for each case. It is important to note that the randomized finite plate still exhibit distinct modes at range 2, therefore the response is still strongly dependent on the location of measurement and boundary conditions of the structure. At 2 range, broader peaks can be seen, signifying high modal overlapping of the response. At this range, the response is highly sensitive to uncertainties, however boundary condition will have no effect and the average response will appear the same regardless of where measurement is taken. A smoother average response for the randomized plate can be achieved at this range by taking a higher number of ensemble for Monte Carlo simulation.
From this study, it is shown that the effective line moment of a non-deterministic thin plate can be estimated using double integration of infinite point mobility; i.e. integrating point moment mobility to get effective point moment mobility, and integrating the effective point moment mobility to get the effective line moment mobility. It is also worth to mention that the analytical model managed to significantly cut computational time compared to using the finite method via Monte Carlo simulation which requires high number of degrees of freedom for modal summation and large number of ensembles in order to model high frequency range response i.e. ~4 hours for Monte Carlo simulation vs. ~1 minute.
Fig. 6Effective point moment mobility at a point along x-axis (top) and y-axis (bottom) on a randomized plate as derived in Eq. (27) (grey, 50 ensembles) and its average (solid black), and the effective point moment mobility for infinite thin plate as in Eq. (31) (dashed black)
5. Experimental measurements
5.1. Measurement of angular velocity at a point on a randomized thin plate
The purpose of this experiment is to verify the effective point moment mobility derived in Eq. (31), by measuring angular velocity at one edge of a PZT patch actuator acting on a randomized thin plate. Fig. 8 illustrates the sign convention to obtain angular velocity at one point on the plate by measuring the transverse velocity, using laser point vibrometer, and using the relationship:
In which the choice of should be a fraction of the bending wavelength of the highest frequency to be considered.
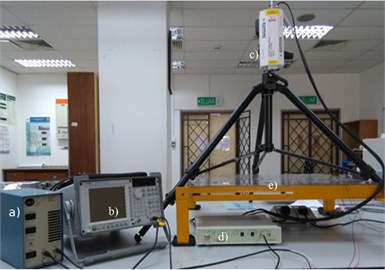
A thin rectangular aluminum plate (AA 1100) is rested on a frame to achieve simply-supported boundary conditions on all its edges. A piezoelectric patch model PPA1011 from MIDE is bonded on the plate with epoxy adhesives. Properties for both the plate and piezoelectric patch are compiled in Table 1. A laser point vibrometer (LP01) is used to measure transverse velocity at one point on the plate, shown in Fig. 8. A number of point masses are distributed on the plate using magnets to recreate uncertainties and randomization conditions to the system. For every experimental run, the location of these point masses will be randomized and later all the responses will be averaged to obtain the ensemble average. The total mass of these point masses is about 5 % of the mass of the plate. Fig. 9 shows the ensemble average of angular velocity measured at one point at the edge of the patch along . Ten ensembles are taken and averaged out for both simulation and from the experiment, and then compared on the same graph.
Fig. 7a) Absolute values, b) real values and c) imaginary values of effective line moment mobility of the randomized thin plate as in Eq. (33) (grey, 50 ensembles) with their averages (solid black). These are estimated with the effective line moment mobility for infinite thin plate as derived in Eq. (32) (dashed black)
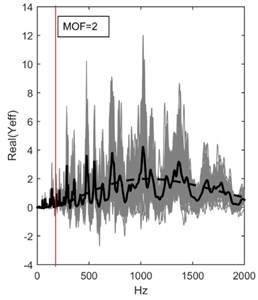
a)
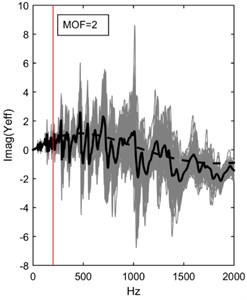
b)
c)
Table 1Properties of plate and piezoelectric patch
Properties | Plate (AL 1100) | PZT patch (PZT-5H) |
Young’s modulus | 80×109 Pa | 63×109 Pa |
Density | 2710 kg/m3 | 7800 kg/m3 |
Length×Width×Thickness | 0.8×0.6×0.007(m) | 7.1×2.54×0.071 [18] |
Poisson’s ratio | 0.33 | 0.31 |
Piezoelectric constant, | – | –300×10-12 (V/m) |
Loss factor, | 0.0336 | – |
The frequency range of interest is when of this system is larger than 2, which lies at >190 Hz using Eq. (1). From Fig. 9, it is visible that the estimation derived in Eq. (31) (plotted in black (–)) estimates the 2 range quite well with both experimental measurement and simulation. It is important to note that the response cannot be precisely the same due to uncertainties at high frequency and that we are only interested in the average amplitude and pattern for estimation purpose. A bit mismatch in the earlier frequency range can be seen which could be caused by the different stiffness of the system due to the attachment of piezoelectric patch and imperfect replication of simply-supported boundary condition. However, this shortcoming does not affect our study interest since boundary condition does not have any implication to the response at 2. The above result can be improved by using a higher number of ensemble to get a better average response.
Fig. 8Sign convention for angular velocity measurement on the plate (+ve x-axis is out of paper)
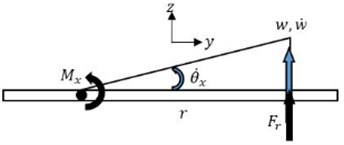
Fig. 9Comparison of angular velocity at one point on the randomized plate. Averaged response from simulation (red, –); Averaged response from experiment (black, –) and theoretical curve using Eq. (31) (black, –)
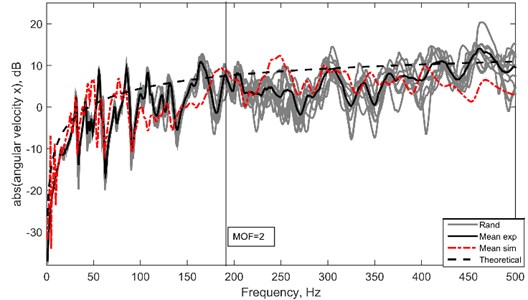
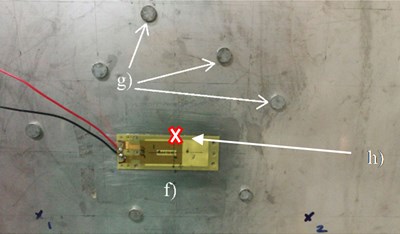
Fig. 10a) The experimental setup: a) power amplifier, b) digital signal analyzer, c) laser point vibrometer, d) laser controller, e) thin plate on a simply-supported frame. b) Closed-up image of a section of the thin plate to show the attachment of the f) PZT patch actuator, g) distributed point masses and h) point of measurement
6. Conclusions
The effective point mobility and the effective line mobility of a non-deterministic thin plate under moment excitation of a PZT patch actuator can be approximated to be the integration of point moment mobility along patch dimension as derived in Eq. (31) and integration of the effective point mobility as derived in Eq. (32), respectively. Results from this study can be used to design the optimal shunt circuit of a PZT patch on a non-deterministic thin plate via the impedance matching method, where impedance, as seen by the Non-DS due to the PZT patch, is needed, ideally to achieve maximum power dissipation from the non-deterministic thin plate. Theoretically, the same impedance should give the optimal circuit for high-frequency vibration-based energy harvesting for maximum power transfer. Furthermore, while it is computationally extensive to simulate high-frequency response using the finite element method, the analytical solution derived in Eq. (31) and Eq. (32) has managed to significantly cut computational time i.e. ~4 hours using Monte Carlo simulation vs. ~1 minute.
References
-
Fahy F. J., Gardonio P. Sound and Structural Vibration: Radiation, Transmission and Response. Academic Press, 2007.
-
Manohar C., Keane A. Statistics of energy flows in spring-coupled one-dimensional subsystems. Philosophical Transactions of the Royal Society of London, Series A: Physical and Engineering Sciences, Vol. 346, 1994, p. 525-542.
-
Langley R. S. Mid and high-frequency vibration analysis of structures with uncertain properties. 11th International Congress on Sound and Vibration, St. Petersburg, Russia, 2004.
-
Cicirello A., Langley R. S. Efficient parametric uncertainty analysis within the hybrid finite element/statistical energy analysis method. Journal of Sound and Vibration, Vol. 333, 2014, p. 1698-1717.
-
Muthalif A. G., Langley R. S. Active control of high-frequency vibration: optimisation using the hybrid modelling method. Journal of Sound and Vibration, Vol. 331, 2012, p. 2969-2983.
-
Berardengo M., Thomas O., Giraud Audine C., Manzoni S. Improved resistive shunt by means of negative capacitance: new circuit, performances and multi-mode control. Smart Materials and Structures, Vol. 25, 2016, p. 075033.
-
Moheimani S. R. A survey of recent innovations in vibration damping and control using shunted piezoelectric transducers. IEEE Transactions on Control Systems Technology, Vol. 11, 2003, p. 482-494.
-
Liang J., Liao W.-H. Impedance modeling and analysis for piezoelectric energy harvesting systems. IEEE/ASME Transactions on Mechatronics, Vol. 17, 2012, p. 1145-1157.
-
Norwood C., Williamson H., Zhao J. Surface mobility of a circular contact area on an infinite plate. Journal of Sound and Vibration, Vol. 202, 1997, p. 95-108.
-
Cremer L., Heckl M., Petersson B. A. Structure-Borne Sound: Structural Vibrations and Sound Radiation at Audio Frequencies. Springer, 2005.
-
Hammer P., Petersson B. Strip excitation, part I: strip mobility. Journal of Sound and Vibration, Vol. 129, 1989, p. 119-132.
-
Li Y., Lai J. Prediction of surface mobility of a finite plate with uniform force excitation by structural intensity. Applied Acoustics, Vol. 60, 2000, p. 371-383.
-
Dai J., Lai J., Li Y., Williamson H. Surface mobility over a square contact area of an infinite plate: experimental measurements and numerical prediction. Applied Acoustics, Vol. 60, 2000, p. 81-93.
-
Sonti V., Kim S., Jones J. Equivalent forces and wavenumber spectra of shaped piezoelectric actuators. Journal of Sound and Vibration, Vol. 187, 1995, p. 111-131.
-
Aoki Y., Gardonio P., Gavagni M., Galassi C., Elliott S. Parametric study of a piezoceramic patch actuator for proportional velocity feedback control loop. Journal of Vibration and Acoustics, Vol. 132, 2010, p. 061007.
-
Ljunggren S. Line mobilities of infinite plates. The Journal of the Acoustical Society of America, Vol. 86, 1989, p. 1419-1431.
-
Ungar E. E., Dietrich C. High-frequency vibration isolation. Journal of Sound and Vibration, Vol. 4, 1966, p. 224-241.
-
Abreu G. D., Ribeiro J., Steffen Jr V. Finite element modeling of a plate with localized piezoelectric sensors and actuators. Journal of the Brazilian Society of Mechanical Sciences and Engineering, Vol. 26, 2004, p. 117-128.
Cited by
About this article

This work was partially supported by the Fundamental Research Grant Scheme (FRGS15-165-0406) from the Ministry of Higher Education Malaysia.
