Abstract
In order to comprehensively evaluate the working state and safety performance of the bridge plate rubber bearing (PRB), the basic principle and method of SVM in machine learning theory (Support Vector Machine) was introduced in this paper. Firstly, the performance indices (such as the average compression stress, tangent value of the shear angle and the rotation angle of the PRB) were analyzed and calculated through its finite element model considering the different working conditions (axial compression, shear deformation and the rotation deformation of the PRB). Subsequently, considering the relevant indices affecting the safety performance of the PRB, the Pearson Correlation Coefficients (PCC) were calculated by SVM method for assessing the internal correlation of the performance indices of the PRB for different cases, respectively. The threshold values of the influential factors for different cases considering the PCC and the weight coefficient were obtained for grading the working state of the PRB as five levels. Moreover, in order to verify the validity and suitability of the evaluation of the working state of the plate rubber bearing by the SVM method, three apparent indices for grading the performance level of the PRB such as the crack, the undistributed spalling deformation and the dislocation of the PRB were analyzed and compared with the qualitative descriptions and the quantitative values. Finally, the corresponding threshold values for grading the performance levels of the PRB working states were proposed. It was shown that the SVM based evaluation method for the PRB is feasible and convenient, especially for the bridges with real-time monitoring devices to get the response data of the PRB.
1. Introduction
The plate rubber bearing is a kind of bridge bearing commonly used in highway bridge structures. It is widely used in domestic and foreign engineering because of its simple structure, easy processing and manufacturing, low steel consumption, low cost, and convenient installation. The main function of the bridge support is to reliably transmit the reaction force of the upper structure of the bridge to the abutment, and at the same time meet the requirements of the displacement and rotation angle of the beam structure. Therefore, it is impossible to work on the bridge. The support is accurately and objectively and reliably evaluated. Therefore, the use of a smart monitoring method and access to the working status information of the support and the evaluation of the safety level of the support have a crucial impact on the overall use of the bridge rubber bearing during the operational phase of the bridge [1-4].
2. Finite element simulation of bridge plate rubber bearing
This simulation analyzes the stress state of the bridge plate rubber bearing by the finite element method through the constitutive relationship of the rubber material. The evaluation index of the bridge plate rubber bearing is determined by combining the relevant bridge evaluation specifications [3].
2.1. Rubber constitutive relationship
Rubber is a typical superelastic material that is considered to be isotropic and incompressible (Poisson’s ratio ). Based on the method of continuum mechanics, the strain energy density function is used to describe the constitutive relation of the mechanical properties of rubber materials. The Yeoh model is suitable for simulating the large deformation mechanical behavior of carbon black filled NR. In this paper, other mechanical behaviors are simulated by uniaxial tensile test data. The ANSYS finite element analysis software divides it into one to five equal strain energy density function models, as follows [5]:
The typical three parameters are:
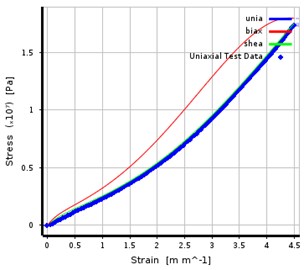
The uniaxial tensile test was carried out by the rubber of the actual bridge plate rubber bearing, and the Yeoh model fitted the stress and strain curves. The results are shown in the figure.
Fig. 1Rubber triaxial stress-strain curve
2.2. Finite element model
The plane stress model of the bridge plate rubber bearing is established by Ansys 18.2. The main model parameters are as follows [1]:
The calculation model uses the plane strain PLANE183 to simulate the deformation results of the bridge plate rubber bearing.
The constitutive model of the rubber material adopts a three-parameter Yeoh model with an elastic modulus of 2.06×10⁵ MPa and a Poisson’s ratio 0.49775.
The constitutive relationship of the stiffened steel plate adopts a double-fold line model, the elastic modulus 2.06×10⁵ MPa, the yield strength is 345 MPa, and the Poisson’s ratio is 0.3.
The contact unit and the target unit adopt CONTA172 and TARGE169 respectively, the contact type is defined as the binding contact, the contact function assumes the pure penalty function, and the penetration tolerance is set to 1×10⁹ m.
2.3. Finite element analysis of bridge plate rubber bearing under normal use
Under regular use, the average compressive stress of ∅200×42 mm bridge plate rubber bearing under design stress state is 10 MPa, the tangent value of shear angle is 0.5 (excluding braking force), 0.7 (accounted for Braking force), the corner tangent value 0.0075.
The table below shows the stress, strain and slip and deformation data of the bridge-plate rubber bearing-related components under axial compression, shear deformation, rotation, and the most unfavorable conditions.
Table 1Bearing stress/deformation maximum
Condition | Item and unit | Pressure | Shear | Rotation | Most unfavorable condition | ||
No braking force | braking force | ||||||
Calculated load | MPa | 10 | 4 | 4 | 10 | 10 | |
– | 0 | 0.5 | 0.7 | 0 | 0.7 | ||
– | 0 | 0 | 0 | 0.0075 | 0.0075 | ||
rubber | Von-Mises stress | MPa | 1.327 | 3.733 | 5.867 | 2.076 | 10.746 |
Shear stress | MPa | 0.718 | 1.973 | 2.842 | 1.065 | 3.966 | |
Equivalent strain | – | 0.350 | 0.717 | 0.895 | 0.491 | 1.1281 | |
Steel plate | Von-Mises stress | MPa | 46.663 | 88.128 | 109.33 | 28.51 | 279.5 |
Contact | Shear stress | MPa | 1.419 | 2.439 | 3.389 | 1.065 | 6.869 |
Maximum slip | mm | 0.014 | 0.019 | 0.020 | 0.0176 | 0.024 | |
Bearing deformation | Vertical | mm | 0.312 | 2.143 | 2.559 | 0.868 | 2.246 |
Horizontal | mm | 0.866 | 21.006 | 29.413 | 1.166 | 29.318 | |
Total deformation | mm | 0.874 | 21.006 | 29.413 | 4.925 | 29.625 | |
3. Determination of impact factor
The Pearson correlation coefficient is a statistic used to reflect the degree of linear correlation between two variables. Let be the ith index variable, be the Pearson correlation coefficient between the th index variable and the th index variable population as:
where is the covariance between the index variable and the th index, is the population standard deviation of the ith index variable, and is The overall mean of the th indicator variable.
Let be the th component of the th index variable, be the Pearson correlation coefficient between the th index variable and the th index variable sample, and choose between the two index variable samples. The Pearson correlation coefficient is defined as:
According to the Pearson correlation coefficient analysis, the Pearson correlation coefficient are shown in Table 2.
Expressed as a matrix: .
It can be seen that the order of correlation with the most unfavorable working conditions is from high to low, rotating condition, axial pressure working condition, non-braking shearing condition and braking shearing condition, and the Pearson correlation coefficient is more significant than 0.95. It shows that the rotating condition, the axial pressure working condition, the non-braking shearing condition, the braking, and shearing working condition are all strongly correlated with the most unfavorable working conditions. Considering the most unfavorable working conditions is the combination of the rotating working condition, the axial working condition, the non-braking force shearing condition, and the braking force-containing shearing condition, defining the turning condition, the axial pressure working condition, and the non-braking force. The average weighting factor of the shearing condition and the braking condition with the braking force for the most unfavorable working conditions:
The weighting factor is: .
Then the dot product of the weight and the correlation coefficient is used to obtain the influence factor of each working condition on the most unfavorable working condition:
It can be concluded that the factors affecting the most unfavorable working conditions of the plate rubber bearing are: braking shear deformation condition, no brake shear deformation condition, rotating working condition, and axial working condition. According to the influence factor size, the working state of the support under different working conditions is divided into five levels, as follows [5]:
4. SVM-based evaluation of the normal work of bridge plate rubber bearings
SVM is a new approach to machine learning for small samples. The basis of the support vector machine is to find the optimal classification hyperplane under linearly separable conditions. First, give a sample set [6]:
where: is the data; is the category to which the data belongs. If the hyperplane equation reaches the criterion of the optimal classification plane (i.e., the samples are correctly separated in the case of the most considerable classification interval), the problem of solving the optimal classification plane can be converted into the following objective function and constraints. condition:
where: is the weight vector; is the offset vector. In many cases, some samples are often not correctly classified. To ensure the accuracy of the classification, the relaxation factor , , is introduced here, then the optimization problem can be expressed as:
where: is the penalty factor. Due to the contradiction between the complexity of the algorithm and the classification accuracy, the compromise is achieved by adjusting the size of the penalty factor. The above formula becomes a quadratic programming problem, and the optimal solution of the problem is obtained by finding the saddle point of the Lagrangian function. It is known from the Karush-Kuhn-Tucker (KKT) theorem that the initial problem of solving the optimal hyperplane is transformed into solving the quadratic optimization problem.
By solving the function in the above equation, the aforementioned Lagrangian operator can be obtained, and then the offset can be calculated by any known support vector and its corresponding . For the given sample of unknown type, calculate to determine the category to which the sample belongs. For the classification of the working state of the support, the SVM setting type is C-SVC, the kernel function type is Gaussian radial basis kernel function is , and the degree in the kernel function is 3, The gamma function in the kernel function takes 1/3, the coef0 in the kernel function takes 0, the loss function cost takes 1, and the allowable termination criterion epsilon is 0.001.
Table 3Data sample
Input column | Output column | ||
Pressure | Shear | Rotation | Most unfavorable condition |
0-10 | 0 | 0 | 1 |
0-10 | 0 | 0-0.0075 | 2 |
0-4 | 0-0.5 | 0-0.0075 | 3 |
0-4 | 0.5-0.7 | 0-0.0075 | 4 |
4-10 | 0-0.5 | 0-0.0075 | 4 |
4-10 | 0.5-0.7 | 0-0.0075 | 5 |
10 | 0.7 | 0.0075 | 5 |
5. Forecast result
Using the trained model, it can predict the current value, and the correct rate is 1, indicating that the training model can have a good classification ability for the current working state of the support, and can be cut according to the axial force under different working conditions of the support. The corner gives the current working status level of the support, to achieve the rating of the working status of the support.
Fig. 3Deviation curve
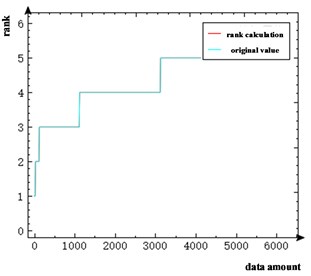
Table 4Column calculation
Pressure | Shear | Rotation | Rank | Correctness |
10 | 0 | 0 | 1 | 1 |
3 | 0.2 | 0 | 3 | 1 |
6 | 0 | 0.003 | 2 | 1 |
6. Conclusions
Through the finite element simulation and analysis of the plate rubber bearing under different working conditions, the stress level of the bearing under different working conditions is obtained, and the Pearson, correlation coefficient method, is used to verify the most unfavorable working conditions and axial working conditions and shearing. Besides, there is a strong correlation between the rotating conditions, and the weight value of the most unfavorable working conditions is taken as the influencing factor of the evaluation of the bearing level. According to the influencing factor, the evaluation grade of the bridge plate rubber bearing is given, combined with the SVM. Theory and method, training and classification of plate rubber bearings, and can be correctly classified according to the evaluation grade, and a new evaluation method for bridge plate rubber bearings is obtained.
References
-
Zhuang Junsheng Bridge Support. China Railway Publishing House, Beijing.
-
Zhou Xiangrong, Wang Qiang, Wang Baozhen A nonlinear viscous superelastic constitutive model based on yeoh function and its application in impact simulation. Journal of Vibration and Shock, Vol. 5, 2007, p. 33-37+151.
-
Huang Jianlong, Xie Guangjuan, Liu Zhengwei Finite element analysis of superelastic rubber material based on Mooney-Rivlin model and Yeoh model. Rubber Industry, Vol. 8, 2008, p. 467-471.
-
Li Zhijun, Ge Fei, Xu Xiuli, Wang Kairui Finite element simulation and experimental study on the performance of plate rubber bearing. Journal of Southeast University (Natural Science Edition), Vol. 43, Issue 6, 2013, p. 1299-1304.
-
Zheng Yi, Jia Jinqing, Shen Xiaojun, Xiong Weishi, Gao Fei, Zhang Yannian Safety Evaluation Method of Bridge Plate Rubber Bearing Based on Extenics. Journal of South China University of Technology (Natural Science Edition), Vol. 40, Issue 9, 2012, p. 160-164.
-
Zhou Zhihua Machine Learning. Tsinghua University Press, Beijing, 2016.
About this article

