Abstract
Stick-slip vibration images of water-lubricated rubber stern bearing are collected by using machine vision technology. Then these images are analyzed by the methods of persistent homology-based machine learning (PHML). During this analysis, the corresponding barcode is obtained by calculating the homology of the simplicial complex of the vibration images, and the topological characteristics of the vibration images are obtained based on the barcode images, then the support vector machine (SVM) learning is used to study the topological features, and finally the classification and identification of the stick-slip vibration of water-lubricated rubber stern tube bearing are completed. The results have shown that the length of the longest 1D Betti number is closely related to vibration value. Based on these data, it is possible to use the warning beep effectively, create an intelligent description of the beep process, and provide a new idea for simulating stick-slip vibration in the stern bearing.
Highlights
- The relationship between loads, speed, and service performance of stick-slip vibration is explored, and the mechanism of stick-slip vibration is revealed, and a new scheme is provided to solve the bottleneck of vibration reduction and noise reduction of the stern bearing.
- By means of PH, the corresponding relationship between stick-slip vibration amplitude of water-lubricated rubber stern bearing and its topological characteristics of the barcode diagram is established.
- The topological features are identified and extracted by ML, and accurate and intelligent research on the vibration sound prediction of the stern bearing is carried out.
1. Introduction
The frictional vibration and noise of water-lubricated rubber stern bearings (hereinafter referred to as stern bearing) affect the concealment, safety, and reliability of underwater vehicles, as well as the comfort of their passengers [1, 2]. Friction vibration noise is a very complex natural phenomenon, which mainly occurs in low speed and heavy load conditions [3-5]. At this time, stern bearings have boundary lubrication or mixed lubrication, and it is difficult to build a water film [6-9]. This causes direct contact between the shaft/rubber bearing friction pair thereby generating vibration in the bearing-shaft system [10]. This friction not only causes severe wear on the system, but also generates frictional vibration, audible noise, and torsional vibration which drive down the reliability and concealability of the ship [11]. There is an intermittent contact between the friction pair of the stern bearing and the shaft, and stick-slip self-excited vibration occurs. Scholars mainly use experimental methods [12, 13] and numerical methods [3, 14-16] to study it. Fuming Kuang and Xincong Zhou [17, 18] use a glass shaft to form a friction pair with a rubber block. To explore the frictional vibration mechanism and process of coupling with torsional vibration, a high-speed camera records the responses of the rubber seal, fixer, and shaft simultaneously. Scholars have done several researches on stick-slip vibration of the stern bearing, but the classification and recognition are still done manual, that is inefficient and can produce inaccuracies or even errors due to the human factor. Using the artificial intelligence to apply the persistent homology (PH) theory to image recognition and classification of stick-slip vibration of the stern bearing using a machine instead of manual operation, the efficiency and accuracy well improved the results. In recent years, the PH [19] has continuously achieved breakthroughs and applications in the fields of large data, artificial intelligence, material genome projects [20-24], medical imaging, and intelligent diagnosis [25], image processing [26-28], etc. Although the PHML was studied and applied, for instance, based on the PH theory, the image barcode was obtained, as well as the topological features and geometric structure information of the image [29]. Then PH and machine learning (ML) for data analysis are to be combined [30], but there are little researches on the stick-slip analysis of stern bearing based on the PHML.
2. PH and SVM theory
2.1. Basic PH principles
The PH is originated Morsel theory, which is a method used to calculate topological features at different spatial resolutions [30]. The PH can detect more continuous features on a wide spatial scale. These features are independent of the filter scale and can better represent the true characteristics of the underlying space.
2.1.1. Simplicial complex
A simplicial complex is a combination of simplexes under certain rules. It can be viewed as a generalization of a network or graph model.
A simplex is the building block for the simplicial complex. It can be viewed as a generalization of a triangle or tetrahedron to their higher dimensional counterparts.
Definition 1. A geometric -simplex is a convex hull formed by affinely independent points , , , …, in the Euclidean space as follows:
A face of -simplex is a convex hull of a nonempty subset. In this paper, it is denoted as .
Geometrically, a 0-simplex is a vertex, a 1-simplex is an edge, a 2-simplex is a triangle, and a 3-simplex represents a tetrahedron. An oriented -simplex is a simplex together with orientation, i.e., the ordering of its vertex set. Simplices are the building blocks for the (geometric) simplicial complex.
Definition 2. A geometric simplicial complex is a finite set of geometric simplices that satisfy two essential conditions:
1. Any face of a simplex from is also in .
2. The intersection of any two simplices in is either empty or shares faces.
The dimension of is the maximal dimension of its simplexes. A geometric simplicial complex is a combinatorial set, not a topological space. However, all the points of that lie in the simplex of aggregate together to topologize them into a subspace of , known as polyhedron of .
Graphs and networks, which are comprised of only vertices and edges, can be viewed as a simplicial complex with only 0-simplex and 1-simplex.
Definition 3. An abstract simplicial complex is a finite set of elements , , ,…, called abstract as vertices, together with a collection of subsets (, ,…, ) called as abstract simplexes, with the property that any subset of a simplex is still a simplex.
For an abstract simplicial complex , there is a geometric simplicial complex which vertices are in one-to-one correspondence with the vertices of and a subset of vertices being a simplex of only if they correspond to the vertices of some simplex of . The geometric simplicial complex is called as the geometric realization of .
2.1.2. Homology
Simplicial complexes , are a summation of , where is the simplicial κ of simplicial complexes , represents a domain modulo 2, all chains on form an Abelian group, called chain group, denoted as .
For the edge operator of simplex , the equation is as follows:
where, means the face obtained by deleting the -th vertex in the simplex. Edge operators can derive an edge homomorphism .
The boundary operator has an important property: the composition operator is zero:
The chain group sequence connected by the boundary operator constitutes a chain complex, as shown below:
The Eq. is equivalent to the inclusion Im , where Im and Ker denote image and kernel. Elements of are called th cycle group, and denoted as . Elements of are called th boundary group, and denoted as . A th homology group is defined as the quotient group of and :
The -th Betti number of the simplicial complexes is a rank of :
Betty’s number is a finite number, because of . The Betti number calculated by the homology group is used to describe the corresponding homology space. In general, the Betty numbers 1, 2, and 3 are the number of connectors, the number of holes surrounded bylines, the number of holes surrounded by faces, and the higher Betty numbers can be deduced by analogy.
2.1.3. Filtration and persistence
A filtration of a simplicial complex is a nested sequence of sub complexes of :
When the simplicial complex is filtrated, it is possible to generate topological attributes for each member in the sequence by deriving the homology group of each simplicial complex. The topological features that are long lasting through the filtration sequence, are appropriate to capture a significant property of the object. Intuitively, non-boundary cycles that are not mapped into boundaries too fast along the filtration are considered possibly involved in major features or persistence. Equipped with a proper derivation of filtration and a wise choice of threshold to define persistence, it is practicable to filter out the topological noise and acquire attributes of interest. The p-persistent th homology group of is defined as:
where and The consequent -persistent th Betti number is . A well chosen promises reasonable elimination of topological noise.
2.1.4. Barcode plots
Barcode plots are used to reflect the topological characteristics of the complex filtration duration of the point cloud set in the process of increasing the connected radius.
It is represented by a collection of finite intervals on the real axis , which can generally be expressed as or , where , . If to draw the Betti interval in a two-dimensional coordinate system, a visual description of PH can be gotten [27]. The traditional output of continuous coherence is a “barcode” plot, as shown in Fig. 1.
Fig. 1PH barcode
a) Homology group changes with 0.05
b) Homology group changes with 0.12
c) Homology group changes with 0.26
d) 0 D barcode
e) 1 D barcode
2.2. SVM algorithm
The SVM [31] is a machine learning method developed on the basis of statistical learning theory, and has been widely used in geotechnical engineering. It has inherent advantages for solving small samples, high dimensionality, nonlinearity, and local minima. However, traditional methods are required to solve a quadratic programming problem, which is often very slow and computationally complex. The SVM transforms the inequality constraints in the SVM into equality constraints, ensuring the accuracy and speed of learning. The derivation of the SVM is as follows:
where, is deviation vector; is weight; Eq. (9) must meet the following constraints:
Define the Lagrange function and solve the maximum condition of the function, which is the minimum condition of Eq. (9). The Lagrange function is:
where, is Lagrange multiplier, the optimal conditions are:
Eq. (12) is transformed into the following linear Eq. (13):
where, , .
According to the above derivation, it can be seen that the SVM converts the inequality constraints in the SVM into equality constraints, and the training process is also transformed into the solution of linear equations, which simplifies the complexity of calculations and ensures the accuracy.
2.3. Selection and establishment of topological features
Under the action of load and water lubrication, the stern bearing block will produce elastic-plastic deformation and stick-slip phenomenon, resulting in chatter. Therefore, it is necessary to find its topological features in the Barcode diagram of PH, and search for useful features from these features, so as to find the vibration characteristics. The features used in the SVM are listed in Table 1.
Table 1 show the 14 features commonly used in the SVM. The second column indicates whether each feature corresponds to a 0-dimensional or a 1-dimensional Betti number. The last column is an explanation of the precise topological significance of this feature. Since the features in Table 1 are divided into 14 items, which are relatively desterned and complex, Table 2 classifies 14 features from a large level and is divided into 3 categories, reflecting the intensity distribution, physical characteristics, and geometric characteristics respectively.
Table 1List of Features used in support vectors [32]
Feature | Betti | Description |
1 | 0 | The sum of the lengths of all 0-dimensional barcode images |
2 | 1 | The sum of the lengths of all 1-dimensional Betti numbers |
3 | 0 | The length of the second longest Betti number is 0 bar |
4 | 0 | The length of the third longest Betti number is 0 bar |
5 | 0 | The sum of lengths of all Betti number is 0 bar except for those that exceed the max filtration value |
6 | 0 | The average length of Betti number is 0 bar except for those that exceed the max filtration value |
7 | 1 | The onset value of the longest Betti number is 1 bar |
8 | 1 | The length of the longest Betti number is 1 bar |
9 | 1 | The smallest onset value of the Betti number is 1 bar that is longer than 1.5 times |
10 | 1 | The average value of the middle point values of all the Betti number is 1 bar that are longer than 1.5 times |
11 | 1 | The sum of the lengths of all 1-dimensional Betti numbers is beyond the filter value |
12 | 1 | The average value of the barcode length of the 1-dimensional Betti number exceeds the filtered value |
13 | 0 | Sum of the number of 0-dimensional barcode graphs |
14 | 1 | Sum of the number of bars in a 1-dimensional barcode graph |
Table 2Categories corresponding to features
Feature | Feature number |
Interaction strength and distribution between units | 1-2 |
13-14 | |
Physical characteristics | 3-6 |
Geometric Features | 7-12 |
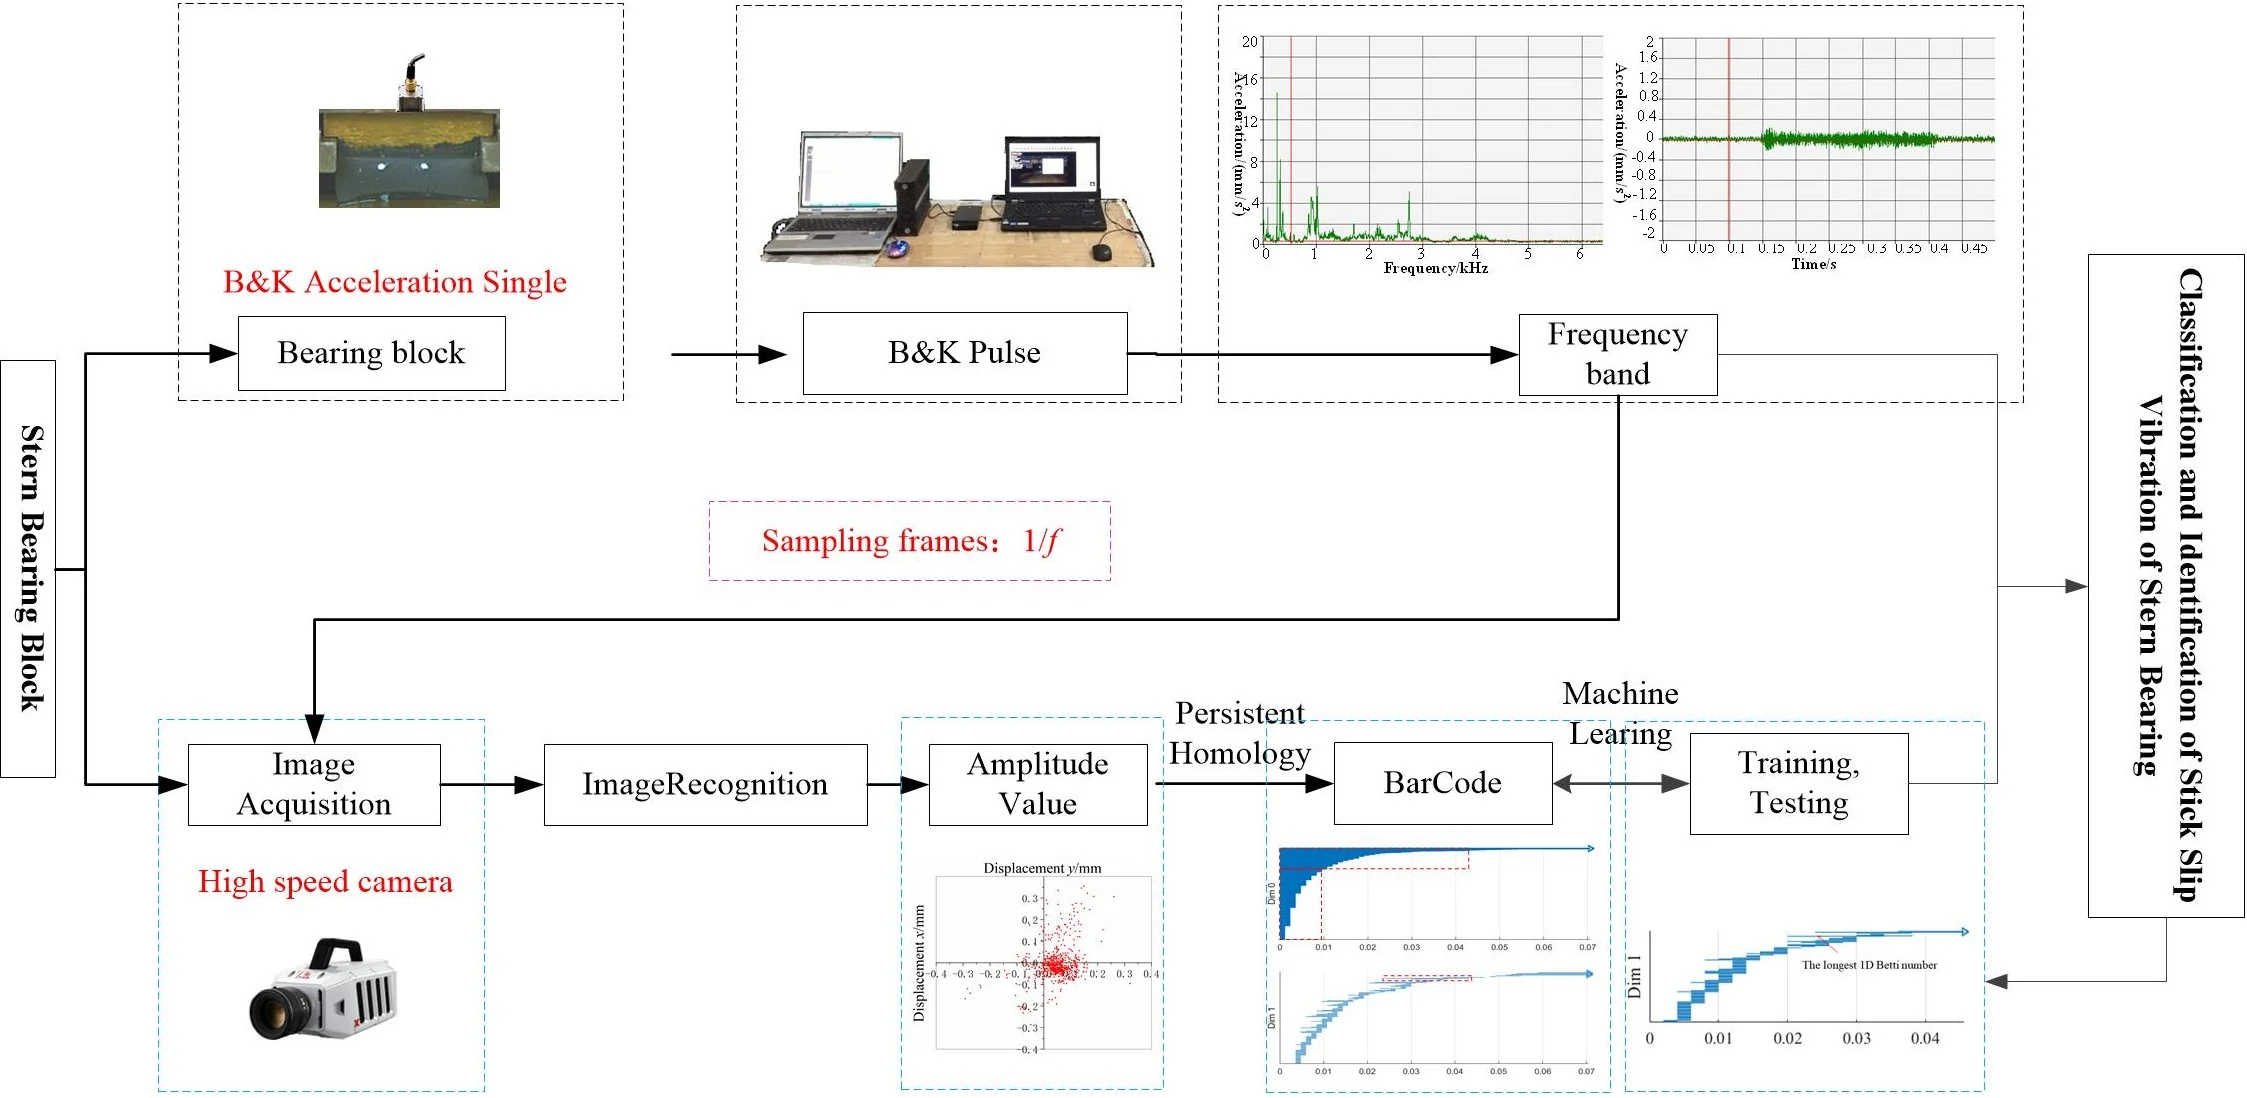
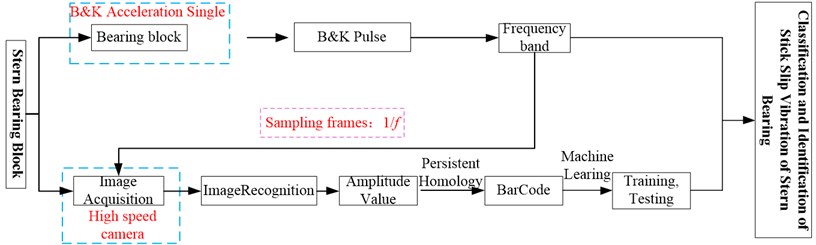
Firstly, the machine vision technology is used to collect the vibration displacement image of the stern bearing test block. At the same time, the B&K Pulse acceleration sensor is used to collect the vertical vibration acceleration’s time-domain signal and frequency-domain signal of the stern bearing. Then, the vibration displacement image of the stern bearing test block is calculated by using the PH theory, and the barcode map is generated to obtain the topological features. Then, the topological features obtained from the PH are extracted and identified by using the SVM. The main features reflecting the stick-slip vibration process are inputed into the SVM, and appropriate samples are selected for training and testing to realize the SVM and stick-slip vibration and persistence. Finally, the classification and identification of stick-slip vibration of the stern bearing test block are realized. The main process is shown in Fig. 2. The specific process description of a combination of SVM with vibration characteristics and PH basis of stern bearing test block is specified in Section 4.
Fig. 2Classification and identification of stick-slip vibration of stern bearing blocks
3. Stick-slip vibration test of stern bearing
The water-lubricated rubber material is processed into a cuboid test block, vulcanized with the copper outer lining, and fixed on the fixture, as shown in Fig. 3. Then the fixture is installed at a SSB-100 stern bearing test bench, as shown in Fig. 4. Point is taken on the friction surface of the sample as the tracking point (about 1 mm away from the lower surface of the test block), points Ra and Rb are reference points (TRa = RaRb = 10 mm), the shaft speed is 20, 60, and 100 r/min, and the specific bearing pressure of the test block is 0.29 MPa. Ten tests are made at each speed, and the vibration displacement and acceleration amplitudes of point in and directions are recorded. Specifically, when the rotating speed is 20 r/min, ten tests are carried out, and the experimental data are recorded as 20-D1, 20-D2, …, 20-D10; when the rotating speed is 60 r/min, ten tests are carried out, and the experimental data are recorded as 60-D1, 60-D2, … , 60-D10; when the rotating speed is 100 r/min, ten tests are carried out, and the experimental data are recorded as 100-D1, 100-D2, …, 100-D10. At each test 600 sampling points are taken with a high-speed camera, scatter plots of measuring point displacement, (20-D1, 60-D1, and 100-D1) are shown in Fig. 5.
Fig. 3Tracking point location
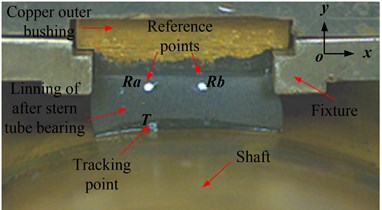
Fig. 4Test bench of after stern bearing [2, 17, 18]: 1 – high-speed camera; 2 – LED white light; 3 – accelerometer; 4 – test block and shaft; 5 – weight; 6 – torque meter; 7 – infrared speedometer; 8 – motor; 9 – Photron 3, TEMA2.6; 10-B&K PULES
![Test bench of after stern bearing [2, 17, 18]: 1 – high-speed camera; 2 – LED white light; 3 – accelerometer; 4 – test block and shaft; 5 – weight; 6 – torque meter; 7 – infrared speedometer; 8 – motor; 9 – Photron 3, TEMA2.6; 10-B&K PULES](https://static-01.extrica.com/articles/21748/21748-img8.jpg)
The B&K acceleration sensor is used as an acceleration sensor, which is arranged above the test block, as shown in Fig. 4. The corresponding vibration acceleration time-domain signal and frequency domain signal of stern bearing test block in the vertical direction measured by the acceleration sensor are listed in Table 3.
Table 3Vertical vibration acceleration time domain signal and frequency domain signal block
20 r/min | 60 r/min | 100 r/min | |
Frequency domain curve | 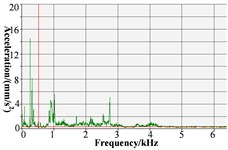 | 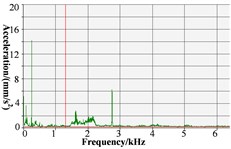 | 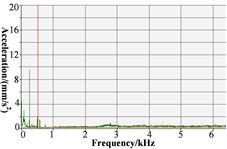 |
Time domain curve | 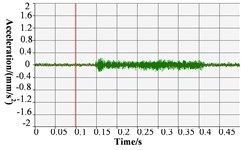 | 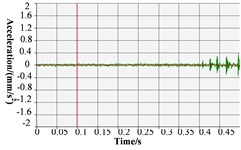 | 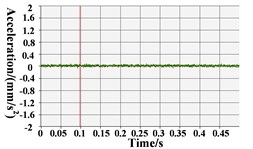 |
Fig. 5Scatter plots of measuring point displacement
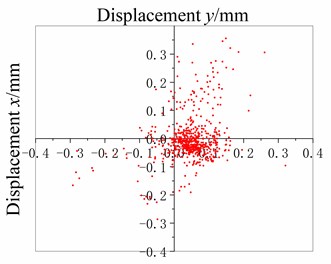
a) 20-D1
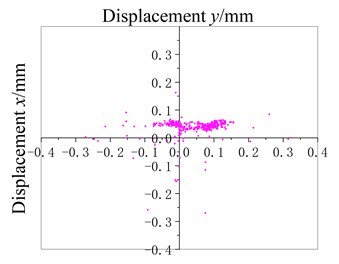
b) 60-D1
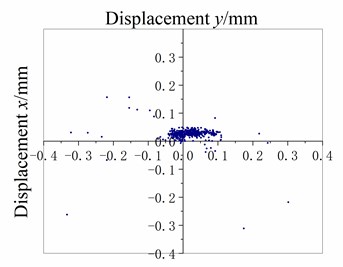
c) 100-D1
As shown in Fig. 5(a), 20 r/min, the dispersion degree of displacement from scattered measuring points is high, and the displacement value fluctuates in both direction (horizontal direction) and direction (vertical direction). The amplitude of displacement fluctuation of the measuring point in the direction is mainly concentrated between –0.2 mm and 0.2 mm, and is mainly between –0.2 mm and 0.3 mm in the direction. The fluctuation amplitude is large. It is preliminarily assessed that the lubrication of the stern bearing is bad, and the bad lubrication can easily lead to stick-slip vibration and cause “squeal” sound. Furthermore, as shown in Table 3, the vibration acceleration time-domain signal and frequency-domain signal of stern bearing have large fluctuations in 20 r/min. When the time domain signal is 0.15-0.40 s, the amplitude of vibration acceleration in 20 r/min mode is significantly higher than that in 100 r/min operation mode; compared with the frequency-domain curve, the amplitude of vibration acceleration at 0-3 k is higher than that under 100 r/min operation mode. In the frequency range, the peak number of vibration acceleration under 20 r/min is significantly higher than that under 100 r/min, and the maximum amplitude of vibration acceleration under 20 r/min is 14.5 mm/s2, that is greater than 9.7 mm/s2 under 100 r/min. The time-domain signal and frequency-domain signal have a large range of fluctuations, and during the test, the stern bearing can be heard to emit a harsh “squeal”, so far, it can be determined that under this condition, the stern bearing has occurred stick-slip vibration.
As shown in Fig. 5(c), the displacement concentration of 100 r/min stern bearing measuring point is high, and the displacement value fluctuation is mainly concentrated in the direction (i.e. horizontal direction), and the amplitude of displacement fluctuation of measuring point in the direction is mainly between –0.1 mm and 0.1 mm, so the fluctuation amplitude is small. In addition, there is no “squeal” sound of the stern bearing during the test, so it is preliminarily determined that the stern bearing is well lubricated. Furthermore, as shown in Table 4, at 100 r/min, the time domain signal and frequency domain signal of the stern bearing are relatively stable without high fluctuation, and no “squeal” sound is heard during the test; it can be determined that under this condition, the stern bearing does not have stick-slip vibration.
As shown in Fig. 5(b), and Table 3, 60 r/min, the amplitude of measured point displacement scatters diagram in the -direction and -direction is between 20 r/min and 100 r/min; the amplitude of vibration acceleration time-domain signal and frequency domain signal of stern bearing is also between 20 r/min and 100 r/min, and no “squeal” sound is heard during the test, so no stick-slip vibration of stern bearing occurs under this operating condition.
4. Vibration analysis of stern bearing based on PHML
The contact between water-lubricated rubber stern bearing and shaft during operation leads to stick-slip vibration and “whistling” noise, which seriously affects the concealment of the underwater vehicle and is one of the bottlenecks for the underwater vehicle to achieve the level of silence. The traditional methods to establish the relationship between loads, speeds, and the stick-slip vibration of the stern bearing are mainly statistical and parametric. These methods do not consider the local topological characteristics of vibration and cannot identify the vibration characteristics completely.
In this paper, the topological method and artificial intelligence are combined to establish the relationship between loads, speeds, and the stick-slip vibration of the stern bearing. The vibration signal of stern bearing is obtained by computer vision. The measurement space description of the stick-slip vibration of stern bearing is mapped to the topological space description by using PHML which has strong robust characters [33, 34]. In topological space, the vibration signals of the stern bearing are identified and classified. The relationship between loads, speed, and service performance of stick-slip vibration is explored, and the mechanism of stick-slip vibration is revealed, and a new scheme is provided to solve the bottleneck of vibration reduction and noise reduction of the stern bearing. PHML in computation can be divided into four steps, i.e., simplicial complex construction, PH analysis, topological feature extraction, and topology-based SVM analysis [35].
The main feature 8 (listed in Table 1, the length of the longest Betti number is 1 bar.) reflecting the vibration of the stern bearing is inputted into a SVM, 90 % of the data are used as training samples, and 10 % of the data are taken as test samples.
4.1. Stick-slip vibration mechanical based on barcodes of PH
The barcode diagrams of the stern bearing samples are obtained by using the PH theory tool of JavaPlex [36] to characterize and analyze the network topology characteristics of the sample measurement points, and to explore the evolution law of the sample vibration characteristics. The vibration barcode diagrams of 20-D1, 60-D1, and 100-D1 test data under the operating conditions of 20 r/min, 60 r/min, 100 r/min, and 0.29 MPa for the stern bearing sample are shown in Fig 6. Since the test results under other conditions are not much different from the above three results, only the barcode diagrams of 0D and 1D Betti numbers under 20-D1, 60-D1, and 100-D1 conditions are listed here.
It can be seen from Fig. 6(a) that under the operating condition of 20 r/min and 0.29 MPa, the 0D Betti number is distributed in a ladder shape. Most of the points of which are greater than 0.01 are located in the upper layer and the maximum value of is 0.042. Therefore, the displacement data of measuring points becomes lower and the amplitude is higher; The lower layer data of the measuring point is in the range of [0-0.01], which indicates that the displacement data of the measuring point is close and the amplitude is low. The displacement amplitude of measuring points is random. The results show that at the speed of 20 r/min (the lowest speed that the test bench can reach), the shaft-stern bearing friction pair is in the mixed lubrication state, the shaft-stern bearing friction pair has intermittently shafting holding phenomenon, so the friction pairs produce stick-slip phenomenon and then induce chatter and sound.
The 1D Betti number is a linear distribution, and having many pieces with different lengths, that indicates many 1D rings are formed around the original point. As the stern bearing belongs to high viscoelastic material, stick-slip motion occurs between the stern bearing and the shafting during the test. In the rotational speed direction, the measuring point is pulled away from the origin under the action of friction, and then pulled back to the origin under the elastic restoring force of rubber, thus forming a ring in the 2-dimensional plane; due to the existence of stick-slip phenomenon, the distance between the measuring point and the origin is different, resulting in the length of the lines in the 1D Betti number diagram. In 1D Betti number graph, the maximum radius of 1D ring is 0.018, and the minimum is 0.001.
Fig. 6Barcode chart of after stern bearing
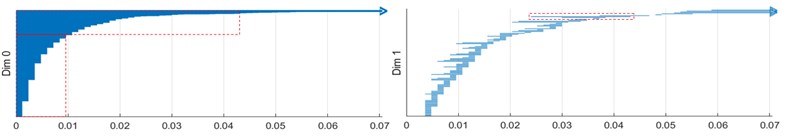
a) 20 r/min
b) 60 r/min
c) 100 r/min
According to Fig. 6(b), it is found that the ε of 0-dimensional Betti number in Fig. 6(b) is less than 0.0125 compared with the barcode diagram of 0.29 MPa, at 20 r/min, and the amplitude becomes lower. This indicates that with the increase of the rotating speed, the lubrication state of stern bearing changes after mixed elastohydrodynamic lubrication, and no stick-slip vibration and sound will occur. The 1D Betti number is more compact than that at 30 r/ min, and the maximum value of ε is reduced to 0.005. Besides, when the ring is more tightly lubricated, the amplitude distribution is more concentrated.
According to the barcode diagram under the operating condition of 100 r/min and 0.29 MPa, in Fig. 6, it is found that the lower layer data of 0D Betti number is slightly increased, and the change is not obvious, that indicates the lubricating film of stern bearing has been completely established, the lubrication condition of stern bearing is well, and no stick-slip vibration and sound occurs. The difference between the 1D Betti number at 60 r/min is not significant, and it is still relatively close. More Betty numbers fall in the range of [0-0.05], that indicates that the radius of the 1D ring formed around the original position of the measuring point is smaller, and the stern bearing operates more stably.
Generally speaking, the 0D Betti number of the three stages changes at different lengths to gradually regular order number, which indicates that with the increase of speed, the amplitude of stern bearing decreases from mixed lubrication to complete lubrication, from vibration to no sound condition. The changing trend of 1D Betti number is that the lines are long and sparse at the beginning, and the formation of 1D holes is less and lasting for a long time. With the increase of the rotational speed, the lines become shorter and more compact. It shows that with the increase of rotating speed, the stern bearing forms a fully lubricated state, the amplitude is smaller, and the operation tends to be stable gradually.
4.2. Classification and identification of stick-slip vibration
Nine groups of test data, i.e. 20-D1, …, 20-D9, were calculated and analyzed, and the threshold value of longest 1D Betti number was 0.181. When the longest 1D Betti number is greater than or equal to the threshold value, the stern bearing will produce stick-slip vibration. When the longest 1D Betti number is less than the threshold value, the stern bearing will not produce stick-slip vibration.
Similarly, when the rotating speed of the shaft is 60 r/min, the threshold value of 0.0056 is set as the assessment index of whether the lubrication state of the stern bearing is good and whether the stern bearing has stick-slip vibration. When the longest 1D Betti number is less than the threshold value of 0.0056, the stern bearing can be assessed to be well lubricated. When the longest 1D Betti number is greater than or equal to the threshold value of 0.0056, the stern bearing can be assessed to be poorly lubricated. When the stern bearing makes a “squeal”, it can also be identified as “stick-slip vibration of the stern bearing”. If the stern bearing does not make a “squeal”, it can be identified as “poor lubrication of the stern bearing, but without stick-slip vibration”.
When the stern bearing-shaft system has a high speed, such as 100 r/min, the lubrication effect of the stern bearing is good. Under this operating condition, the threshold value of the longest 1D Betti number is not set. When the lubrication water pressure and flow rate remain unchanged and the load is less than the maximum allowable specific pressure, it can be considered that the stern bearing is always in a good lubrication state and has no stick-slip vibration.
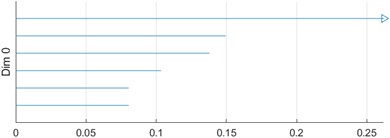
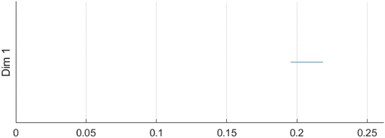
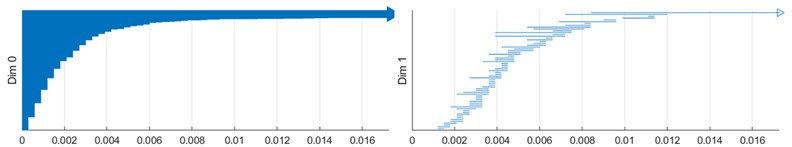
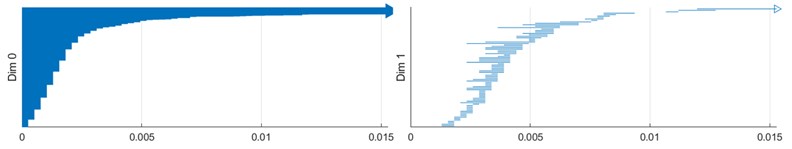
The training set data used for training are 20-D1, 20-D2, … , 20-D9; 60-D1, 60-D2, …, 60-D9; 100-D1, 100-D2, …, 100-D9. The prediction set data used for prediction are 20-D10, 60-D10, and 100-D10. The PHML method is used to forecast the longest 1D Betti number of 20-D10, 60-D10, and 100-D10, and the forecast values are 0.0187, 0.0057, and 0.0036 respectively. 1D Betty numbers of the experimental data values of 20-D10, 60-D10, and 100-D10 are shown in Fig. 7. From Fig.7, it is known that the longest 1D Betty numbers of the experimental data of 20-D10, 60-D10, and 100-D10 are 0.0187, 0.0057, and 0.0036 respectively, and the relative error of the longest 1D Betty numbers of the experimental data and forecast data are 0.538 %, 1.724 %, and 2.857 %.
Fig. 71D Betti numbers of experimental data
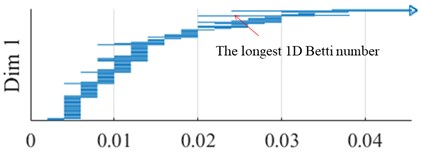
a) 20 r/min, 20-D10 data
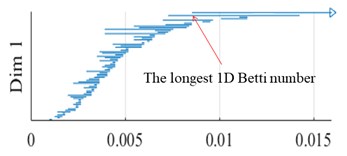
b) 60 r/min, 60-D10 data
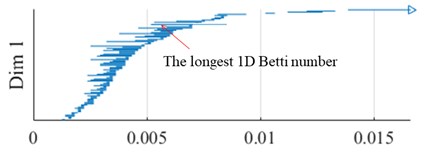
c) 100 r/min, 100-D10 data
The longest 1D Betti number is feature 8, which reflects the stick-slip vibration of water-lubricated rubber stern bearing test block under the same load and different rotating speeds. It can see that the relative error value of feature 8 is less than 3 %, that shows that the accuracy of classification and prediction of chatter caused by stick-slip of water-lubricated rubber stern bearing test block is high when the persistent homology-based machine learning is used.
5. Conclusions
The results of PHML analysis are highly consistent with the vibration process of water-lubricated rubber stern bearing, which can be used to describe the stick-slip phenomenon, chatter phenomenon, lubrication state, and topological characteristics.
In this paper, the topological data analysis method (PHML) is introduced into the field of stern bearing stick-slip vibration and combined with ML, to carry out an intelligent research.
The results show that 0D and 1D Betti numbers are feasible and can reflect the stick-slip vibration characteristics better.
By means of PH, the corresponding relationship between stick-slip vibration amplitude of water-lubricated rubber stern bearing and its topological characteristics of the barcode diagram is established. Then, the topological features are identified and extracted by ML, and accurate and intelligent research on the vibration sound prediction of the stern bearing is carried out. This provides a new idea for eliminating the vibration sound of stern bearing. After that, in the actual engineering operation of the stern bearing, the amplitude of the measuring point is obtained by means of testing, and then the occurrence of vibration sound can be predicted and assessed by using the PHML and by comparing it with the barcode diagram and the characteristic value shown in Table 1, to realize the classification, recognition, and prediction of vibration sound.
References
-
Wu C., Chen F., Long X. H. The self-excited vibration induced by friction of the shaft-hull coupled system with the water-lubricated rubber bearing and its stick-slip phenomenon. Ocean Engineering, Vol. 198, 2020, p. 107002.
-
Qin H. L., Yang C., Zhu H. F., et al. Experimental analysis on friction-induced vibration of water-lubricated bearings in a submarine propulsion system. Ocean Engineering, Vol. 203, 2020, p. 107239.
-
Lin C. G., Zou M. S., Sima C., et al. Friction-induced vibration and noise of marine stern tube bearings considering perturbations of the stochastic rough surface. Tribology International, Vol. 131, 2019, p. 661-671.
-
Bhushan B. Stick-slip induced noise generation in water-lubricated compliant rubber bearings. Journal of Lubrication Technology, Vol. 102, Issues 2, 1980, p. 201-210.
-
Krauter A. I. Generation of squeal/chatter in water-lubricated elastomeric bearings. Journal of Lubrication Technology, Vol. 103, Issue 3, 1981, p. 406-412.
-
Peng E. G., Zheng L. L., Tian Y. Z., et al. Experimental study on friction-induced vibration of water-lubricated rubber stern bearing at low speed. Applied Mechanics and Materials, Vol. 44, Issue 47, 2010, p. 409-413.
-
Peng E. G., Liu Z. L., Zhou X. C., et al. Study on nonlinear friction-induced vibration in water-lubricated rubber stern tube bearings. The Open Mechanical Engineering Journal, Vol. 6, 2012, p. 140-147.
-
Dong C. L., Yuan C. Q., Bai X. Q., et al. Tribological properties of aged nitrile butadiene rubber under dry sliding conditions. Wear, Vol. 322, Issue 323, 2015, p. 226-37.
-
Liang X. X., Yan X. P., Ouyang W., et al. Comparison of measured and calculated water FLM thickness of a water-lubricated elastically supported tilting pad thrust bearing. Surface Topography: Metrology and Properties, Vol. 7, Issue 4, 2019, p. 045010.
-
Ibrahim R. A. Friction-induced vibration, chatter, squeal, and chaos-part I: mechanics of contact and friction. Applied Mechanics Reviews, Vol. 47, Issue 7, 1994, p. 209-226.
-
Golchin A., Wikner A., Emami N. An investigation into tribological behaviour of multi-walled carbon nanotube/graphene oxide reinforced UHMWPE in water lubricated contacts. Tribology International, Vol. 95, 2016, p. 156-161.
-
Viswanathan K., Sundaram N. K. Distinct stick-slip modes in adhesive polymer interfaces. Wear, Vol. 376, Issue 377, 2017, p. 1271-1278.
-
Meziane A., Baillet L., Laulagnet B. Experimental and numerical investigation of friction-induced vibration of a beam-on-beam in contact with friction. Applied Acoustics, Vol. 71, Issue 9, 2010, p. 843-853.
-
Hu S., Liu Y. Disc brake vibration model based on Stribeck effect and its characteristics under different braking conditions. Mathematical Problems in Engineering, Vol. 2017, 2017, p. 6023809.
-
Zhang Z., Zhang Z., Huang X., et al. Stability and transient dynamics of a propeller-shaft system as induced by nonlinear friction acting on bearing-shaft contact interface. Journal of Sound and Vibration, Vol. 333, Issue 12, 2014, p. 2608-2630.
-
Leine R., Van Campen D., De Kraker A., et al. Stick-slip vibrations induced by alternate friction models. Nonlinear Dynamics, Vol. 16, 1998, p. 41-54.
-
Kuang F. M., Zhou X. C., Liu Z. L., et al. Computer-vision-based research on friction vibration and coupling of frictional and torsional vibrations in water-lubricated bearing-shaft system. Tribology International, Vol. 150, 2020, p. 106336.
-
Zhou X. C., Kuang F. M., Huang J., et al. Water-lubricated stern bearing rubber layer construction and material parameters: effects on frictional vibration based on computer vision. Tribology Transactions, Vol. 64, Issue 1, 2021, p. 65-81.
-
Townsend J., Micucci C. P., Hymel J. H., et al. Representation of molecular structures with persistent homology for machine learning applications in chemistry. Nature Communications, Vol. 11, 2020, p. 3230.
-
Lee Y. J., Barthel S. D., Dłotko P., et al. Quantifying similarity of pore-geometry in nanoporous materials. Nature Communications, Vol. 8, 2017, p. 15396.
-
Moon C., Mitchell S. A., Heath J. E., et al. Statistical inference over persistent homology predicts fluid flow in porous media. Water Resources Research, Vol. 55, 2019, p. 9592-9603.
-
Shirai T., Nakamura T. Microscopic description of yielding in glass based on persistent homology. Journal of the Physical Society of Japan, Vol. 88, Issue 7, 2019, p. 074801.
-
Hong S. Y., Kim D. H. Medium-range order in amorphous ices revealed by persistent homology. Journal of Physics. Condensed Matter: an Institute of Physics Journal, Vol. 31, Issue 45, 2019, p. 455403.
-
Yano R., Kim M. Topological analysis of pattern formation in cooling granular gases confined by elastic wall. Journal of Physics Communications, Vol. 4 ,2020, p. 015023.
-
Lawson P., Sholl A. B., Brown J. Q., et al. Persistent homology for the quantitative evaluation of architectural features in prostate cancer histology. Scientific Reports, Vol. 9, 2019, p. 1139.
-
Kim D., Wang N., Ravikumar V., et al. Prediction of 1p/19q codeletion in diffuse glioma patients using pre-operative multiparametric magnetic resonance imaging. Frontiers in Computational Neuroscience, Vol. 13, 2019, https://doi.org/10.3389/fncom.2019.00052.
-
Kofler A., Dewey M., Schaeffter T., et al. Spatio-temporal deep learning-based undersampling artefact reduction for 2D radial cine MRI with limited training data. IEEE Transactions on Medical Imaging, Vol. 39, Issue 3, 2020, p. 703-717.
-
Clough J. R., Oksuz I., Byrne N., et al. Explicit topological priors for deep-learning based image segmentation using persistent homology. Information Processing in Medical Imaging. IPMI 2019. Lecture Notes in Computer Science, Vol. 11492, 2019, p. 16-28.
-
Zhang J. L., Ju X. M. Application of persistent homology in image classification and recognition. Journal of Applied Mathematics and Computational Mathematics, Vol. 4, 2017, p. 494-508.
-
Škraba P. Persistent homology and machine learning. Slovenian Society Informatika, Vol. 42, Issue 2, 2018, p. 253-258.
-
Pijush S. Application of least square support vector machine (LSSVM) for determination of evaporation. Losses in Reservoirs Engineering, Vol. 3, Issue 4, 2011, p. 431-434.
-
Cang Z. X., Mu L., Wu K. D., et al. A topological approach for protein classification. Computational and Mathematical Biophysics, Vol. 3, Issue 1, 2015, p. 140-162.
-
Adams H., Emerson T., Kirby M., et al. Persistence images: a stable vector representation of persistent homology. Journal of Machine Learning Research, Vol. 18, Issues 1-8, 2017, p. 1-35.
-
Reininghaus J., Huber S., Bauer U., et al. A stable multi-Scale kernel for topological machine learning. Proceedings of the IEEE Computer Society Conference on Computer Vision and Pattern Recognition, Vol. 7, 2015, p. 4741-4748.
-
Otter N., Porter M. A., Tillmann U., et al. A roadmap for the computation of persistent homology. EPJ Data Science, Vol. 6, Issue 1, 2017, p. 17.
-
Tausz A., Vejdemo Johansson M., Adams H. JavaPlex: A research software package for persistent (co) homology. Mathematical Software – ICMS 2014. Lecture Notes in Computer Science, Springer, Berlin, Heidelberg, Vol. 8592, 2014, p. 129-136.
Cited by
About this article

The authors give sincere thanks to the editors and the reviewers for their patient work and constructive suggestions. The project supported by Natural Science Foundation of Jiangxi, China (No. 20192BBEL50028).
