Abstract
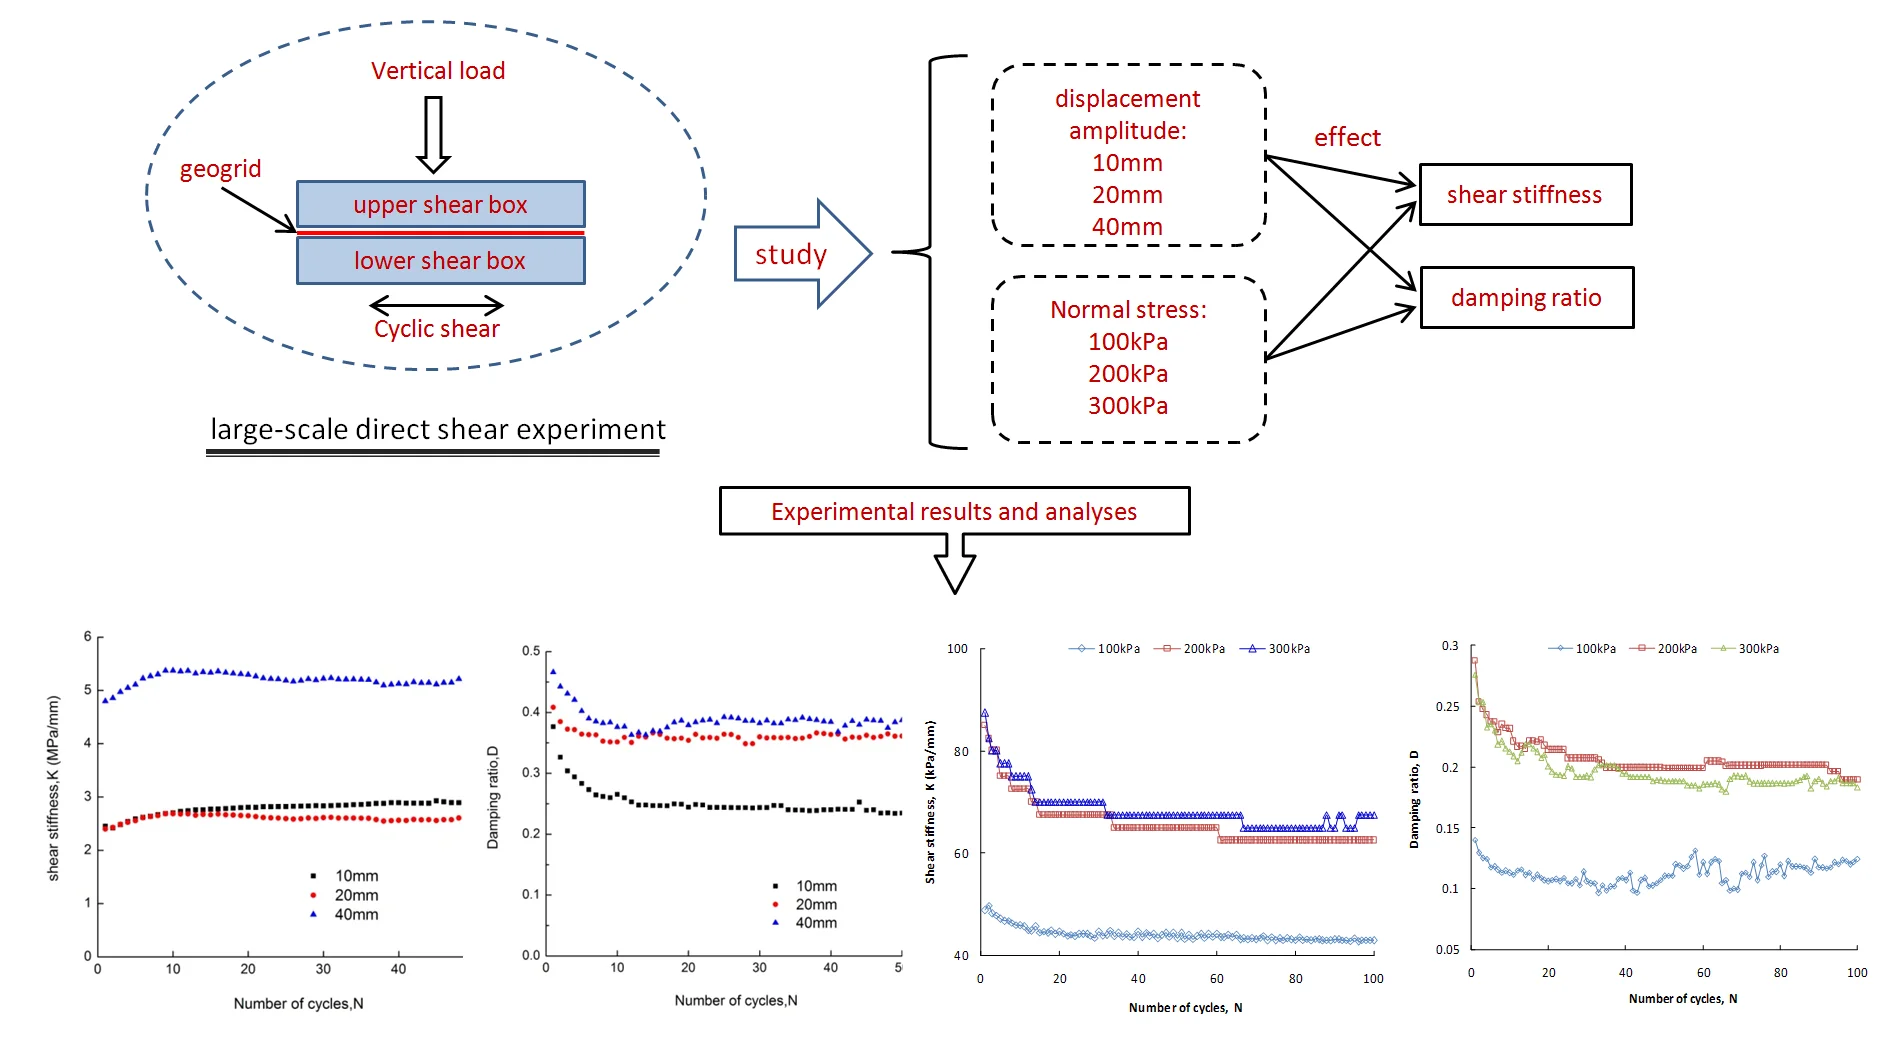
Geosynthetic-reinforced soil structures are mostly used to retain subgrade slope of highway and railway. For the design and performance analyses of geosynthetic-reinforced soil structures under repeated loading, such as those induced by compaction, traffic and earthquakes, the understanding of cyclic soil–geosynthetic interface behaviour is of great interest. Nevertheless, experimental data concerning this type of behaviour are very scarce. A laboratory study was carried out and is described in this paper. This paper presents the behaviour of an interface between a coarse-grained soil and a geogrid under cyclic loading conditions. A large-scale direct shear test device able to perform displacement-controlled cyclic tests was used. The results obtained are presented and discussed, especially the effects of the displacement amplitude and normal stress on the shear stiffness and damping ratio are investigated. The dynamic response parameters of the soil-geosynthetic interface are greatly affected by the number of cycles, and the variations in the two parameters with the number of cycles are related to the normal stress and the shear displacement amplitude. when at large displacements, the damping ratio decreases first and then stabilizes with the number of cycles. However, at small displacement, the shear stiffness and damping ratio are all decrease somewhat at the initial stage of cyclic shearing. As the experimental materials used in this study are relatively single, and further experimental research should be carried out in the future. The shear parameters of interface in this study can provide reference for the design of reinforced soil structure.
Highlights
- The dynamic response parameters of the soil-geosynthetic interface are greatly affected by the number of cycles.
- The variations of shear stiffness and damping ratio with the number of cycles are related to the normal stress and the shear displacement amplitude.
- When at large displacements, the damping ratio decreases first and then stabilizes with the number of cycles.
- When at small displacement, the shear stiffness and damping ratio are all decrease somewhat at the initial stage of cyclic shearing.
1. Introduction
With regard to highway and railway subgrade engineering, geosynthetics are often used to enhance the stability of subgrade slopes. Reinforced soil structures in practice bear not only static loads such as gravity but also dynamic loads such as earthquakes, wave loads and traffic loads. The properties of the soil-geosynthetics interface under static loading may be studied by monotonic direct shear tests and pullout tests. Under dynamic loading, the soil-geosynthetic interface is subjected to cyclic shear action, and the cyclic direct shear test is used to study the interfacial shear behavior under cyclic shear. Due to the different loadings, the interfacial characteristics must be different for static loads and dynamic loads. Research on the dynamic shear properties of the soil-geosynthetic interface will help understand the interaction principle of the interface and improve the accuracy of the stability analysis of reinforced soil structures under dynamic loads.
The mechanical properties of the interface between the soil and geosynthetics have an important influence on the stability and durability of reinforced soil structures. Over recent decades, many researchers have investigated the shear properties of the interface under static loads [1, 2]. Liu et al., [3] studied the model regarding the effect of the grid transverse rib on the interface shear strength under a static load. Many scholars [4-7] carried out a series of tests to evaluate the impacts of the normal stress, shear speed and material properties on the shear strength of the interface. Khoury et al., [8] researched the properties of the interface between unsaturated soil and geosynthetics, using modified direct shear equipment, and proposed an elastic-plastic constitutive model to characterize the unsaturated soil-reinforcement interface properties. Anubhav et al., [9] studied the properties of the soil-geotextile interface with different textures, proposing a nonlinear constitutive model to characterize the interface properties. Lee et al., [10] and Choudhary et al., [11] conducted large-scale direct shear tests to study the impacts of the particle diameter and the type of geosynthetic on the interface shear properties. Bergado et al., [12] obtained the values of the interface friction angle of the geomembrane-soil interface under dry and wet conditions by conducting large-scale direct shear tests. Vangla et al., [13] and Punetha et al., [14] recorded the movement of soil particles and the stretcher strain of geotextiles by taking photos and using scanning electron microscopy (SEM) in shear tests.
For the interaction between geosynthetics and soil under a dynamic load, Zhang et al., [15] developed a large-scale 3D testing machine for the soil-structure interface that was adopted to study the cyclic mechanical properties of the contact surface. Mortara et al., [16] studied the impact of cyclic shear on the strength properties of the contact surface between the soil and structure by performing a series of cyclic shear tests. Nye et al., [17] studied the shear properties of the clay-geosynthetics interface by implementing monotonic direct shear and cyclic direct shear tests. Fox et al., [18] studied the damage properties of geotextiles under dynamic loading with a series of static and dynamic direct shear tests. Vieira et al., [19] compared the results of load-controlled and displacement-controlled shear tests by conducting monotonic and cyclic direct shear tests. Liu et al., [20] studied the impacts of different geotechnical materials and cyclic loading on the interface shear stiffness and damping ratio by adopting a large-scale multifunctional interface shear apparatus, but the number of cycles was only 10, which made it difficult to fully reflect the actual loading condition of the reinforced soil structure.
Some scholars have utilized multiple methods and means, including direct shear tests, pullout tests and inclined plane tests, to obtain the properties of the soil-geosynthetic interface under various working conditions. Zimmie et al., [21] studied the dynamic properties of various soil-geosynthetic interfaces using direct shear tests and shaking table tests, which revealed the major properties of the dynamic friction angle in the interface. Kamalzare et al., [22] investigated the static properties of the soil-geosynthetic interface of different geosynthetics by adopting large-scale shear tests, showing that the interface strength characteristics of different geosynthetics are significantly different. DE et al., [23] and Chen et al., [24] conducted a series of direct shear and centrifuge model tests to study the dynamic properties of eight soil-geosynthetic interfaces. By using plane tests, Lopes et al., [25] investigated the interface properties of multiple geosynthetics, demonstrating a significant impact of the type and structure of the geosynthetic on the interface friction angle. In addition, Deng et al., [26] and Zhao et al., [27-29] carried out theoretical research on the mechanical properties of relevant geotechnical materials and obtained some valuable conclusions.
In studying the characteristics of the soil-geosynthetic interface of reinforced soil structures under dynamic loads, the cyclic shear stiffness and damping ratio are often used to characterize the dynamic response parameters of reinforced soil structures. However, there has been no comprehensive study on the shear stiffness and damping ratio of the soil-geosynthetic interface in previous studies, especially the number of shear cycles used in the existing research results, which are too few to reflect the real behavior of actual engineering under dynamic action. In this paper, the large amplitude cyclic shear test and small amplitude cyclic shear test are carried out, and the variations in the shear stiffness and damping ratio under different dynamic loads for geogrids against coarse-grained soil interfaces has been obtained, which can provide effective parameters for the stability analysis of reinforced soil structure.
2. Materials and apparatus
2.1. Materials
A coarse-grained soil adopted as the testing soil is a mixture of clay and graded gravel. The grain size distribution curve of the soil is presented in Fig. 1, and the physical properties of the clay are shown in Table 1. Fig. 1 reveals that the content of fine-grained group less than 0.075 mm is only about 16 %, so it can be judged that the soil material belongs to sandy soil, which is a good kind of subgrade filler. The test geogrid is bidirectional, and its technical parameters are shown in Table 2.
Table 1Physical indices of testing clay
Specific gravity | Liquid limit (%) | Plastic limit (%) | Plastic index |
2.75 | 36.1 | 20.2 | 15.9 |
Table 2Technical indexes of the geogrid
Quality per unit area (g/m2) | Aperture size (mm) | Rib width (mm) | Ultimate tensile strength (kN/m) | Ultimate elongation (%) |
310 | 15 | 10 | 90 | 4 |
Fig. 1Grain size distribution curve of the soil
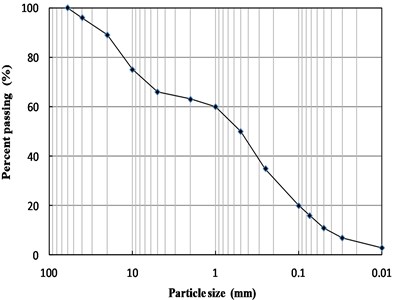
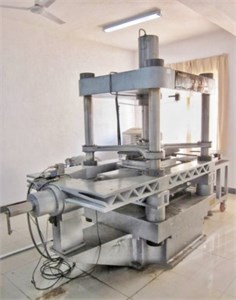
Fig. 2Large-scale direct shear apparatus
2.2. Description of the apparatus
This test adopts a large-scale dynamic-static direct shear apparatus (as shown in Fig. 2), and the length, width, and thickness of the upper and lower shear boxes are 500 mm×500 mm×150 mm. The maximum particle size of the soil in the direct shear test is 48 mm. The geogrids are fastened on the top of the lower shear box via a fixture before the shear test. When shearing the interface, the upper shear box is fixed while the lower box moves horizontally. The maximum horizontal shear displacement can reach 300 mm, with shearing rates from 0.01 mm/s to 2 mm/s. The maximum vertical displacement is 200 mm, and the maximum normal loading is 600 kN. Due to the same size of the upper and lower shear boxes, the vertical stress remains unchanged by changing the vertical loads. The horizontal and vertical displacements during the shearing process are measured using the displacement sensor and automatically read by the computer.
In addition, the large direct shear tester, equipped with an auxiliary soil sample loading and unloading device, is adequate to make the large soil samples and to load and unload the shear box faster.
3. Test procedure
3.1. Test methods
Cyclic shear tests consist of large and small-displacement amplitude shears for the soil-geosynthetics interfaces. The cyclic shear test of large displacement amplitude adopts the vertical stress/100 kPa, the shear displacement amplitude / 10 mm, 20 mm and 40 mm respectively, and the shear rate / 0.8 mm/ s. The small displacement amplitude cyclic shear test adopts the vertical stress / 100 kPa, 200 kPa and 300 kPa, the shear displacement amplitude / 2 mm, and the shear rate / 0.8 mm/s. Parameters considered for conducting the experiment under both large-displacement and small-displacement amplitude shear are tabulated in Table 3 and Table 4 respectively.
Table 3Test parameters of the large-displacement amplitude shear
Frequency (Hz) | Normal stress (kPa) | Number of cycles | Displacement amplitude (mm) |
0.02 | 100 | 200 | 10 |
0.01 | 100 | 100 | 20 |
0.005 | 100 | 50 | 40 |
Table 4Test parameters of the small-displacement amplitude shear
Frequency (Hz) | Normal stress (kPa) | Number of cycles | Displacement amplitude (mm) |
0.1 | 100 | 1000 | 2 |
0.1 | 200 | 1000 | 2 |
0.1 | 300 | 1000 | 2 |
3.2. Specimen preparation
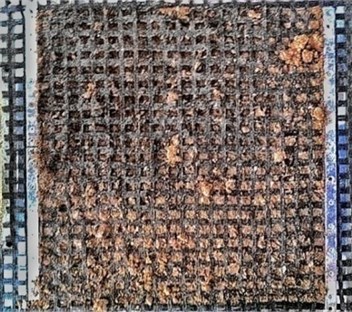
The soil is compacted in three layers 250 mm in height. For easy compaction and installation of the geogrids, the thicknesses of the top and bottom layers are both 100 mm, and those of the middle layers are 50 mm, with a 90 % degree of compaction. When compacting specimens, the soil in the bottom layer is placed in the lower shear box and hammered to 100 mm in height. Then, the upper shear box is lifted and fixed on the lower shear box with screws; subsequently, the soil for the second layer is weighed and placed in the shear box. When the soil samples in the first and second layers stand at 150 mm in height, the upper shear box is removed, and the geogrid is fastened on the top of the lower shear box with clamps. Finally, the upper shear box is lifted and fastened, and the third layer of soil is placed into the box and compacted to 250 mm in height. The installed geogrid is shown in Fig. 3.
Fig. 3Geogrid in the interface
4. Shear stiffness and damping ratio
The stiffness and damping ratio of soils are often used for dynamic response analysis. Nye et al., [17] revised the method of calculating the stiffness and damping ratio and used it to describe the dynamic characteristics of the sand-concrete interface. Fox et al., [18] applied it to a dynamic response analysis of the geomembrane-geotextile interface. Choudhary et al., [11] and Punetha et al., [14] applied the stiffness and damping ratio to a dynamic shear analysis of the soil-geosynthetics interface. In this paper, the shear stiffness and damping ratio are used to describe the cyclic shear behavior of the reinforced soil interface by a similar method. Fig. 3 presents the calculation process for the shear stiffness and damping ratio in a single hysteretic loop [17]. Considering the asymmetry of the same hysteretic loop in two shear directions, the shear stiffness in the hysteretic loop is calculated as follows:
In the formula, and are the shear stiffnesses in the two shear directions, and are the peak shear stresses in the two shear directions, and is the shear displacement amplitude. Similarly, the damping ratio is calculated as follows:
In the formula, and are the damping ratios in two shear directions, is the area of the whole hysteresis loop, and and are the shaded areas in Fig. 4.
Fig. 4Calculation of the secant shear stiffness and damping ratio from the hysteresis loop
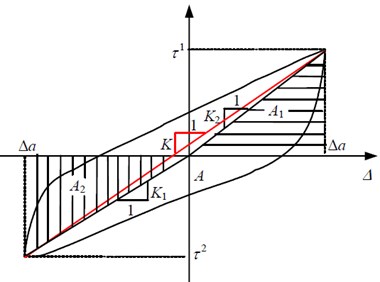
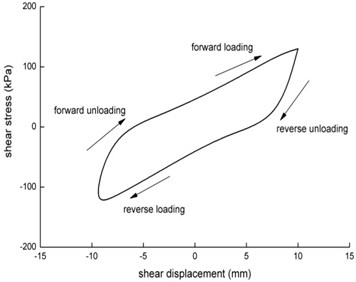
Fig. 5Single-loop curve of the shear stress-shear displacement
5. Experimental results and analyses
5.1. Characteristics of the interface shear strength
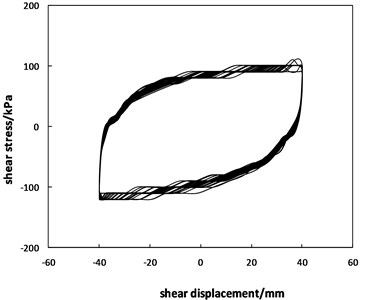
Fig. 5 presents the single curve of the shear stress versus shear displacement at a displacement amplitude of 10 mm, and the hysteresis curves of the shear stress-shear displacement during the first 50 cycles are shown in Fig. 6 (the initial loading curve in the first cycle is not included). As shown in Fig. 5, the curve of the shear stress-shear displacement consists of four stages: positive loading, reverse unloading, reverse loading and positive unloading, which circulate clockwise. The positive loading starts from the shear displacement of 0 mm, and the shear stress increases with shear displacement and reaches the peak value at the same time when the displacement is maximum. The reverse unloading curve is initially steep, as the shear stress decreases rapidly with a decrease in displacement, and the later unloading curve is parallel with the positive loading curve. The reverse loading curve is parallel with the positive loading curve, as the shear stress increases with the shear displacement. The positive unloading curve is initially steep and then tends to be gentle. While the forward loading, the increase of the displacement between soil particles and grid results in the increase of interface friction gradually, but the soil particles do not turn over completely; at the initial stage of the reverse unloading, the shear stress decreases rapidly to 0 due to the repositioning of soil particles, and when the shear displacement is 0, the negative shear stress has been generated, thus completing the half cycle. So does the other half cycle.
Fig. 6Curves of the shear stress versus shear displacement
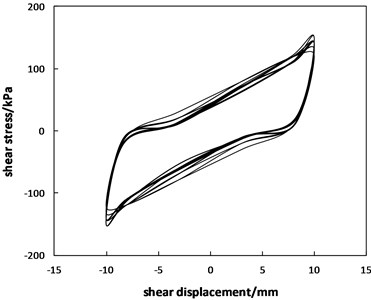
a) Displacement amplitude of 10 mm
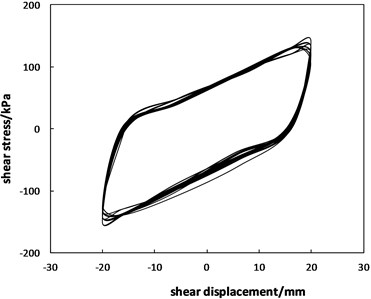
b) Displacement amplitude of 20 mm
c) Displacement amplitude of 40 mm
Fig. 6 shows that the larger the shear displacement amplitude is, the more moderate the initial positive loading and reverse loading curve trends, which means that a smaller load is needed for displacements from 0 to the semi amplitude value than for other displacements. In addition, the greater the displacement amplitudes are, the greater the load variation during the unloading stage. This is because the greater the displacement amplitude is, the greater the damage to the soil-geosynthetic interface, especially the damage caused by the breaking of the geogrid ribs.
5.2. Normal deformation of the interface
Fig. 7 presents the curve of the normal displacement-shear displacement for the shear displacement amplitude of 20 mm. As shown in Fig. 9(a), it is evident that the specimen has a distinct normal displacement, which means that volumetric deformation occurs in the soil-geosynthetic interface. With the increase in cycles, the normal displacement of a single cycle decreases gradually, and the accumulated normal displacement becomes larger. Fig. 9(b) shows that during the single shear cycle, the specimen alternately produces shear contraction and dilatancy, i.e., loading shear results in dilatancy, and unloading shear produces contraction. The shear contraction of a single cycle is greater than the shear dilatancy; however, the contractive behavior is superimposed on the dilative behavior, so the sample contracts as a result of the induced cycling. Under loading shear, the soil particles in the soil-geosynthetic interface climb and move to generate shear expansion. Under unloading shear, soil particles in the soil-geosynthetic interface are rearranged to become tense and generate shear shrinkage under the vertical stress.
Fig. 7Curves of the normal displacement-shear displacement
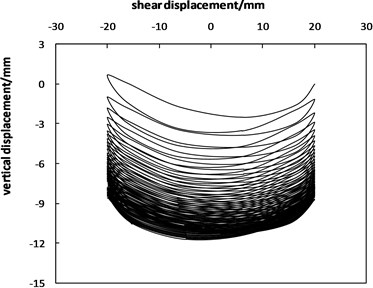
a) Fifty shear cycles
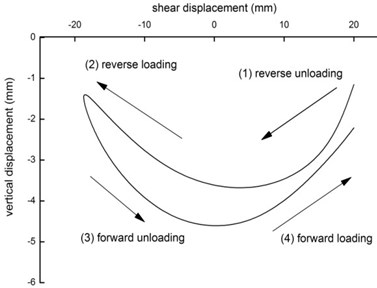
b) Single shear cycle
5.3. Interface shear stiffness and damping ratio
5.3.1. Influence of the number of cycles
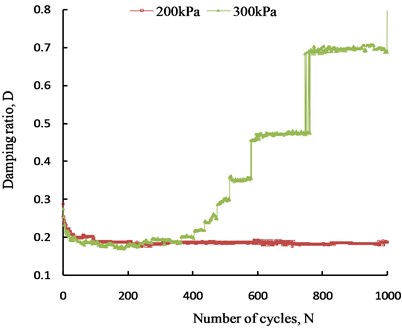
When reinforced soil structures are subjected to long-term dynamic loads, the soil-geosynthetic interface undergoes thousands of shearing cycles. However, the number of soil-geosynthetic interface shear cycles in existing research results is only 10-40 [17, 19, 20]. As the number of shear cycles has a significant effect on the soil-geosynthetic interface characteristics, it is necessary to carry out more shearing cycles to obtain them. In this paper, 1000 shearing cycles were carried out for the coarse-grained soil against the geogrid interface, and the variations in the shear stiffness and damping ratio with cycles under two normal stresses (200 kPa and 300 kPa) are shown in Fig. 8 and Fig. 9, respectively.
Fig. 8 shows that the shear stiffness decreases with the number of cycles at the small displacement amplitude (2 mm). The shear stiffness decreases sharply during the first 50 cycles, then decreases slowly and does not stabilize completely after 1000 cycles.
Fig. 9 shows that the development of the damping ratio varies greatly with the cycle number for different normal stresses. During the first 200 cycles, the damping ratio decreases with the number of cycles, and the rate of reduction is fast first and then slow. After 200 cycles, the damping ratio is basically stable between 0.18 and 0.19 under a normal stress of 200 kPa. Under a normal stress of 300 kPa, the damping ratio increases with the number of cycles, but the growth rate is slow first and then fast, and the damping ratio increases stepwise and exceeds the initial value after 500 cycles.
Analyzing Fig. 8 and Fig. 9, the influence of the cycle number on the shear stiffness and damping ratio is obvious. Even if the cycle number reaches 1000, the parameters of the interface characteristics are still not stable. Moreover, the variations in the shear stiffness and damping ratio with the cycle number are closely related to the displacement amplitude and normal stress. That is, under different shear conditions, the development law of the interface parameters with the cycle number varies. To fully obtain the dynamic response of the reinforced soil structure, shear tests should be conducted under various working conditions and with a large number of cycles.
Fig. 8Change in the shear stiffness with shear cycles
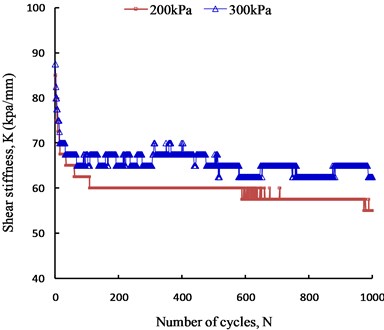
Fig. 9Change in the damping ratio with shear cycles
5.3.2. Influence of the displacement amplitude
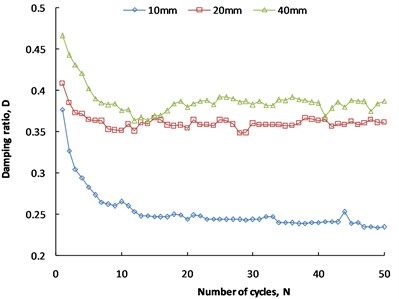
The variations in the shear stiffness and damping ratio with cycle numbers at different shear displacement amplitudes (10 mm, 20 mm, 40 mm) are obtained by cyclic shear tests; the results are shown in Fig. 10 and Fig. 11 (normal stress is 100 kPa).
Fig. 10Shear stiffness at different displacement
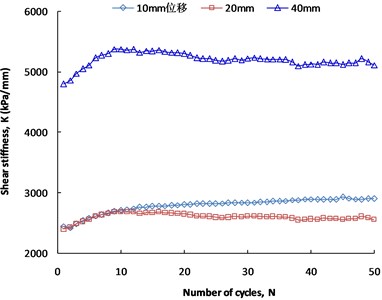
Fig. 11Damping ratio at different displacement
It can be seen that the shear stiffness increases with the number of cycles during the initial stage of cyclic shear. The shear stiffness at displacement amplitudes of 20 mm and 40 mm decreases slightly and tends to be stable after 10 cycles, but the shear stiffness at the displacement amplitude of 10 mm does not decrease significantly and stabilizes above 2900 kPa/mm, which shows that the interface exhibits shear hardening during cyclic shear. Similar behavior was observed by Vieira et.al., [19]. For the same number of cycles, the shear stiffness at the displacement amplitude of 40 mm is greater than 4700 kPa/mm, and the shear stiffness at displacement amplitudes of 20 mm and 10 mm is less than 3000 kPa/mm. The shear stiffness at a displacement amplitude of 40 mm is much larger than that at the other two amplitudes, which indicates that the shear stiffness easily increases when the displacement amplitude rises. The interface shear strength of coarse-grained soil against a geogrid includes (i) resistance of the geogrid ribs, (ii) sliding friction between the soil particles and the geogrid ribs, and (iii) friction and interlocking of the soil particles. At a large shear displacement amplitude, the adjustment of the soil particles is sufficient, and the increase in the soil compactness leads to an increase in the interlocking force of the soil particles, so the shear stiffness increases to a certain extent during the initial stage of cycles. After 10 cycles, the compactness of the soil will not increase, and the interlocking force of the soil particles will remain stable. However, an overly large displacement amplitude may lead to the fracturing of the transverse rib, and the resistance of the transverse rib will decrease accordingly. Therefore, the shear stiffness at a displacement amplitude of 40 mm will decrease after 10 cycles.
Fig. 11 shows that during the initial stage of cyclic shear, the damping ratio at different displacement amplitudes decreases sharply with the cycle number but no longer decreases significantly after 15 cycles and tends to be stable. Liu et. al., [20] carried out cyclic shear tests on a geogrid-sand interface at displacement amplitudes of 1 mm, 3 mm and 5 mm (10 cycles), and it was found that the interfacial damping ratio did not change significantly with the cycle number, which is different from the conclusion of this paper. The reason is that the displacement amplitude is too small and the number of cycles is too few, which leads to little change in the damping ratio. Comparing the damping ratios at different displacement amplitudes, the damping ratios at the displacement amplitude of 10 mm are significantly smaller than those at the other two amplitudes, and the damping ratios at the displacement amplitude of 40 mm are slightly larger than those at the amplitude of 20 mm. For example, when the cycle number is 5, the damping ratios at amplitudes of 10 mm, 20 mm and 40 mm are 0.28, 0.36 and 0.40, respectively, indicating that the larger the displacement amplitude is, the greater the damping ratio. The damping ratio is a parameter characterizing the speed of energy dissipation of reinforced soil structures subjected to dynamic loading. Figure 8 illustrates that cyclic shear will cause the energy dissipation rate of the interface to be fast and then slow, after which the dissipation rate will tend to be stable. The larger the displacement amplitude is, the faster the energy decay. These conclusions are consistent with those of Liu et al., [20].
5.3.3. Influence of normal stress
The relationship between the shear stiffness and damping ratio with the cycle number under different normal stresses (100 kPa, 200 kPa and 300 kPa) is obtained by cyclic shear at a small displacement amplitude of 2 mm, as shown in Fig. 12 and Fig. 13.
Fig. 12Shear stiffness under different normal stresses
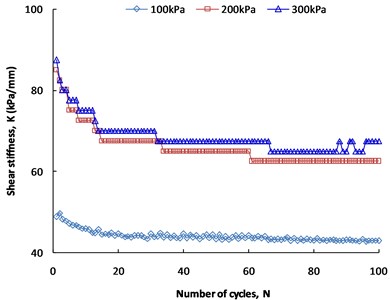
Fig. 13Damping ratio under different normal stresses
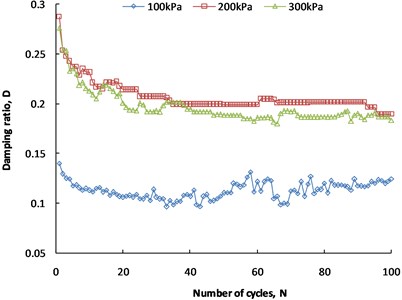
Fig. 12 shows that the shear stiffness under different normal stresses decreases with the number of cycles, decreases rapidly during the initial stage of the shearing cycle, and then decreases slowly after 15 cycles. The shear stiffness under normal stresses of 200 kPa and 300 kPa decreases stepwise, which indicates that the soil-geosynthetic interface presents shear softening at small displacement amplitudes, which is completely contrary to the shear hardening shown in Fig. 10, and the main reason is that the shear displacement amplitude is different. When the displacement amplitude is small (e.g., 2 mm), the position of the soil particles near the interface does not adjust sufficiently. Because the soil is denser before shearing, the soil particles near the interface are loosened by cyclic shearing, which leads to a decrease in soil compactness. Therefore, the reduction in the cohesive force between the soil particles results in shear softening. The shear stiffness under a normal stress of 100 kPa is significantly lower than that under the other two normal stresses at the same cycle number. The shear stiffness under a normal stress of 300 kPa is slightly greater than that of 200 kPa, which indicates that the larger the normal stress, the greater the shear stiffness is. Relevant studies show that the shear strengths of the soil-geosynthetic interface and pure soil both coincide with the Mohr-Coulomb theorem, so an increase in the normal stress will inevitably lead to an increase in the shear stiffness [10].
Fig. 13 shows that the damping ratio decreases with the cycle number during the first 30 cycles under different normal stresses and then gradually stabilizes without any significant decrease. During the first 100 cycles, the damping ratio under a normal stress of 100 kPa is obviously smaller than that under the other two normal stresses with the same cycle number, and the damping ratio under 200 kPa is slightly larger than that under 300 kPa. Combined with Fig. 6, when the cycle number exceeds 400, the damping ratio under 300 kPa increases gradually and is larger than that under 200 kPa, which indicates that the greater the normal stress is, the faster the energy dissipation of the interface. LIU et.al., [20]studied the cyclic shear behavior of the geogrid-sand interface and found that the damping ratio tended to be the same with the number of cycles under different normal stresses, which is different from the conclusion of this paper. The reasons for this difference lie in the following: (1) different soil samples are used in the cyclic shear tests, and the properties of sand and coarse-grained soil are quite different; (2) the number of shear cycles differs greatly, and the results obtained in reference [20] using 10 cyclic shear tests may be unilateral and partial; (3) the normal stresses of cyclic shear are different, and the normal stresses (30 kPa, 60 kPa and 90 kPa) of reference [20] are less than those of this paper.
6. Conclusions
The large-scale cyclic direct shear tests are carried out to obtain the shear stiffness and damping ratio of the reinforced soil interface, and the law of the parameters with number of cycles under different shear displacement and vertical stress is analyzed. The main conclusions drawn are as follows: (1) The shape of the hysteretic curves at different displacement amplitudes is different. The deformation of the soil-geosynthetic interface shows shear dilatancy under loading and shear contraction under unloading during cyclic shear, and the overall deformation of the specimen after cyclic shear is shear contraction; (2) With the increase of the number of cycles, the shear stiffness decreases and tends to be stable, but the change of the damping ratio is related to vertical stress; (3) The larger the displacement amplitude is, the larger the shear stiffness and damping ratio are; the larger the vertical stress is, the larger the shear stiffness and damping ratio are.
It should be noted that this study has discussed only the performance of coarse-grained soil against geogrid interface, and it is difficult to provide comprehensive guidance for engineering practice. Therefore, more large scale cyclic shear tests of different types of reinforcement materials and soil should be carried out in the future.
References
-
Ling T. Q., Zhou B., Wu C. B. Study of influence factors on tendons-soil interface characteristic. Journal of Traffic and Transportation Engineering, Vol. 9, 2009, p. 7-12.
-
Li D. X., Deng W. D., Ge J. Deformation analysis on reinforced embankment taking into account of creep of geogrid. Journal of Chang’an University, Vol. 31, 2011, p. 23-27.
-
Liu C. N., Zornberu J. U., Chen T. C. Behavior of geogrid-sand interface in direct shear mode. Journal of Geotechnical and Geoenvironmental Engineering, Vol. 135, 2009, p. 1863-1871.
-
Xu C., Meng F. X. Effects of shear rate and material properties on shear strength of geosynthetic-soil interface. Rock and Soil Mechanics, Vol. 31, 2010, p. 3101-3106.
-
Liu W. B., Zhou J. Experimental research on interface friction of geogrid and soil. Rock and Soil Mechanics, Vol. 30, 2009, p. 965-970.
-
Biabani M. M., Indraratna B., Nimbalkar S. Assessment of interface shear behaviour of sub-ballast with geosynthetics by large-scale direct shear test. Procedia Engineering, Vol. 143, 2016, p. 1007-1015.
-
Sweta K., Hussaini S. K. K. Behavior evaluation of geogrid-reinforced ballast-subballast interface under shear condition. Geotextiles and Geomembranes, Vol. 47, 2019, p. 23-31.
-
Khoury C. N., Miller G. A., Hatami K. Unsaturated soil-geotextile interface behavior. Geotextiles and Geomembranes, Vol. 29, 2011, p. 17-28.
-
Basudhar Anubhav P. K. Modeling of soil-woven geotextile interface behavior from direct shear test results. Geotextiles and Geomembranes, Vol. 28, 2010, p. 403-408.
-
Lee K. M., Manjunath V. R. Soil-geotextilc interface friction by direct shear test. Canadian Geotechnical Journal, Vol. 37, 2000, p. 238-242.
-
Choudhary A. K., Krishna A. M. Experimental investigation of interface behaviour of different types of granular soil/geosynthetics. International Journal of Geosynthetics and Ground Engineering, Vol. 2, 2016, p. 2-11.
-
Bfrgado D. T., Ramana G. V., Sia H. I. Evaluation of interface shear strength of composite liner system and stability analysis for a landfill lining system in Thailand. Geotextiles and Geomembranes, Vol. 24, 2006, p. 371-393.
-
Vangla P., Gali M. L. Effect of particle size of sand and surface asperities of reinforcement on their interface shear behaviour. Geotextiles and Geomembranes, Vol. 44, 2016, p. 254-268.
-
Punetha P., Mohanty P., Samanta M. Microstructural investigation on mechanical behavior of soil-geosynthetic interface in direct shear test. Geotextiles and Geomembranes, Vol. 45, 2017, p. 197-210.
-
Zhang G., Zhang J. M. Experimental study of cyclic behavior of interface between soil and structure. Chinese Journal of Geotechnical Engineering, Vol. 26, 2004, p. 254-258.
-
Mortara G., Mangiola A., Ghionna V. N. Cyclic shear stress degradation and post cyclic behaviour from sand-steel interface direct shear tests. Canadian Geotechnical Journal, Vol. 44, 2007, p. 739-752.
-
Nye C. J., Fox P. J. Dynamic shear behavior of a needle-punched geosynthetic clay Liner. Journal of Geotechnical and Geoenvironmental Engineering, Vol. 133, 2007, p. 973-983.
-
Fox P. J., Ross J. D., Sura J. M. Geomembranc damage due to static and cyclic shearing over compacted gravelly sand. Geosynthetics Internationa1, Vol. 18, 2011, p. 272-279.
-
Vieira C. S., Lopes M. L., Caldeira L. M. Sand geotextile interface characterisation through monotonic and cyclic direct shear tests. Geosynthetics International, Vol. 20, 2013, p. 26-38.
-
Liu F. Y., Wang P., Wang J. Experimental research on reinforcement-soil interface stiffness and damping ratio under cyclic shearing. Rock and Soil Mechanics, Vol. 37, 2016, p. 159-165.
-
Zimmie T. F. Estimation of dynamic interfacial properties of geosynthetics. Geosynthetics International, Vol. 5, 1998, p. 17-39.
-
Kamalzare M., Ziaie Moayed R. Influence of geosynthetic reinforcement on the shear strength characteristics of two-layer sub-grade. Acta Geotechnica Slovenica, Vol. 8, Issue 1, 2010, p. 39-49.
-
De A., Zimmie T. F. Estimation of dynamic interfacial properties of geosynthetics. Geosynthetics International, Vol. 5, Issues 1-2, 1998, p. 17-39.
-
Chen A. J., Zhang J. S. Strength and deformation characteristics of silty sand improved by gravel. KSCE Journal of Civil Engineering, Vol. 23, Issue 2, 2019, p. 525-533.
-
Lopes P. C., Lopes M. L., Lopes M. P. Shear behaviour of geosynthetics in the inclined plane test – influence of soil particle size and geosynthetic structure. Geosynthetics International, Vol. 8, Issue 4, 2001, p. 327-342.
-
Zhao H., Zheng J., Deng W. Semi-supervised broad learning system based on manifold regularization and broad network. in IEEE Transactions on Circuits and Systems I: Regular Papers, Vol. 67, Issue 3, 2020, p. 983-994.
-
Deng W., Xu J., Zhao H. An improved ant colony optimization algorithm based on hybrid strategies for scheduling problem. IEEE Access, Vol. 7, 2019, p. 20281-20292.
-
Deng W., Zhao H., Yang X. Study on an improved adaptive PSO algorithm for solving multi-objective gate assignment. Applied Soft Computing, Vol. 59, 2017, p. 288-302.
-
Deng W., Zhao H., Zou L. A novel collaborative optimization algorithm in solving complex optimization problems. Soft Computing, Vol. 21, Issue 15, 2017, p. 4387-4398.
About this article

