Abstract
Functional electrical stimulation of the spinal cord can evoke limb movement in patients with motor dysfunction caused by injury or pathology. Research question: However, the adjustment function of micro-stimulation signal parameters in the spinal cord on the motion of hind limbs about rodents has not been identified. The amplitude, frequency and pulse width of the spinal cord micro-stimulation signal were adjusted to quantitatively analyze the changes of the joint angles when the hindlimb produced extension and flexion responses. When the rat’s extension and flexion responses are induced, the optimal stimulus signal amplitudes are 40 µA and 90 µA respectively. At the same time, the optimal stimulation signal frequency range is (35±5) Hz and the best pulse width of the stimulation signal is 200 µs. The results can provide a further reference for the development of spinal cord stimulator for hindlimb regulation.
Highlights
- The machine learning module was used for captures the gait of rats
- Different electrical signal were adjusted to quantitatively analyze the gait of rats
- This study provide a further reference for the development of hindlimb regulation stimulator
1. Introduction
Intraspinal micro-stimulation (ISMS) induces movement by directly stimulating the ventral motor circuit of the spinal cord to recruit more motor units [1, 2]. In recent years, intraspinal micro-stimulation has been used as a treatment method for spinal cord injury and successfully induced limb movement [3-6]. Studies have shown that parameters such as electrode structure, the position of spinal cord stimulation, frequency and amplitude of stimulation signal are key factors determining the motor output [7-9], and adjusting the frequency, amplitude and pulse width of micro-stimulation signals in the spinal cord can change the intensity of muscle contraction [10-13]. A typical muscle is made up of hundreds or even thousands of fibers arranged as functional clusters of motor units [14]. As the intensity of the stimulus increases, the activated motor unit increases, resulting in an increase in the output force [15]. In healthy and paralyzed muscles, the linear relationship between the intensity of the current and the generation of the force has been described [15-17]. The relationship between force and frequency indicates that the increase in stimulus frequency leads to an increase in muscle strength, while high frequency leads to muscle fatigue [18]. With the increase of pulse duration, lower stimulation intensity is required to activate the surrounding motor nerves and achieve the required force output [19]. However, pulse duration may affect muscle tone, leading to muscle fatigue [20]. Many studies have shown that the parameters regulating stimulation signal have an effect on hind limb movement, for example, the effects of pulse frequency and duration on muscle torque and fatigue have been studied [21], the exact mapping between the parameters of spinal cord micro-stimulation signal and the changes in joint angles induced by hind limb movement in rats is still unclear.
2. Materials and methods
2.1. Experimental rats and stimulating electrodes
All protocols involving the use of animals in this study were approved by the Institutional Animal Care and Use Committee of Nantong University, China (Approval No. 20190225-008) on February 26, 2019. A total of 6 Sprague-Dawley rats (8 weeks, both sexes, weighing 220-250 g) were purchased from the Experimental Animal Center of Nantong University (License No. SYXK (Su) 2017-0046). After intraperitoneal injection of 10 % chloral hydrate (4 mL/kg), the hair of the back and right hindlimb was removed after anesthesia, and 75 % rubbing alcohol was used to sterilize T13-L3 of the segment of the spine. The skin was cut along the spine to expose the spinal cord. All experiments were acute. Stimulating electrode used tungsten electrode (produced by Microprobes company, United States); The electrode model for WE30030.5A3, 0.081 mm diameter of axle, cutting-edge 2-3 microns in diameter, 0.5 mΩ impedance.
2.2. Stimulation signal and location
The stimulation signal parameters are set by master-9 pulse stimulator (Israel A.M.P.I. company). The number of repetitions of stimulation pulses is 40. The stimulus isolator (Iso-flex, Israel A.M.P.I.) adjusts the amplitude of the stimulus current. The research group has applied functional electrical stimulation technology to complete the determination of the core area of hindlimb motor function in rats [22]. The rats were placed on a fully automatic stereotactic device (51700, Stoelting, USA), the spinal cord was fixed with a rat spinal adapter, and electrodes, assisted by the stereotactic device, were implanted into the core functional areas of extension and flexion.
2.3. Data collection and processing
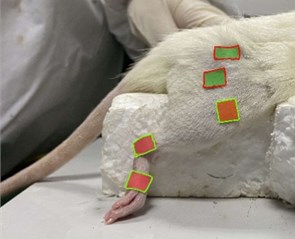
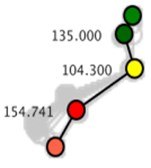
Machine vision module OpenMV Cam M7 was used to capture the right hindlimb movement of rats. According to the posterior limb skeleton of the rat (Fig. 1(a)), the sagittal motion model of the posterior limb of the rat was established (Fig. 1(b)). Five self-made color labels were attached to the anterior superior iliac spine, hip, knee, ankle and the top of the fifth bone of the posterior limb according to the motion model. All the color labels were operated by the same person.
Fig. 1Schematic diagram of rat hind limb skeleton and model of sagittal plane motion
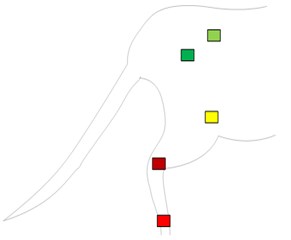
a) Skeleton and color label of hindlimb
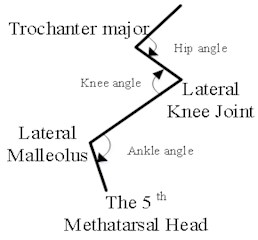
b) Schematic diagram of skeleton model of hind limb
The machine vision module OpenMV CAM was fixed on a square block and placed 10 cm away from the right hind limb of the rat (in this way, the color label of each joint of the hind limb of the rat could be identified optimally). Meanwhile, the module was connected to a personal computer, and the coordinate information of the color label was collected in real time by using OpenMV IDE. Before recording the posterior limb movement, the angle baselines of the hip, knee and ankle before and after stimulation were recorded respectively.
According to the coordinate information of each joint, the vector of the hip pointing to the anterior superior iliac spine is defined as , the vector of the hip pointing to the knee joint is defined as , the vector of the ankle pointing to the knee joint is defined as , and the vector of the ankle pointing to the fifth extension bone is defined as . The angle of each joint is defined as the angle formed between the joint and the adjacent proximal and distal joint positions. The of the hip joint includes angle between the anterior superior iliac spine and the knee joint, as shown in Eq. (1). The of the knee joint includes angle between the hip joint and the ankle joint, as shown in Eq. (2). The of the ankle joint includes angle between the knee joint and the tip of the fifth extension bone, as shown in Eq. (3):
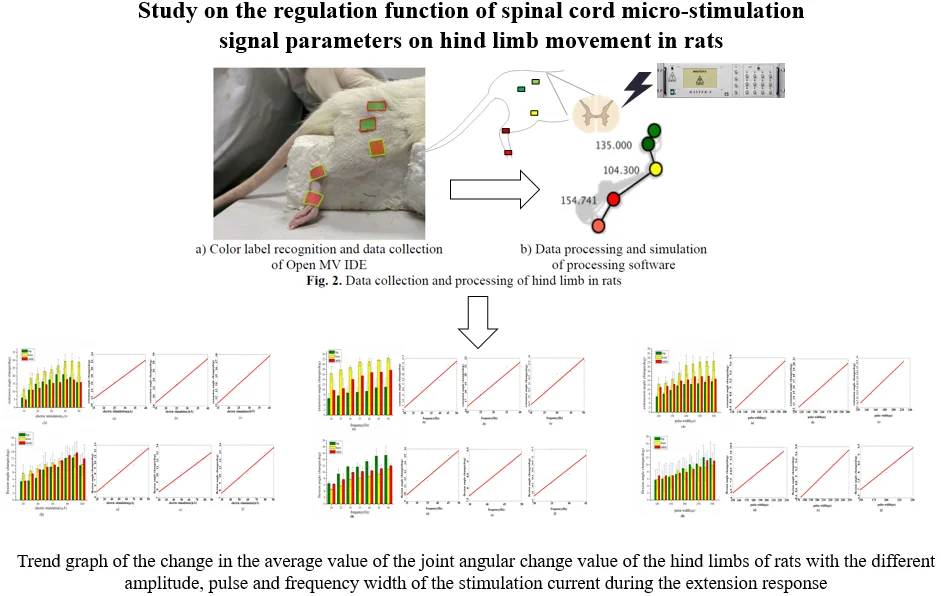
According to the definition of each joint angle, the position coordinate information of each joint is converted into the corresponding joint angle by using the custom processing code. For each animal, we quantified the changes in joint angles (starting from the initial angle) in the extension and flexion responses of the hind limbs of rats at different stimulation parameters. Taking the response of the extension as an example, the data collection and processing process are shown in Fig. 2. The variables selected the range from baseline angle before the stimulation to the maximum angle of joint formation at the time of the stimulation. Finally, the bar chart of mean and standard deviation (mean ±SD) of different joint angles of six rats under different stimulation parameters was drawn.
Fig. 2Data collection and processing of hind limb in rats
a) Color label recognition and data collection of Open MV IDE
b) Data processing and simulation of processing software
2.4. Statistical analysis
The least square regression analysis by MATLAB was performed to analyze the correlation between the mean angular change of hip, knee and ankle joints and stimulation signal parameters. The value of the determination coefficient is shown in Eq. (4):
where: , is the total sum of squares; is the sum of regressive squares; is the sum of squared residuals; is the actual value; is the predicted value; is the average of the actual values. determines how close the correlation is, and the closer it gets to one, the more relevant the dependent variable is to the independent variable.
The results were statistically analyzed by SPSS software for one-way ANOVA comparison of different joint angles under the different parameters of the stimulation signal. 0.05 on both sides was set as statistically significant difference.
2.5. Results and analysis
First, the angle of each joint about normal rats walk on four legs were measured, the initial angle of the hip is 97.1°± 6.2°, the initial angle of knee is 76°±16°, the initial angle of ankle is 101°± 9.8°. After data processing, the values of angles exceeding the maximum range were deleted to obtain the trend diagram between the following angular changes in joints and stimulation parameters. To determine the mapping relationship between single parameter and hindlimb motion, other parameters were kept unchanged.
2.6. Regulation of hindlimb movement by stimulus signal amplitude
To study the influence of amplitude on various joints during the extension and flexion of hind limbs of rats, the frequency and pulse width were set as 33.33 Hz and 200 μs.
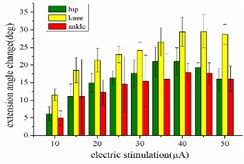
When hind limbs produce the extension response, the amplitude of each stimulus current is set as 10, 15, 20, 25, 30, 35, 40, 45 and 50 μA, respectively. The variation trend of the mean angular change corresponding to the hip joint, knee joint and ankle joint of rats with the amplitude of stimulation current is shown in Fig. 3(a). When the stimulation current is in the range of 10-40 μA, the angular change value of the hip joint increases with the increase of the stimulation amplitude. After that, the amplitude of the stimulation current continued to increase while the angular change value of the hip joint begins to decrease. When the stimulation amplitude is in the range of 10-45 μA, the angular change value of the knee joint showed an upward trend. Until the amplitude of the stimulation current is greater than 45 μA, the angular change of the knee joint begins to decrease. The angular change value of the ankle joint continues to increase in the range of 10-40 μA, and with the amplitude of the stimulation increased, the angular change value of the ankle joint begins to decrease.
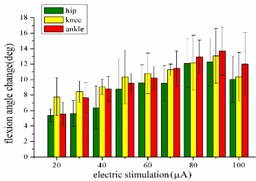
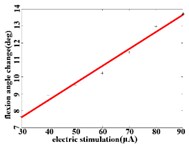
When hind limbs produce flexion response, the threshold current required is larger than the threshold current that produces the extension response. The amplitude of each stimulation current is set to 20, 30, 40, 50, 60, 70, 80, 90, and 100 μA. The average change of the angles of the hip, knee, and ankle of the hind limbs with the amplitude of the stimulation current is shown in Fig. 3(b). When the stimulation current is in the range of 20-90 μA, the average angular change of hip joint and knee joint on the rising trend; after reaching the extreme value, the stimulation current continues to increase, while the average angular change of hip joint and knee joint begins to decrease. The average angular change value of the ankle joint increases significantly in the range of 20-80 μA. The stimulation current is continuously increased, but the angle change of the ankle joint shows a downward trend.
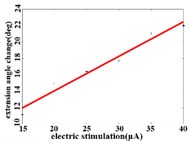
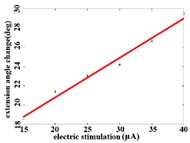
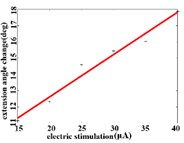
In order to obtain the optimal range of stimulation current, the linear regression analysis is performed on the different current and average angular change value of each joint. It can be concluded that in the extension response, when the current is within the stimulation current range of 15-40 μA, the average angular change value of the hip joint has an optimal linear regression model 5.6269 + 0.4202 with the determination coefficients 0.9704 and 0.0003 (Fig. 3(a1)). When the stimulation current range is in 15-40 μA, the average angular change value of knee joint has the best linear regression model 12.6421 + 0.4686 with the determination coefficient 0.9831, 0.0001 (Fig. 3(a2)). When the stimulation current range is in 15-40 μA, the average angular change value of the ankle joint has the best linear regression model 7.4073 + 0.2605 with the determination coefficients 0.9711 and 0.0003 (Fig. 3(a3)).
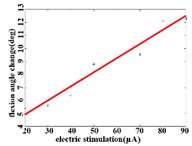
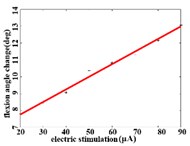
When a flexion response is produced in the right hind limb of a rat, the average angular change value of hip joint has the best linear regression model 2.74370.1085 with the determination coefficient 0.9514, 0.0000 (Fig. 3(b1)) in the stimulation current range of 20-90 μA. The average angular change value of knee joint has the best linear regression model 6.2747 0.0746 with the determination coefficient 0.9903, 0.0000 (Fig. 3(b2)) in the current range of 20-90 μA. The average angular change value of the ankle joint has the best linear regression model 4.5894 + 0.1007 with the determination coefficient 0.9862, 0.0000 (Fig. 3(b3)) in the current range of 30-90 μA.
Fig. 3a) Trend graph of the change in the average value of the joint angular change value of the hind limbs of rats with the amplitude of the stimulation current during the extension response: a1) optimal linear regression model of hip joint and stimulation current in extension response, a2) optimal linear regression model of knee joint and stimulation current in extension response, a3) optimal linear regression model of ankle joint and stimulation current in extension response; b) trend graph of the change in the average value of the joint angular change value of the hind limbs of rats with the amplitude of the stimulation current during the flexion response: b1) optimal linear regression model of hip joint and stimulation current in flexion response, b2) optimal linear regression model of knee joint and stimulation current in flexion response, b3) optimal linear regression model of ankle joint and stimulation current in flexion response
a)
a1)
a2)
a3)
b)
b1)
b2)
b3)
2.7. Regulation of frequency of stimulus signals on hindlimb movement.
When studying the effect of frequency on the joints of hind limbs during extension and flexion, the pulse width is 200 μs, and the current values are 40 μA in the extension response and 90 μA in the flexion response, respectively.
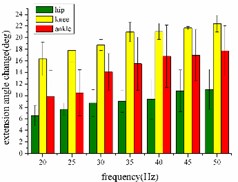
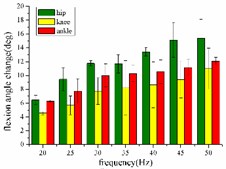
In the extension response, the frequency of each stimulation signal is set to 20, 25, 30, 35, 40, 45, and 50 Hz, respectively. The average angular change of the hip, knee and ankle of the hind limbs of the rats with the frequency of the stimulation signal is shown in Fig. 4(a). In the whole stimulation frequency range of 20-50 Hz, the average angular change value of each joint increases with the increase of frequency.
When the hind limbs of the rat produce the flexion response, the average angular change value of the hip, knee and ankle joints with the frequency of the stimulation signal is shown in Fig. 4(b). In the whole stimulation frequency range of 20-50 Hz, the average angular change value of each joint increases with the increase of frequency.
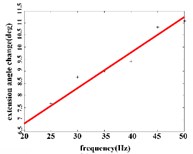
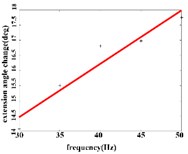
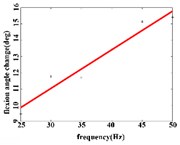
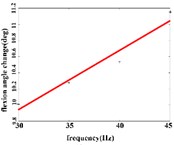
In the extension response, the average angular change value of the hip joint has the optimal linear regression model 3.8827 + 0.1474 with the coefficient of determination 0.9651, 0.0001 (Fig. 4(a1)) when the frequency range is in 20-50 Hz. The average angular change of the knee joint is in the frequency range of 20-40 Hz, the optimal linear regression model 10.5291 + 0.2882 with the coefficient of determination 0.9828 and 0.0010 (Fig. 4(a2)). The average angular change of the ankle joint is in the frequency range of 30-50 Hz, and has the optimal linear regression model 8.8348 + 0.1782 with the coefficient of determination 0.9688, 0.0024 (Fig. 4(a3)).
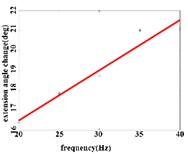
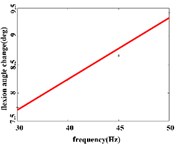
In the flexion response, the average angular change of the hip joint can be obtained an optimal linear regression model 3.9315 + 0.2368 with the determination coefficient 0.9460, 0.0011 (Fig. 4(b1)) in the frequency range of 25-50 Hz. The average angular change of the knee joint has the optimal linear regression model 4.4306 + 0.1088 with the determination coefficients 0.9828, 0.0086 (Fig. 4(b2)) in the frequency range of 30-45 Hz. The average angle change of the ankle joint has the best linear regression model 7.7389 + 0.0734 with the coefficient of determination 0.9469, 0.0269 (Fig. 4(b3)) in the frequency range of 30-45 Hz.
Fig. 4a) Trend graph of the change in the average value of the joint angular change value of the hind limbs of rats with the frequency of the stimulation current during the extension response; a1) optimal linear regression model of hip joint and frequency in extension response; a2) optimal linear regression model of knee joint and frequency in extension response; a3) optimal linear regression model of ankle joint and frequency in extension response; b) trend graph of the change in the average value of the joint angular change value of the hind limbs of rats with the frequency during the flexion response; b1) optimal linear regression model of hip joint and frequency in flexion response; b2) optimal linear regression model of knee joint and frequency in flexion response; b3) optimal linear regression model of ankle joint and frequency in flexion response
a)
a1)
a2)
a3)
b)
b1)
b2)
b3)
2.8. Regulation of pulse width of stimulation signals on hindlimb movement
When studying the effects of pulse width on the joints of hind limbs during extension and flexion response, the frequency is set to 33.33 Hz, and the current values are 40 μA in the extension response and 90 μA in the flexion response, respectively.
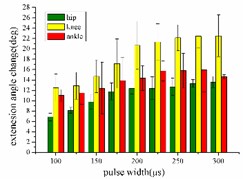
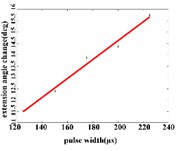
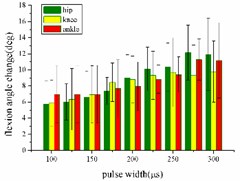
In the extension response experiment, the pulse width of each stimulation signal is set to 100, 125, 150, 175, 200, 225, 250, 275, and 300 μs, respectively. The average angular change value of the hip, knee and ankle joint of the rats with the pulse width is shown in Fig. 5(a). In the entire pulse width range of 100-300 μs, the average angular change of the hip and knee joints increases with the increase of the pulse width. The average angular change values of the ankle begin to decrease after the pulse width is greater than 275 μs.
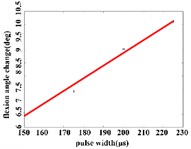
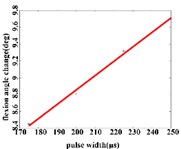
In the flexion response, the pulse width is set to 100, 125, 150, 175, 200, 225, 250, 275 and 300 μs. The average change values of the angles of the hip, knee and ankle joint with the pulse width are shown in Fig. 5(b). When the stimulation pulse width is in 100-300 μs, the angular change of the hip joint shows an upward trend; the average angular change of the knee joint has decreased after the pulse width reaches 250 μs, and the average angle change of the ankle joint has begun to decrease after the pulse width reaches 275 μs.
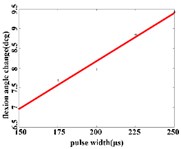
Fig. 5a) Trend graph of the change in the average value of the joint angular change value of the hind limbs of rats with the pulse width of the stimulation current during the extension response; a1) optimal linear regression model of hip joint and pulse width in extension response; a2) optimal linear regression model of knee joint and pulse width in extension response; a3) optimal linear regression model of ankle joint and pulse width in extension response; b) trend graph of the change in the average value of the joint angular change value of the hind limbs of rats with the pulse width during the flexion response; b1) optimal linear regression model of hip joint and pulse width in flexion response; b2) optimal linear regression model of knee joint and pulse width in flexion response; b3) optimal linear regression model of ankle joint and pulse width in flexion response
a)
a1)
a2)
a3)
b)
b1)
b2)
b3)
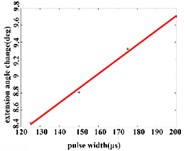
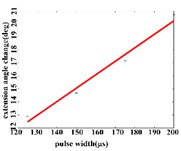
In the extension response, the average angular change of the hip joint has the optimal linear regression model 0.9470 + 0.0588 with the determination coefficient is 0.9615, 0.0194 (Fig. 5(a1)), when the pulse width is in the range of 125-200 μs. The average angular change of the knee joint is in the range of 125-200 μs. It has the best linear regression model –0.4514 + 0.1034 with the determination coefficient 0.9787, 0.0107 (Fig. 5(a2)). The average angular change of the ankle joint is in the range of 125-225 μs. It has the best linear regression model 6.2859 + 0.0417 with the determination coefficients 0.9838, 0.0009 (Fig. 5(a3)).
In the flexion response, the average angular change of the hip joint is in the pulse width range of 150-225 μs, with an optimal linear regression model –0.9341 + 0.0491 with the determination coefficient 0.9860, 0.0070 (Fig. 5(b1)). The average angular change of the knee joint is in the range of 175-250 μs, it has the best linear regression model 5.4492 + 0.0170 with the determination coefficient 0.9954, 0.0023 (Fig. 5(b2)). The average angular change of the ankle joint is in the range of 150-250 μs, it has the best linear regression model 3.3210 + 0.0243 with the coefficient of determination 0.9824, 0.0010 (Fig. 5(b3)).
3. Discussions
It is studied that the relationship between the amplitude, frequency and pulse width of the stimulus signal and the changes in the angles of the joints of the hind limbs of rats. When changing the amplitude of the stimulus signal, combining the angular change of each joint with the trend graph of the amplitude of the stimulus signal can get the best linear model of the change in the angle of each joint. It can be determined that the optimal stimulus amplitude of the extension response is 40 μA, and the optimal stimulus amplitude of the flexion response is 90 μA.
Under the condition of determining the amplitude of the stimulus signal, it was found that during the frequency range of 10-20 Hz, the hind limbs rarely produced completed hind limb movements, so the experimental data during the frequency range of 10-20 Hz was not put into the trend chart for analysis [23]. When the stimulus signal is high frequency, especially when it is greater than 50 Hz, the hind limbs exhibit ankylosing response, the speed becomes faster, and the changes in the angle of each joint increase significantly, but the gait coordination of SCI rats after functional reconstruction is not consistent with these two aspects, so the high-frequency range angle change values are discarded. By synthesizing the trend graph of the angle change value and frequency of each joint and the best linear model, it can be concluded that the optimal frequency of the stimulus signal can be determined at 35 Hz ± 5 Hz.
For the stimulation parameter of pulse width, short pulse width can reduce the stimulation of sensory nerves, but at a certain threshold current, too short pulse width will affect the recruitment of muscle fibers, and in the experiment, the hind limbs showed spasm. Here, the intensity/duration relationship between the threshold amplitude and the pulse duration of the rectangular pulse is approximately hyperbola , where is a constant and is a horizontal asymptotic value [18]. This relationship indicates that as the pulse duration increases, a lower stimulus intensity () is required to activate the surrounding motor nerves to achieve the required force output. Longer pulse width will penetrate deeply into the subcutaneous tissue, causing pain. The pulse duration increased to approximately 600 μs has been shown to result in greater force generation. After that, the closer to the base intensity value , the longer pulses do not necessarily result in greater force generation [24]. In conclusion, combining the trend graph of the angular change value of each joint and the optimal linear regression model, the pulse width can be determined as 200 μs.
4. Conclusions
In this paper, the mapping relationship between the amplitude of the spinal cord micro-excitation signal and the changes of joint angles of hindlimbs in rats was explored. The angle changes of the hip joint, knee joint and ankle joint of the rat's hind limbs under different stimulation current amplitudes were analyzed, and it was found that there is a strong correlation between them. The angle changes of each joint are positively related to the current amplitude. Combining this relationship and the mechanism of neural control, the best range of stimulation current for the response of rats was (40 ± 5) μA, and the best exciting current range for flexion response was (80 ± 10) μA. Analyzing the data, it can be seen that the production of joint angles is coordinated and consistent. The establishment of the amplitude, frequency and pulse width of the stimulus signal provides a reference for the further development of spinal cord stimulator for posterior limb regulation.
References
-
Henneman E. The size-principle: a deterministic output emerges from a set of probabilistic connections. The Journal of Experimental Biology, Vol. 115, 1985, p. 105-112.
-
Bamfordj A., Putman C. T., Mushahwarv K. Intraspinal microstimulation preferentially recruits fatigue-resistant muscle fibers and generates gradual force in rat. The Journal of Physiology, Vol. 569, Issue 3, 2005, p. 873-884.
-
Shen Xiaoyan, Wang Zhigong, Ma Le, et al. Selective control of hindlimb movements based on intraspinal functional electronic stimulation. Journal of Biomedical Engineering, Vol. 35, Issue 6, 2018, p. 860-863.
-
Mushahwar V. Spinal cord microstimulation generates functional limb movements in chronically implanted cats. Experimental Neurology, Vol. 163, Issue 2, 2000, p. 422-429.
-
Wagnerf B., Mignardotj B., Le Goff Mignardotc G., et al. Targeted neurotechnology restores walking in humans with spinal cord injury. Nature, Vol. 563, Issue 7729, 2018, p. 65-71.
-
Gad P., Choe J., Nandra M. S., et al. Development of a multi-electrode array for spinal cord epidural stimulation to facilitate stepping and standing after a complete spinal cord injury in adult rats. Journal of NeuroEngineering and Rehabilitation, Vol. 10, 2013, p. 2.
-
Capogrosso M., Wenger N., Raspopovic S., et al. A computational model for epidural electrical stimulation of spinal sensorimotor circuits. Journal of Neuroscience, Vol. 33, Issue 49, 2013, p. 19326-19340.
-
Wenger N., Moraud E. M., Raspopovic S., et al. Closed-loop neuromodulation of spinal sensorimotor circuits controls refined locomotion after complete spinal cord injury. Science Translational Medicine, Vol. 6, Issue 255, 2014, p. 255ra133.
-
Rejc E., Angelic A., Bryant N., et al. Effects of stand and step training with epidural stimulation on motor function for standing in chronic complete paraplegics. Journal of Neurotrauma, Vol. 34, Issue 9, 2017, p. 1787-1802.
-
Kralj A., Grobelnik S. Functional electrical stimulation a new hope for paraplegic patients. Bulletin of Prosthetics Research, Vol. 10, Issue 20, 1973, p. 75-102.
-
Kralj A., Bajd T., Turk R. Enhancement of gait restoration in spinal injured patients by functional electrical stimulation. Clinical Orthopaedics and Related Research, Vol. 233, 1988, p. 34-43.
-
Bhadra N., Peckhamp H. Peripheral nerve stimulation for restoration of motor function. Journal of Clinical Neurophysiology, Vol. 14, Issue 5, 1997, p. 378-393.
-
Condie E., Condie D. Functional electrical stimulation: standing and walking after spinal cord injury. Physiotherapy, Vol. 76, Issue 4, 1990, p. 223.
-
Lavrov I., Musienkop E., Selionovv A., et al. Activation of spinal locomotor circuits in the decerebrated cat by spinal epidural and/or intraspinal electrical stimulation. Brain Research, Vol. 1600, 2015, p. 84-92.
-
Adams G. R., Harris R. T., Woodard D., et al. Mapping of electrical muscle stimulation using MRI. Journal of Applied Physiology, Vol. 74, Issue 2, 1993, p. 532-537.
-
Hillegass E. A., Dudley G. A. Surface electrical stimulation of skeletal muscle after spinal cord injury. Spinal Cord, Vol. 37, Issue 4, 1999, p. 251-257.
-
Bickel C. S., Slade J., Dudley G. Long-term spinal cord injury increases susceptibility to isometric contraction-induced muscle injury. European Journal of Applied Physiology, Vol. 91, Issues 2-3, 2004, p. 308-313.
-
Bickel C. S., Gregory C. M., Dean J. C. Motor unit recruitment during neuromuscular electrical stimulation: a critical appraisal. European Journal of Applied Physiology, Vol. 111, Issue 10, 2011, p. 2399-2407.
-
Gorgey A. S., Mahoney E., Kendall T., et al. Effects of neuromuscular electrical stimulation parameters on specific tension. European Journal of Applied Physiology, Vol. 97, Issue 6, 2006, p. 737-744.
-
Gorgey A. S., Poarch H. J., Dolbow D. D., et al. Effect of adjusting pulse durations of functional electrical stimulation cycling on energy expenditure and fatigue after spinal cord injury. Journal of Rehabilitation Research and Development, Vol. 51, Issue 9, 2015, p. 1455.
-
Gregory C. M., Dixon W., Bickel C. S. Impact of varying pulse frequency and duration on muscle torque production and fatigue. Muscle and Nerve, Vol. 35, Issue 4, 2007, p. 504-509.
-
Chen Yi, Ma Lei, Du Wei, et al. Measuring functional core regions of hindlimb movement control in the rat spinal cord with intraspinal microstimulation. Journal of Biomedical Engineering, Vol. 34, Issue 4, 2017, p. 622-626.
-
Nebojsa M., Lana Z., et al. Distributed low-frequency functional electrical stimulation delays muscle fatigue compared to conventional stimulation. Muscle and Nerve, Vol. 42, Issue 4, 2010, p. 556-562.
-
Jeon W., Griffin L. Effects of pulse duration on muscle fatigue during electrical stimulation inducing moderate-level contraction. Muscle and Nerve, 2017, https://doi.org/10.1002/mus.25951.
About this article

This work is supported by National Natural Science Foundation of China (61534003, 81371663) and Opening Project of State Key Laboratory of Bioelectronics in Southeast University, (Ministry of Education in China) Liberal arts and Social Sciences Foundation (17YJC890022), Natural Science Foundation of Jiangsu Province (BK20170448), and the Natural Science Foundation of the Jiangsu Higher Education Institutions of China (16KJB180019), Jiang Su Liberal arts and Social Sciences Foundation (17TYC003).This work is also supported by the “226 Engineering” Research Project of Nantong Government.
