Abstract
The sand absorption performance of the suction cutter affects the sand removal effect of the oil-water separator to a great extent. The bottom flow field model of the separator tank with the suction cutter is established by means of numerical simulation, which includes the determination of the applicable solid-liquid two-phase flow model and the establishment of the basic fluid dynamics equation in line with the reality. After Gambit was used to divide the mesh, Fluent software was used to analyze the influence of sand suction cutter placement Angle, sand suction velocity, sand suction distance and other factors on sand suction performance. It is found that with the adjustment of many factors, the hydraulic sand absorption performance of the suction cutter changes obviously.
Highlights
- The characteristics of sand suction of sand suction nozzle were studied by numerical simulation.
- The volume fraction of the sand in the study area after the same period of time is taken as the evaluation standard of sand suction efficiency.
- The sand suction height and flow velocity have important influences on the sand suction efficiency.
1. Introduction
Oil-water separators will have a large amount of sand deposited after they are used for a long time. If they are not cleaned in time, their separation efficiency will be decreased. Therefore, automatic sand suction device is needed to clean the sand inside the separator [1]. After sufficient time of standing, due to different density, sand is generally deposited on the bottom layer, above which is produced fluid, and the top layer is oil [2]. Therefore, the study model can be simplified as a solid-liquid two-phase flow model of which the bottom part of the separator only includes water and sand space [3].
In the process of sand suction, the flowing water makes the sand deposited at the bottom move irregularly. Considering that the process may cause turbulent flow, and the distribution of sand is relatively complex, under different flow velocities, Angles and distances of sand suction, the efficiency of sand suction will be different obviously. In this paper, the volume fraction of the sand in the study area after the same period of time is taken as the evaluation standard of sand suction efficiency. After the mesh volume stereogram has been created by Gambit software, two-dimensional finite element analysis was performed on it by Fluent software.
2. Fundamental equations
The motion of the fluid conforms to the conservation of mass and the conservation of momentum. The water/sand two-phase flow model in this paper is a continuous medium model.
For the solid-liquid two-phase flow model containing both water and sand, considering the small diameter of sand, the solid phase and liquid phase are taken as two different continuous mediums, that is, the two-fluid model described by Euler method is used for analysis. Solid and liquid phases follow their respective continuity equation and momentum equation respectively, and they are coupled by interaction force. Therefore, the continuity equation under the Euler coordinate system is [4]:
The momentum equation is:
where, is the volume fraction of the phase , is the mass generation term generated by the phase change which can be defaulted as in this case; , and are respectively the viscous stress and the turbulent stress.
The turbulence model uses RNG model. Compared with the standard model, it modified the conditions of equation and improved the accuracy of the equation itself [5]:
The constants in the equation use the default values.
3. Model establishment and solution
3.1. Model establishment and solution
The diameter of the bottom part of a large oil-water separator can be up to 16 m. In this paper, only part of the oil-water separator is selected to study the hydraulic performance and sand suction efficiency of several sand suction nozzles in the static state, and the effect of the movement of nozzle at the bottom is temporarily ignored. To simplify the model as much as possible, the following assumptions are made:
(1) Both the solid and liquid phases are continuous and incompressible fluids;
(2) There is no temperature difference in the flow field and the temperature remains stable;
(3) Ignore the collisions between the grains of sand.
We take a 300 mm long bottom part of the oil-water separator, set 3 sand suction nozzles above, and get the two-dimensional model on the study object. The sand suction nozzle is designed as a cylinder, with a diameter of 10 mm and an inlet velocity of 10 m/s. We take the Angle between the sand suction direction of the suction nozzle and the bottom of the separator, namely, the sand suction Angle, and change the height between the center point of the nozzle inlet section and the sand surface [6]. We created the mesh volume stereogram of the model using Gambit software. The number of nodes is 22606 and the number of cells is 22,200. Boundary conditions of two-dimensional computational model: Water inlet is sand suction inlet, inlet boundary condition is velocity-inlet, initial speed is 10m/s, water outlet is on both sides of the model, and outlet boundary condition is outflow. The boundary condition of the wall surface is set as wall-coupled algorithm. In this paper, the Coupled algorithm is selected to set up the model for 300 iterations and solve the calculation, and the result is convergent.
3.2. Addition of solid particle
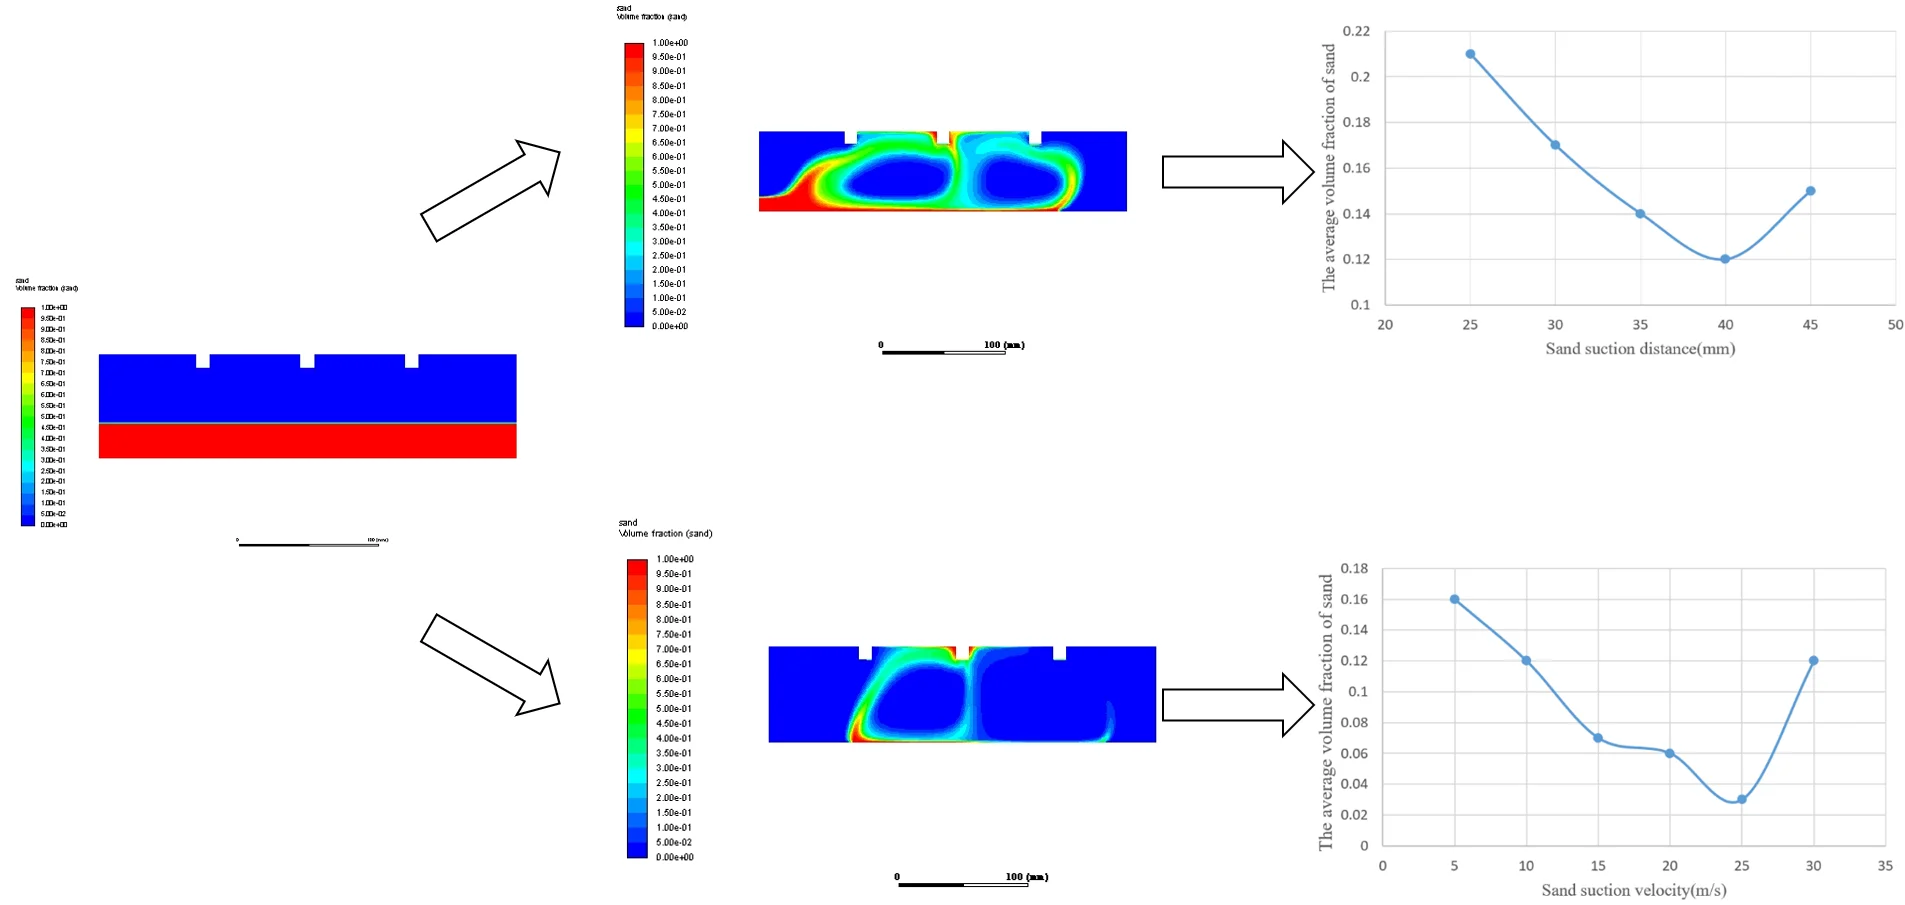
After a period of time of standing of the produced oil, the sand accumulates at the bottom of the separator. During the sand suction, the mud and sand deposited at the bottom scatter in the water phase. Therefore, we need to fill a certain amount of sand at the bottom of the separator before numerical simulation. As shown in Fig. 1, solid particles with a diameter of 0.3 mm are filled within 0-300 mm of axis and 0-25 mm of axis.
Fig. 1Model and its distribution after filling sand

a)
b)
3.3. Basic parameter setting
The sand suction efficiency shall be evaluated taking the volume fraction of sand in the study area after the same period of time as the standard, so the process of sand being sucked by the nozzle over time is unsteady flow. We set water as the main phase and sand as the second phase, use the double Euler model. Other parameters are shown in Table 1.
Other related parameters use default values; the calculation ends when the solution results tend to be stable.
Table 1The basic parameters
Parameter | Unit | Value |
Water density | kg/m3 | 998.2 |
Water viscosity | kg/m·s | 0.001003 |
Sand density | kg/m3 | 2600 |
Sand viscosity | kg/m·s | 1.79e-05 |
Inlet velocity | m/s | 10 |
Acceleration of gravity | m2/s | 9.8 |
Thickness of sand | mm | 25 |
4. Results and analysis of simulation
4.1. Analysis of sand flow process
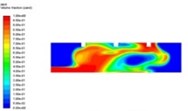
After negative pressure is formed inside the sand suction nozzle, the fluid is sucked into the sand suction nozzle at a certain velocity. There will form a section between velocities of the fluid with momentum and the surrounding fluid. This section will lose stability and produce a eddy after being perturbed. As the time going, the fluid body gradually changes from water to solid-liquid two-phase flow mixed with sand and water, which makes sand particles scatter in a certain area and tends to flow towards the suction nozzle.
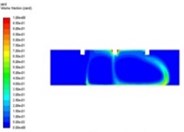
The process of sand suction nozzle sucking sand grains is mainly divided into three stages: initial sand state, sand fluidization state and stable state. Fig. 2 shows the cloud map of the volume fraction of sand particles in the oil-water separator at different times.
Fig. 2The distribution of sand grains at different times
a)1 s
b)5 s
c)10 s
d)20 s
e)30 s
f)60 s
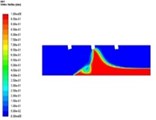
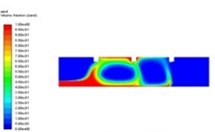
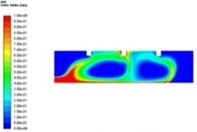
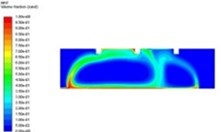
In Fig. 2, part of the bed surface forms sand pits in the initial stage. With the increase of eddies, a large number of sand continuously rises and falls, and sand grains close to the suction nozzle are sucked into the suction nozzle. Other sand grains continue to sink after getting away from the eddies until they come into contact with the next eddy. As can be seen from the Figure, with the going of time, the volume fraction of sand in the study area decreases continuously until the bottom contains only a small amount of sand.
4.2. Influence of sand suction Angle on sand suction effectiveness
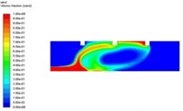
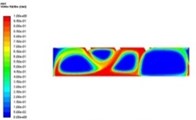
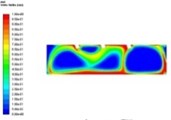
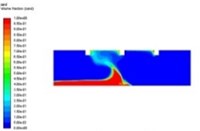
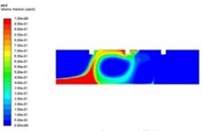
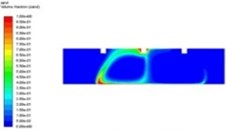
Fig. 3 shows the influence of different sand suction angles on the volume distribution of sand in the separator, at the same distance from the sand surface and at the same sand suction velocity within 60 seconds. When the sand suction Angle is 60° and 70°, there is a relatively serious fluctuation at the bottom of the separator. This is caused by too large component of sand suction velocity along the X-axis that causes the sand grains to be thrown to both sides of the separator by the eddy generated by the velocity section, which reduces the sand suction efficiency. When the sand suction Angle reaches 80°, the sand suction process starts to become stable, but the sand suction speed is slow. When the sand suction Angle is equal to 90°, the sand particles can be fully sucked away and the sand suction efficiency is the highest.
Comparing the results of sand suction angles of 60°, 70°, 80° and 90°, it is found that the sand suction efficiency is the highest at 90°, so we select the sand suction angle of 90° in this paper.
Fig. 3Distribution of sand at different suction angles
a) = 60°
b) = 70°
c) = 80°
d) = 90°
4.3. Influence of sand suction distance on sand suction effectiveness
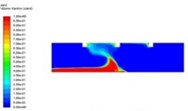
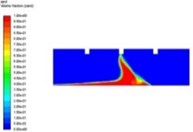
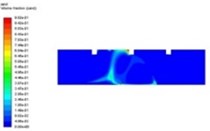
When the sand suction Angle is 90°, set the sand suction distance as 25 mm, 30 mm, 35 mm, 40 mm and 45 mm to observe the volume distribution of sand at different distances at the time of 30 s, as shown in Fig. 4.
Fig. 4Sand distribution at different sand suction distances
a)=25mm
b)= 30 mm
c)= 35 mm
d)= 40 mm
e)= 45 mm
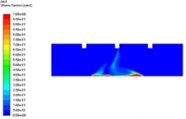
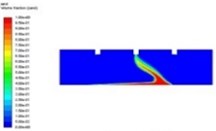
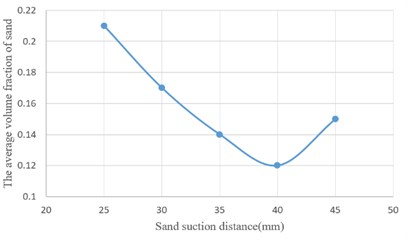
It can be seen from the figure that when the distance is 25 mm and 30 mm, the fluid around the suction nozzle is unstable, and the generated eddies causes the sand particles to scatter to both sides; when the distance of sand suction is 35 mm and 40 mm, the fluid starts to become stable. Most of the sand particles that rises to the vicinity of the sand suction nozzle along the motion track enter the sand suction nuzzle, and a small amount of sand particles sink to the bottom down to a stable state after jumping and moving; when the distance is increased to 45 mm, the momentum gained by the sand particles decreases due to the large distance, and the velocity section enlarges, resulting in the increase of eddies and that part of the sand particles can’t be sucked into the nozzle. The average volume fraction of sand grains at different sand suction distances is plotted as a curve, as shown in Fig. 5.
Fig. 5Curve of sand volume fraction at different sand suction distances
4.4. Influence of sand suction flow velocity on sand suction effectiveness
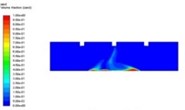
Because the fluid movement enables the sand particles to be sucked into the nozzle, the flow velocity of sand suction will directly determine the effectiveness of sand suction. Fig. 6 shows the distribution of sand grains after 40 s of suction at different flow velocities.
Fig. 6Distribution of sand grains at different suction rates
a)= 5 m/s
b)= 10 m/s
c)= 15 m/s
d)= 20 m/s
e)= 25 m/s
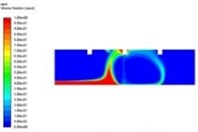
f)= 30 m/s
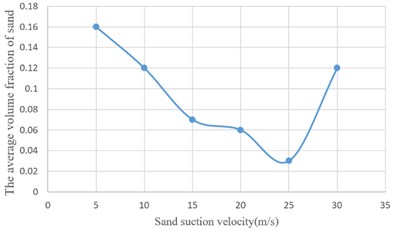
According to Fig. 6, with the increasing of the sand suction velocity, the amount of residual sand gradually decreases after a certain period of time. When the suction velocity is 5 m/s-10 m/s, the suction efficiency is low; the sand particles reach the highest point of the track; because the fluid velocity is not enough to provide the momentum for the sand particles entering the suction nozzle, the sand is easy to fall back to the sand bed surface after being thrown to a far area by eddies, and finally reaches a stable state in whole; when the suction velocity is 15 m/s-25 m/s, the suction efficiency is improved to a certain extent under the condition that the overall fluctuation of the fluid is relatively small, and the sand particles have enough momentum to enter the suction nozzle; when the sand suction velocity reaches 30 m/s, the turbulence intensity rises due to the increase of flow velocity, and the randomness of fluid movement increases. The new abrupt perturbation repeatedly occurs, which changes the original motion track of sand grains, makes some sand grains still suspended in the separator, and reduces the sand absorption efficiency. The curve of sand volume fraction at different sand suction velocities is shown in Fig. 7.
According to the curve, considering the sand suction efficiency and economic benefits, the sand suction velocity can be 15 m/s-25 m/s.
Fig. 7Curve of sand volume fraction at different suction velocity
5. Conclusions
The characteristics of sand suction of sand suction nozzle were studied by numerical simulation. It can be seen from the cloud map of sand volume fraction distribution that the sand suction efficiency changes with the change of sand suction Angle, sand suction height and sand suction velocity in the same time period: The larger the sand suction Angle, the smaller the fluid fluctuation and the higher the sand suction efficiency; the higher the sand suction height, the higher the sand suction efficiency, however, excessive sand suction height will lead to increase of eddies and decrease of sand suction efficiency; the higher the sand suction flow velocity, the higher the sand suction efficiency, however, excessive flow velocity will lead to the increase of fluid fluctuation and decrease of sand suction efficiency.
References
-
Azimi Amir H., Qian Yu, Zhu David Z., RajaratnamNallamuthu An experimental study of circular sand-water wall jets. International Journal of Multiphase Flow, Vol. 74, 2015, p. 34-44.
-
Azimi Amir H., Qian Yu, Zhu David Z., RajaratnamNallamuthu Experimental study of sand jet front in water. International Journal of Multiphase Flow, Vol. 40, 2012, p. 19-37.
-
Yeh Po-Hung, Chang Kuang-An, Henriksen John, Edge Billy, Chang Peter, Silver Andrew, VargasAbel Large-scale laboratory experiment on erosion of sand beds by moving circular vertical jets. Ocean Engineering, Vol. 36, Issues 3-4, 2009, p. 248-255.
-
Tong Lele, Zhou Jianxin, Yin Yajun, Shen Xu, Shehabeldeen Taher A., Ji Xiaoyuan, TuZhixin An improved CFD simulation for investigation of the sand particles flow behavior in the sand shooting process. Powder Technology, Vol. 363, 2020, p. 169-180.
-
Luo Kaikai, Wang Yong, Liu Houlin, Chen Jie, Li Yu, YanJun Effect of suction chamber baffles on pressure fluctuations in a low specific speed centrifugal pump. Journal of Vibroengineering, Vol. 21, Issue 5, 2019, p. 1441-1455.
-
Cao Deping, Chiew Yee-Meng, Liu Xiaoxie Effect of suction zone length on sediment transport. Journal of Hydraulic Research, Vol. 53, Issue 1, 2015, p. 49-59.
About this article

