Abstract
This paper presents a numerical study on the impact coefficient calculation of a straight-line -shaped composite beam and a curved box girder beam. A numerical model of vehicle-bridge coupling system is established, where the random irregularity of bridge surface is considered in the model. The effect of lane numbers, bridge surface flatness, vehicle speed, vehicle weight and primary beam stiffness on the impact coefficient are considered. The results indicate that the lane numbers have certain influence on the impact coefficient; the impact coefficient presents nonlinear increment as the bridge surface flatness becomes from grade A to grade D; the vehicle-bridge coupling system can resonate at both low speed and high speed; the vehicle weight has little influence on the impact coefficient; whilst the displacement impact coefficient is decreased with an increment in the primary beam stiffness. Besides, the local and global impact coefficients, the displacement, moment and shear force impact coefficients are also comprehensively discussed.
1. Introduction
The bridge structures will bear dynamic loads except for constant loads during their service period, and the vehicle load is a most common dynamic load. The researches on the dynamic responses of the system are called vehicle-bridge coupling problems [1-5]. The impact coefficient, a dynamic amplification coefficient, reflects the magnitude of the impact action, is of great importance to the safety of bridge structures, especially when the bridge vibration frequency and the vehicle frequency are equal (resonance is occurred). Many researches on the vehicle-bridge coupling vibration responses and the dynamic impact coefficients have been conducted so far, the research contents are mainly focused on the establishment of numerical model [6-8], arithmetic [8-13], the influence of cross section type of beam [14], bridge deck roughness[15, 16], vehicle stiffness and damping [17-20], speed [15, 20], wind [21], randomness of influence factors [21], deceleration [8] and soil properties [7] on the dynamic responses of vehicle-bridge coupling system. Besides, the types of bridge such as PC simply supported box girder bridge with corrugated steel webs [22, 23], highway bridges [24], railway bridges [20] and cable-stayed bridge [25] are also involved.
The aforementioned researches have enriched and improved vehicle-bridge coupling problems. However, the current researches mainly focus on the RC straight-line beam bridge, the researches on the curved beam bridge and steel-concrete composite beam bridge are still limited. Besides, some of concerned researches simplify vehicle model as moving load model without considering the contribution of vehicle stiffness and damping to the system. Moreover, replacing the moment and shear force impact coefficients with the displacement impact coefficient can’t real reflect the mechanic behavior of the structures under vehicle dynamic loads. In view of this, a numerical model of vehicle-bridge coupling is proposed in this study to calculate the dynamic responses of a straight-line π-shaped composite beam and a curved box girder beam, where the effect of lane numbers, bridge surface flatness, vehicle speed, vehicle weight and primary beam stiffness on the impact coefficient are considered. In addition, the local and global impact coefficients, the displacement, moment and shear force impact coefficients are also comprehensively discussed.
2. Numerical model of vehicle-bridge coupling
2.1. Vehicle model
The whole vehicle model with 2 axes is shown in Fig. 1, the tire and suspension system have independent degrees of freedom. Except for the vertical translation and torsion degrees of freedom, the transverse torsion degree of freedom is also included. There are totally 7 degrees of freedom in the model.
As illustrated in Fig. 1, (1, 2, 3, 4) and (1, 2, 3, 4) are the stiffness and damping of the suspension systems respectively, (1, 2, 3, 4) and (1, 2, 3, 4) are the stiffness and damping of the tires respectively, (1, 2, 3, 4) are the masses of tires. , , are the vehicle weight, vertical torsion inertia moment and transverse torsion inertia moment respectively. , are the distances from the vehicle gravity center to the front axis and back axis respectively, , are the distances from the vehicle gravity center to the left axis and right axis respectively. The details of vehicle parameters are shown in Table 1 [26].
Fig. 1Vehicle model with 2 axes
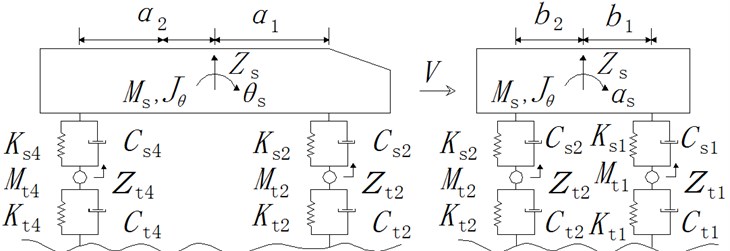
Table 1The details of vehicle parameters [26]
25530 kg | , | 2250 kN/m | |
55259 kg·m2/rad | , | 8000 kN/m | |
6893 kg·m2/rad | , , , | 20 kN·s/m | |
3.479 m | , , , | 445 kg | |
1.021 m | , | 4000 kN/m | |
0.915 m | , | 8000 kN/m | |
0.915 m | , , , | N·s/m |
2.2. Basic principles of vehicle-bridge coupling
The schematic diagram of vehicle-bridge coupling is shown in Fig. 2 [27]. Based on the Hertzian spring contact model, the element node of bridge deck is coupled with spring element node of tire. The details are as follows.
Fig. 2(a) shows the coupling principle for the smooth bridge surface. The high order displacement interpolation functions are utilized, the equations for vertical displacement are given by:
where and are vertical displacement interpolation functions, and are angle interpolation functions, is the length of an element, is the distance from the tire to the element node. Assuming that the tires are in close contact with the bridge deck and there is no separation between them during the whole driving process, the vertical displacement of the tire is given by:
Fig. 2Schematic diagram of vehicle-bridge coupling
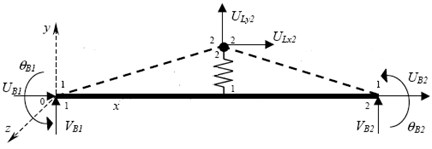
a) The bridge surface is smooth
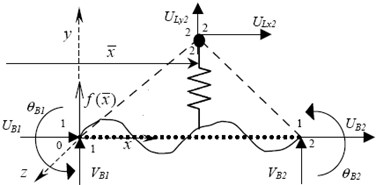
b) The bridge surface is rough
However, the rough bridge surface as shown in Fig. 2(b) will cause the separation between tire and bridge surface, and then contact again, leading to great impact force on the bridge surface. Herein, the random irregularity function is introduced, and the vertical displacement of tire is given by:
The random irregularity function is created by harmonic wave superposition method in the present work, and it is shown as Eq. (8):
where is the amplitude of th sine wave, is the spatial sampling frequency point, is the longitudinal location of bridge surface, is the random phase angle within the range of (0, 2). The power spectral density function is adopted to describe the random irregularity, and it is shown as Eq. (9):
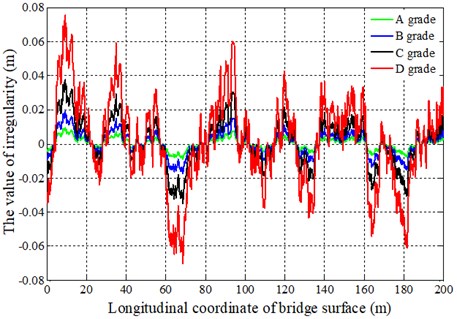
where is the standard spatial frequency, is the spatial frequency, is the roughness coefficient of bridge surface corresponding to . The irregularity curves of bridge surface are created by using triangular series on MATLAB, and they are shown in Fig. 3. It is obvious that from A grade to D grade, the flatness of the bridge surface is excellent, good, average and bad respectively.
Fig. 3The random irregularity curve of bridge surface
2.3. D’ Alembert vibration equation
The Rayleigh damping is adopted in the present work, and it is given by:
where , are the damping coefficients, [] and [] are the element stiffness matrix and mass matrix extracted from the finite element model. The vehicle-bridge coupling vibration equation is acquired by assembling element stiffness matrix, mass matrix, damping matrix and load matrix on MATLAB, and the formula is given by:
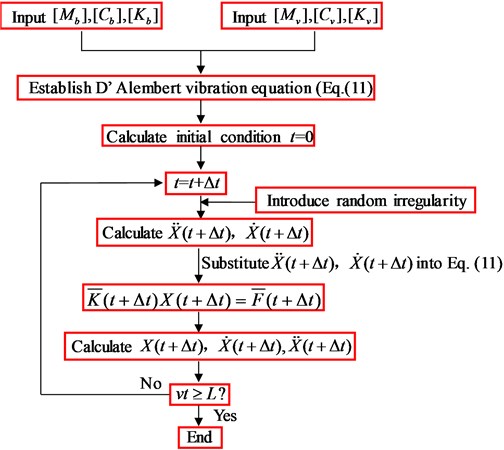
where the subscripts and denote vehicle and bridge respectively, , , are acceleration, velocity and displacement respectively. The dynamic responses can be obtained through Newmark- method as shown in Fig. 4.
Fig. 4Calculation process of dynamic response for vehicle-bridge coupling system
3. Calculations and discussion
3.1. Straight-line -shaped composite beam
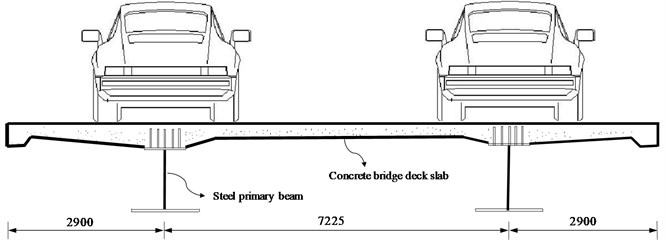
The cross section of a continuous steel-concrete composite beam with 4 spans is shown in Fig. 5. The single span is 35 m and the total span is 140 m. The thickness of concrete (C40) slab is 35 cm. The transverse connection between the two primary beams is strengthened by a crossbeam with a standard spacing of 5 m.
Fig. 5The standard cross section of single span (Unit: mm)
The vehicle-bridge coupling finite element model is established by ANSYS. The bridge deck slab is simulated by SHELL 63 element, the primary beam and the cross beam are simulated by BEAM 188 element. The vehicle body is simulated by MASS 21 element, the suspension and tire are simulated by the COMBIN 14 element. In order to save calculated time, the element stiffness matrix [] and mass matrix [] are extracted from finite element model, and the Newmark- method is adopted on MATAB to obtain dynamic response. In order to validate the reliability of the numerical model of vehicle-bridge coupling, the traditional theoretical-analytical method is also applied as shown in Eq. (12):
where is the moving load, is the stiffness of the beam, is the length of the beam, is the vibration frequency of the bema, is the frequency of the moving load.
Fig. 6The displacement responses at mid-span
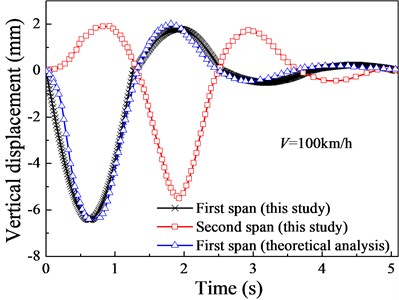
The displacement responses at mid-span are shown in Fig. 6, and the results calculated by traditional theoretical-analytical method are also plotted in Fig. 6. As illustrated in Fig. 6, when the vehicle is in the middle of first span, this position certainly obtains the maximum displacement. Meanwhile, there are also extreme displacement values in the middle position of other spans, and the farther they are from the vehicle, the smaller the extreme displacement values. This is consistent with the principle of influence line. Besides, the dynamic responses predicted in the present work agree well with the theoretical-analytical method results, which can validate the reliability of the vehicle-bridge coupling model.
According to symmetry, the dynamic responses between the first span and forth span, the second span and third span are basically the same, therefore, the first span and second span are chosen for the following analysis. The impact coefficient is defined as follows:
where , are respectively the peak dynamic response and peak static response. They can be displacement, strain, moment or shear force et al. In this section, the vertical displacement is adopted to analyze the influence of parameters on the impact coefficient.
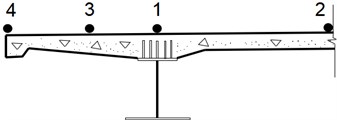
In order to compute global and local impact coefficients of composite beams, 4 points at mid-span cross section are adopted for the analysis as shown in Fig. 7, where point 1 is for global impact coefficient and point 2 to point 4 are for local impact coefficients.
Fig. 7The calculation points
3.1.1. The effect of the number of lanes
The previous findings demonstrate that the numbers of lanes have effect on the dynamic response of bridge. Fig. 8 shows the impact coefficients of single lane and double lanes at the speed of 100 km/s.
Fig. 8The effects of the lane on the impact coefficients
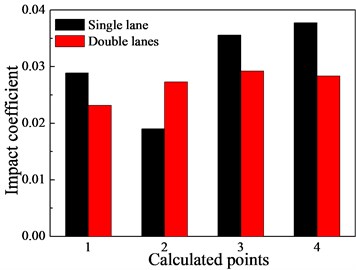
a) First span
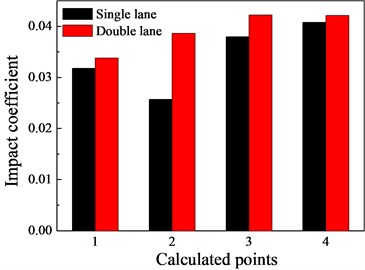
a) Second span
As illustrated in Fig. 8, except for point 2, the global impact coefficient of first span in single lane is greater than that of the double lanes, and it is the same for the local impact coefficient nearby the free end of the cantilever plate. This is mainly attributed the fact that compared with single lane, the lateral load distributions of the bridge deck have changed significantly in double lanes. Whilst for the second span, the global and local impact coefficients of single lane are smaller than that of double lanes. This indicates that the numbers of lanes have certain influence on the impact coefficient. Besides, it can be also found that the local impact coefficient nearby the free end of cantilever slab (point 3 and point 4) is larger than the global impact coefficient (point 2).
3.1.2. The effect of bridge surface flatness
Fig. 9 shows the impact coefficients under different flatness grades. As illustrated in Fig. 9, from A grade to D grade, the flatness of the bridge surface becomes worse and worse and the impact coefficients present nonlinear increment as a whole. For example, from grade A to grade B, the increase of global and local impact coefficients for second span is small, whilst from grade C to grade D, the global impact coefficient increases from 0.152 to 0.558, and the local impact coefficient of point 4 increases from 0.194 to 0.658. This indicates that a worse flatness of bridge surface will lead to larger impact force on the bridge structure, and the safety as well as durability of bridge structures are also affected.
In practical engineering, the maintenance of bridge deck should be regularly carried out to prevent the bad flatness of bridge surface due to the natural ageing materials.
Fig. 9The effects of the bridge surface flatness on the impact coefficients
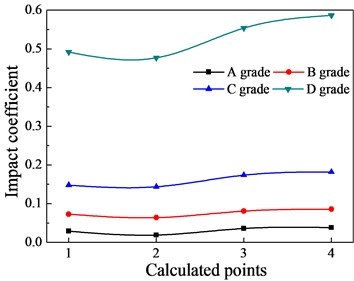
a) The first span
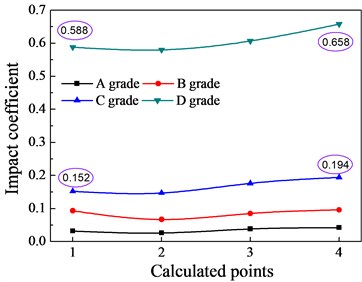
b) The second span
3.2. Curved beam bridge
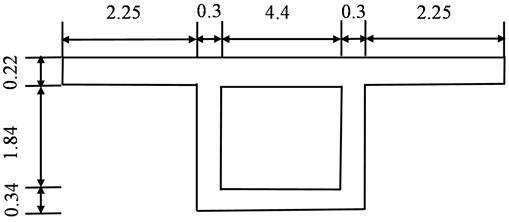
At present, there are few researches on the dynamic response of curved beam bridge under vehicle load. Fig. 10 shows the sectional size of a PC simply supported curved box girder. The longitudinal span is 60 m, the curvature radius 1000 m, the Young’s modulus 3.4×10⁴ MPa, the density 2500 kg/m3.
Fig. 10The sectional size of box girder (unit: m)
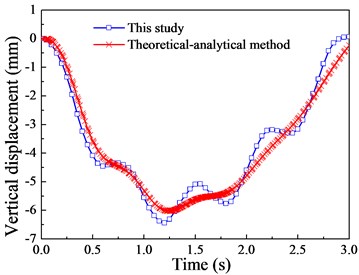
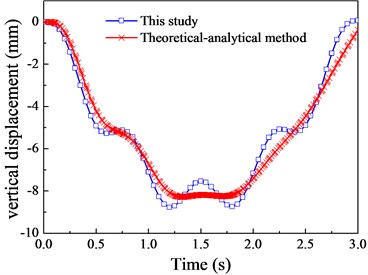
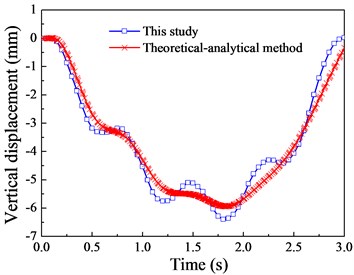
The dynamic responses of the curved box girder are shown in Fig. 11 to Fig. 13. As illustrated in Fig. 11, the numerical results of vertical displacement in this study agree well with the theoretical results.
Fig. 11The vertical displacement response (v= 20 m/s)
a) 1/4 cross section
b) Mid-span cross section
c) 3/4 cross section
Fig. 12The moment response (v= 20 m/s)
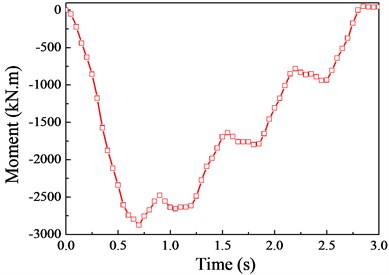
a) 1/4 cross section
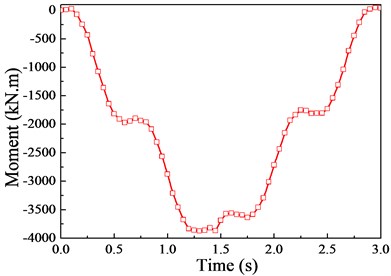
b) Mid-span cross section
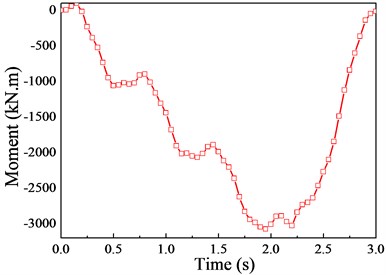
c) 3/4 cross section
Fig. 13The Shear force response (v= 20 m/s)
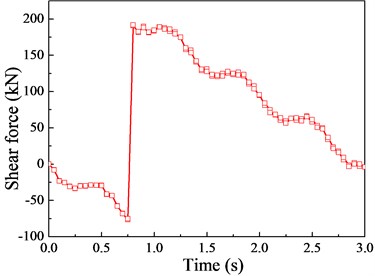
a) 1/4 cross section
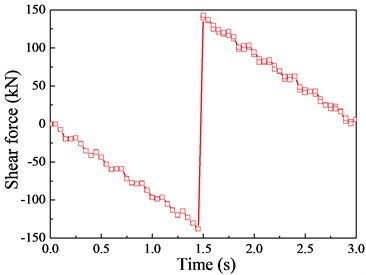
b) Mid-span cross section
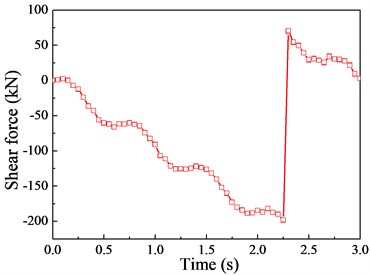
c) 3/4 cross section
Although there are a few deviations in local regions between them, the variation trends are basically the same. This is mainly attributed to the fact that there is no moment of inertia in the theoretical-analytical method (moving load model), leading to the smooth displacement curve. Besides, the responses of displacement and moment reach their peak near the mid-span cross section, therefore, the mid-span cross section will be chosen for the following analysis according to the preliminary calculation and comparison of the impact coefficients.
The displacement and strain impact coefficient are used to replace moment and shear force impact coefficients in the previous researches [14, 17, 22, 23], which can’t really reflect the mechanic behavior of the primary beam under dynamic vehicle loads. As a matter of fact, the impact coefficient is essentially a parameter that reflects the amplification of the primary beam internal force (moment, shear force) as shown in Eq. (13). Besides, there is also a classification of moment and shear force impact coefficient in CEN Euro code [28]. Herein, the vertical displacement, moment and shear force impact coefficients are respectively calculated and compared in the following analysis, and the influences of the vehicle speed, vehicle weight and the stiffness of primary beam are considered.
3.2.1. The effect of vehicle speed
Fig. 14 shows the impact coefficients under different vehicle speeds (20 km/h-120 km/h). As illustrated in Fig. 14, the variation trend of moment impact coefficient is the same as that of the displacement impact coefficient. When the vehicle speed reaches at 60 km/h and 100 km/h, the moment impact coefficient and the displacement impact coefficient both reach extreme values, and the external excitation frequency (1.744 Hz and 1.45 Hz) and the vertical bending frequency of the bridge (1.544 Hz) are very close at this time. This indicates that the vehicle-bridge coupling system can resonate at both low and high speeds, leading to large dynamic response. Besides, since the moment impact coefficient curve is enveloped by that of the displacement impact coefficient, replacing the moment impact coefficient with displacement impact coefficient will overestimate the moment design value. The moment design value is maximally overestimated by 2.89 % as the vehicle speed reaches 100 km/h.
It can also be found from Fig. 14 that the shear force impact coefficient under different vehicle speeds varies between 0.036 and 0.468, the fluctuation range is relatively great. The variation trend of shear force impact coefficients at left side and right side are completely opposite due to the action of vehicle loads. Since the displacement impact coefficient curve is enveloped by that of the shear force impact coefficient, replacing the shear force impact coefficient with displacement impact coefficient will underestimate shear force design value. The shear force is maximally underestimated by 34.9 % as the vehicle speed reaches120 km/h, which is insecure for bridge structures.
Fig. 14The effects of the vehicle speeds on the impact coefficients
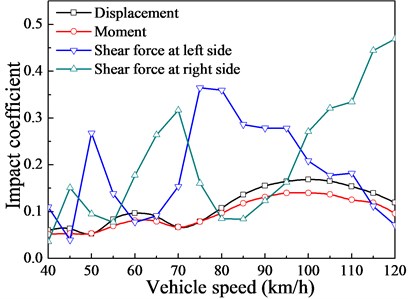
The impact coefficient calculating formulas in the General Specification for Design of Highway Bridges and Culverts (JTG D60-2015)[29]are shown as following equations:
where is the fundamental vibration frequency of the simply supported beam bridge. The impact coefficient of the box girder bridge calculated by Eq. (14) is 0.061 (1.544 Hz), which is significantly smaller than the result in this study. The difference between them is great, especially for the shear force impact coefficient. This indicates that it’s not reasonable to only define the impact coefficient as the function of fundamental vibration frequency of the bridge structure, and the influence of vehicle speed should be also considered.
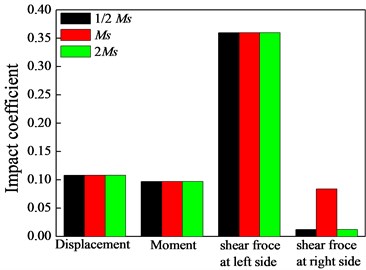
3.2.2. The effect of vehicle weight
The impact coefficient under different vehicle weights is shown in Fig. 15. As illustrated in Fig. 15, except for the differences of shear force impact coefficient at right side, the other impact coefficients under different vehicle weights are almost the same, which indicates that the vehicle weights have little influence on the impact coefficient. Herein, the numbers of axle remain unchanged in the vehicle model, and only the load weight varies. It is worth noting that Han [15] and Deng [17] concluded that the impact coefficient is decreased with an increment in vehicle weights when studying the influence of vehicle types on impact coefficient. As a matter of fact, it is the numbers of the axle that affect the impact coefficient. Generally, the more axles, the heavier is the vehicle, and the smaller is the impact coefficient. This is consistent with the previous research [22].
Fig. 15Dynamic impact coefficient under different vehicle weights
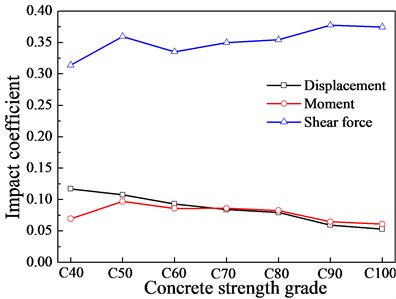
3.2.3. The effect of primary beam stiffness
Deng [14] studied the influence of cross section types of primary beams on the impact coefficient, whilst the influence mechanism of impact coefficient was unrevealed. As a matter of fact, different cross section types will contribute to different inertia moments () and the primary beam stiffness () was thus affected. In order to study the influence of the primary beam stiffness on the impact coefficient, the stiffness of the primary beam varies by changing the elastic modulus of concrete in the present work. The different strength grades of concrete (C40, C50, C60, C70, C80, C90 and C100) are setup in the present work, the detailed values of elastic modulus are referred in GB50010-2015 [30]. Fig. 16 shows the impact coefficient under different primary beam stiffness. As illustrated in Fig. 16, as a whole, the displacement and moment impact coefficient are decreased with an increment in primary beam stiffness (elastic modulus increases), they are only 0.053 and 0.061 respectively when the concrete grade is C100. However, the shear force impact coefficient is generally increased with an increment in primary beam stiffness, it reaches 0.337 when the concrete grade is C100.
Similarly, replacing the moment and shear force impact coefficients with displacement impact coefficient will have little influence on the moment design value but make shear force design value conservative.
Fig. 16Impact coefficient under different stiffness
4. Conclusions
A vehicle-bridge coupling model is proposed to calculate impact coefficient of a straight-line -shaped composite beam and a curved box girder beam. Based on the results and discussions presented in this paper, the conclusions can be drawn as follows:
1) The vehicle-bridge coupling system can resonate at both low speeds and high speeds. The vehicle weights have little influence on impact coefficient; the numbers of lane have a certain influence on the impact coefficient; the impact coefficient is decreased with an increase of the primary beam stiffness. A worse flatness of bridge surface can lead to larger impact force.
2) Along transverse direction, the maximum local impact coefficient is appeared at the free end of cantilever slab; along longitudinal direction, the impact coefficient is related to the distribution of primary beam stiffness.
3) Replacing the moment and shear force impact coefficients with displacement impact coefficient will make moment design value larger and shear force design value conservative.
References
-
Li GuoHao Bridge Structure Stability and Vibration. China Railway Public House, Beijing, 2003 (in Chinese).
-
Xia He Vehicle and Structure Dynamic Interaction. Science Press, Beijing, 2002 (in Chinese).
-
Ju S. H., Lin H. T. A finite element model of vehicle-bridge interaction considering braking and acceleration. Journal of Sound Vibration, Vol. 303, Issues 1-2, 2007, p. 46-57.
-
Gupta R. K., Trail Nash R.-W. Bridge dynamic loading due to road surface irregularities and braking of vehicle. Earthquake Engineering and Structural Dynamics, Vol. 8, Issue 1, 1980, p. 83-96.
-
Law S. S., Zhu X. Q. Bridge dynamic responses due to road surface roughness and braking of vehicle. Journal of Sound Vibration, Vol. 282, Issue 5, 2005, p. 805-830.
-
Sivaselvan M. V., Tauberer J., Karakaplan A. Dynamic vehicle-track-structure interaction analysis using Lagrange multipliers. Proceedings of the Istanbul Bridge Conference, 2014, Istanbul, Turkey.
-
Bucinskas P., Andersen L. V. Dynamic response of vehicle-bridge-soil system using lumped-parameter models for structure-soil interaction. Computers and Structures, Vol. 238, 2020, p. 106270.
-
Azimi H., Galal K., Pekau O. A. A numerical element for vehicle-bridge interaction analysis of vehicles experiencing sudden deceleration. Engineering Structures, Vol. 49, 2013, p. 792-805.
-
Neves S. G. M., Azevedo A. F. M., Calcada R. A direct method for analyzing the vertical vehicle-structure interaction. Engineering Structures, Vol. 34, 2012, p. 414-420.
-
Sun Z., Zou Z. Towards an efficient method of predicting vehicle-induced response of bridge. Engineering Computations, Vol. 33, Issue 7, 2016, p. 2067-2089.
-
Zhang N., Xia H. Dynamic analysis of coupled vehicle-bridge system based on inter-system iteration method. Computers and Structures, Vol. 114, Issue 115, 2013, p. 26-34.
-
Greco F., Lonetti P. Numerical formulation based on moving mesh method for vehicle-bridge interaction. Advances in Engineering Software, Vol. 121, 2018, p. 75-83.
-
Camara A. A fast mode superposition algorithm and its application to the analysis of bridges under moving loads. Advances in Engineering Software, Vol. 151, 2021, p. 102934.
-
Deng L., He W., Wang F. Dynamic impact factors for simply supported bridges with different cross-section types. Journal of Vibration and Shock, Vol. 34, Issue 14, 2015, p. 70-75, (in Chinese).
-
Han W. S., Yan J. Y., Wu J. Analysis of bridge dynamic amplification factors under extra-heavy truck scenarios based on long-term monitoring data. Journal of Vibration Engineering, Vol. 27, Issue 2, 2014, p. 222-232, (in Chinese).
-
Yin X. F., Wang L., Kong B., Song G., Liu Y. Probability analysis of the vibration of bridges with rough surface under stochastic traffic. International Journal of Structural Stability and Dynamics, Vol. 18, Issue 2, 2018, p. 1850108.
-
Deng L., Duan L. L., He W. Study on vehicle model for vehicle-bridge coupling vibration of highway bridge in China. China Journal of Highway and Transport, Vol. 31, Issue 7, 2018, p. 92-100, (in Chinese).
-
Deng L., He W., Yu Y. Research progress in theory and application of highway vehicle-bridge coupling vibration. China Journal of Highway and Transport, Vol. 31, Issue 7, 2018, p. 38-54, (in Chinese).
-
Harris N. K., Obrien E. J., González A. Reduction of bridge dynamic amplification through adjustment of vehicle suspension damping. Journal of Sound and Vibration, Vol. 302, Issue 3, 2007, p. 471-485.
-
Majka M., Hartnett M. Effects of speed, load and damping on the dynamic response of railway bridges and vehicles. Computers and Structures, Vol. 86, Issue 6, 2008, p. 556-572.
-
Yin X. F., Liu Y., Chen S. R. Assessment of ride safety based on the wind-traffic-pavement-bridge coupled vibration. Wind and Structures, Vol. 24, Issue 3, 2017, p. 287-306.
-
Ji W., Deng L., He W. Local and global impact factors analysis for PC box girder bridges with corrugated steel webs. Journal of Vibration and Shock, Vol. 36, Issue 8, 2017, p. 22-28, (in Chinese).
-
Ji W., Deng L., He W. Calculation and analysis of impact factors of highway simply supported PC box girder bridges with corrugated steel webs. Bridge Construction, Vol. 46, Issue 3, 2016, p. 35-29, (in Chinese).
-
Mohammed O., Gonzalez A., Cantero D. Dynamic impact of heavy long vehicles with equally spaced axles on short-span highway bridges. Baltic Journal of Road and Bridge Engineering, Vol. 13, Issue 1, 2018, p. 1-13.
-
Shin S., Yoo K., Kim J. Numerical study on the dynamic amplification factor of cable-stayed bridges due to cable failure. Computers and Concrete, Vol. 18, Issue 5, 2016, p. 613-641.
-
Huang D. Z. Vehicle induced vibration of steel deck arch bridges and analytical methodology. Journal of Bridge of Engineering, Vol. 17, Issue 2, 2011, p. 241-248.
-
Bowe C. J., Mullarkey T. P. Wheel-rail contract elements in incorporating irregularities. Advances in Engineering Software, Vol. 36, Issue 11, 2005, p. 827-837.
-
CEN 1991, Eurocode 1: Action on Structures-Part 2: Traffic loads on bridges. Brussels, 2003.
-
JTGD60-2015. General Specifications for Design of Highway Bridges and Culverts. China Communication Press, Beijing, 2015, (in Chinese).
-
GB50010-2010. Code for Design of Concrete Structures. China Architecture and Building Press, Beijing, 2015, (in Chinese).
Cited by
About this article

The present work is supported by the National Natural Science Foundation of China (51478397), we would like to express our gratitude to it.
