Abstract
Among the running faults of railway freight cars, wheelset faults still occupy a very large proportion in all operation faults. These faults seriously affect and threaten the operation safety of railway freight cars. Focusing on the data of the operating mileage of C80 wheelset, application of the two-parameter Birnbaunm-Saunders (BS) fatigue life distribution and the Weibull distribution are introduced and reviewed for analyzing the data of three high-risk wheelset faults, namely the wheel diameter difference, the circumferential wear of the tread and the location depression of tread. The analysis results show that the application of BS fatigue life distribution in the prediction of wheelset reliability is feasible.
1. Introduction
As for the railway freight car, the operational safety is commonly affected by the reliability of the wheelset. Unfortunately, the failure of wheelset frequently occurred during the train in service, such as wheel diameter difference, the circumferential wear of the tread, and the location depression of tread [1]. According to the standard ‘Railway freight car axle assembly, maintenance and management rules’ (TG/CL 224-2016) [2], there are high standards for the maintenance and repair procedures of wheelset in the part 4.7, especially for the high-speed and heavy-haul railway freight car.
To investigate the wearing mechanism of wheelset, different methodologies have been studied to predict the wear of railway wheelset in recent years, especially in the rolling contact fatigue [3-5]. But the predicted result is not accuracy due to the less and dispersibility experimental date, as wheelset damage is a time-consuming test. Since the failure of wheelset is a random process, therefore, the mathematical statistic methodologies have been conducted to predict the wearing life of wheelset in many works, such as the statistical distribution [6], the Fastsim algorithm [7] and the time-to-failure distribution [8]. Lin and Asplund [9] also used more complex Weibull frailty model to model the data for a sample of locomotive wheels. Besides, literature [10, 11] point out that Birnbaum-Saunders (BS) fatigue life distribution has more advantages in processing failure data based on fatigue mechanism. In addition, there are few studies about the rule of failure from the relationship between the frequency of wheelset depot-repair and its operating mileage.
In this paper, the wheelset of C80 is the research object. The contribution of this work is to analyze the depot-repair data of wheelset by comparing the Weibull distribution and BS distribution, which applies the BS distribution to the field of wheelset failures while simultaneously considering the relationship between wheel damage and operating mileage. The characteristic curves of the wheelset with serious faults are obtained.
2. Experiment and statistics model
2.1. Statistical analysis of data
This paper selects the wheelset of C80 heavy-haul freight car owned by one railway company as a case study, which contained the unit running miles (cumulative mileage).As can be seen from the statistical Table 1 of C80 train wheelset maintenance, among the 15354 inspected wheelsets, there are 5346 wheel diameter difference exceeded, 4896 tread wear exceeded, 4292 local tread depression, and rim thickness over limit 228, with 586 tread stripping. Apparently, there are generally multiple kinds of faults co-existing in the depot repair, the main fault types of the railway freight car wheelset repair in this operating unit are wheel diameter difference exceeded (34.82 %), excessive wear of tread circumference (31.89 %), and local depression of tread (27.95 %). The three types account for about 94.66 % of the total depot record. The flange thickness over limit (1.48 %) and tread stripping (3.82 %) account for relatively smaller.
Table 1Statistical table of C80 wheelset maintenance
Fault type | Number of failures | Frequency of failure (%) |
Wheel diameter difference exceeded | 5346 | 34.82 |
Excessive wear of tread circumference | 4896 | 31.89 |
Local depression of tread | 4292 | 27.95 |
Flange thickness over limit | 228 | 1.48 |
Tread stripping | 586 | 3.82 |
According to the depot-repair data of C80 wheelset, the data after the mileage of 700,000 kilometers were selected for statistical analysis of small specimens. The number of specimens of the wheel diameter difference exceeded was 128. The excessive wear of tread circumference and the local depression of tread were selected 27 and 93 respectively for reliability analysis.
2.2. Mathematical model
The Weibull distribution, as well as its modified form, can describe various shapes for the failure rate functions and is widely used in modeling lifetime in reliability engineering [12]. The cumulative distribution function (CDF) of the two-parameter Weibull distribution can be expressed as:
where: 0 is the shape parameter; 0 is the scale parameter or characteristic life. Accordingly, its probability density function is:
The corresponding reliability function is:
The Birnbaunm-Saunders fatigue life distribution was first proposed by Birnbaum and Sauders in 1969 [13]. Since the BS distribution is introduced from the basic characteristics of the fatigue process, it has been widely used in mechanical product reliability studies. Suppose that obeys the two-parameter Birnbaum-Saunders fatigue life distribution BS , and its distribution function and probability density function are as follows [14]:
where: 0 is called the shape parameter; 0 is called the scale parameter:
3. Results and discussion
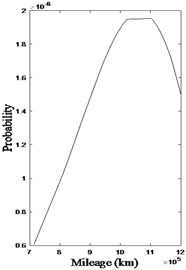
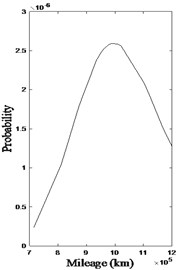
The specific reliability analysis is made on the repair data of wheel diameter difference exceeded. Fig. 1 is the probability density diagrams of Weibull (WBL) model and BS model of wheelset diameter difference depot-repair data. Fig. 1(a) and Fig. 1(b) show that the probability density functions of both models present a continuous upward trend, reaching the highest point at about 1 million kilometers, which also verifies the relationship between the operating mileage and the reliable operation of the wheelset. With the increase of train running mileage, the vehicle safety index gradually becomes worse, the wheelset reliability gradually declines. After the train reaches a certain mileage, the probability of vehicle failure rapidly increases. The two fault types of the tread are related to the wheel diameter difference, and the results of data processing are similar.
Fig. 1Wheel diameter difference exceeded PDF
a) WBL
b) BS
Fig. 2Reliability function curve of wheel diameter difference
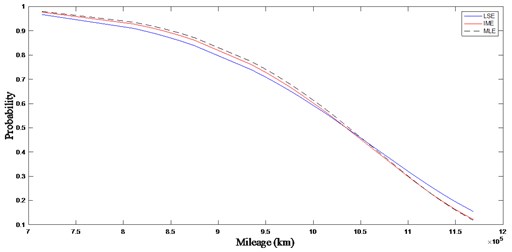
In this research, the least square estimation (LSE), inverse moment estimation (IME) and maximum likelihood estimation (MLE) are used to solve the Weibull model parameters of wheel diameter difference overrun fault data, and the curves of the three reliability curves obtained are shown in Fig. 2.
According to Eqs. (1-5), combined with the data processing method in the paper [15] and the curve comparison results in Fig. 2, the maximum likelihood method is adopted to identify the parameters of Weibull model and BS model. The results are shown in Table 2.
Table 2Parameter estimation results
Weibull parameter estimation | BS parameter estimation | ||||
Fault type | Shape parameter () | Scale parameter () | Fault type | Shape parameter () | Scale parameter () |
Wheel diameter difference exceeded | 5.859 | 109.852 | Wheel diameter difference exceeded | 0.144 | 100.918 |
Tread circumference wear limit | 6.662 | 104.383 | Tread circumference wear limit | 0.157 | 98.546 |
Local depression on tread | 4.730 | 115.971 | Local depression on tread | 0.127 | 105.427 |
Fig. 3Reliability characteristics of wheelset
a)
b)
c)
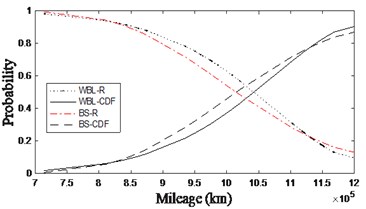
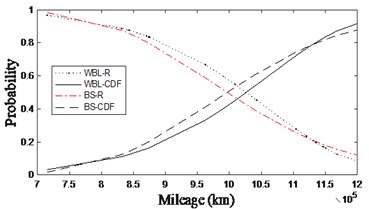
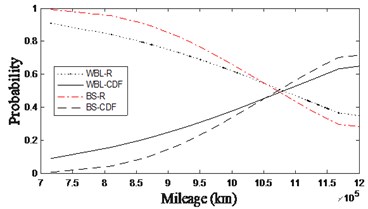
In Fig. 3, the three figures a), b) and c) are the reliability characteristic diagrams of wheel diameter difference exceeding limit, tread circumference wear exceeding limit and local depression of tread, the marked lines in the figure are the reliability characteristic curves fitted by Weibull model and BS model respectively.
In addition, it can be seen from Fig. 3(a, b) that the reliability curves of the two types of faults, namely, the wheel diameter difference exceeding the limit and tread circumference wear exceeding limit, have similar trend. It can be seen that the two faults are closely related, and the wear of two wheels of the same wheelset is not the same, which will lead to an increase in the frequency of the wheel diameter difference exceeded. Compared to the reliability curve obtained by the Weibull model, the reliability curve obtained by the BS model gives a relatively conservative wheelset maintenance mileage. Therefore, the minimum scale parameter (98.546) of the BS model is selected as the minimum maintenance mileage limit.
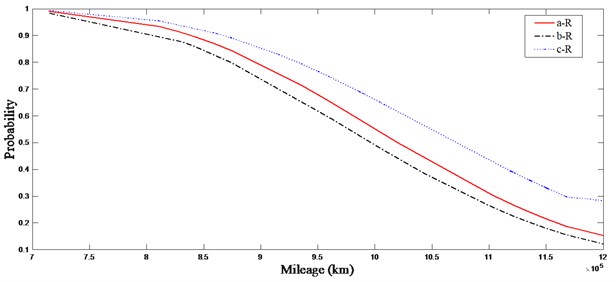
In Fig. 4, the marked lines a, b and c are respectively the reliability curves of wheel diameter difference exceeded, excessive wear of tread circumference and the location depression of tread, which fitted by BS model. It can be seen from the figure that the three types of reliability curves have the same downward trend, but the rate of decline is different. The curve of tread circumferential wear drops the fastest, indicating that the C80 wheelset in operation has a serious failure rate of the wheelset tread circumferential wear. According to the BS model characteristic parameters of the tread wear data obtained in Table 2, it is necessary to ensure that the wheelsets are fully overhauled before the train runs to 98.546 million kilometer.
Fig. 4Reliability function curves of wheelset
4. Conclusions
Through the sampling statistical analysis of a large number of railway freight car wheelset repair data, the characteristic values and reliability curves of the C80 wheelset is given by comparing the application of Weibull distribution and Birnbaunm-Saunders distribution on the wheelset maintenance data in this paper. The reliability curves of wheel tread circumferential wear and wheel diameter difference decrease rapidly. The results show that the BS distribution presents the applicable capability and effectiveness for analyzing the depot-repair data of wheelset. In addition, it is necessary to ensure that the wheelsets of C80are fully overhauled before the train runs to 98.546 million kilometers.
References
-
Lyu K., Liu et al. P. Analysis on the features and potential causes of wheel surface damage for heavy-haul locomotives. Engineering Failure Analysis, Vol. 109, 2019, p. 104292.
-
TG/CL 224-2016, Railway Freight Car Axle Assembly, Maintenance and Management Rules. China Railway Publishing House, 2016.
-
Fa Xiong Analysis and research on the wear law of wheelsets used in C80B gondola cars on Daqin line. Internal Combustion Engine and Parts, Vol. 44, Issue 5, 2020, p. 44-46.
-
Six K., Mihalj T., Trummer G., et al. Assessment of running gear performance in relation to rolling contact fatigue of wheels and rails based on stochastic simulations. Journal of Rail and Rapid Transit, Vol. 234, Issue 4, 2019, p. 405-416.
-
Wang Ling, Xu Hong, Zhao Wenjie, et al. Optimizing the re-profiling strategy of metro wheels based on a data-driven wear model. European Journal of Operational Research, Vol. 243, Issue 3, 2015, p. 975-986.
-
Zou R., Ma W., Luo S. Influence of the wheel diameter difference on the wheel/rail dynamic contact relationship of the heavy haul locomotive. Australian Journal of Mechanical Engineering, Vol. 16, Issue 2, 2018, p. 98-108.
-
Andrade A. R., Stow J. Statistical modelling of wear and damage trajectories of railway wheelsets. Quality and Reliability Engineering International, Vol. 32, Issue 8, 2016, p. 2909-2023.
-
Tao Guo, Qi Yayun, Gan Feng Simulation and analysis of wheel wear prediction with rigid flexible couple wheelset. Earth and Environmental Science, Vol. 189, 2018, p. 032012.
-
Freitas M. A., Toledo M. L. G., Colosimo E. A. Using degradation data to assess reliability: a case study on train wheel degradation. Quality and Reliability Engineering International, Vol. 25, Issue 5, 2009, p. 607-629.
-
Lin J., Asplund M., Parida A. Reliability analysis for degradation of locomotive wheels using parametric Bayesian approach. Quality and Reliability Engineering International, Vol. 30, Issue 5, 2013, p. 657-667.
-
Bingxing W., Lingling W. Estimation for the Birnbaum-Saunders fatigue life distribution. Chinese Journal of Applied Probability and Statistics, Vol. 12, Issue 4, 1996, p. 10-15.
-
Tibor Tallian Weibull distribution of rolling contact fatigue life and deviations there from. ASLE Transactions, Vol. 5, Issue 5, 1962, p. 183-196.
-
Kasra Mohammadi, Omid Alavi, Jon Mcgwan G. Use of Birnbaum-Saunders distribution for estimating wind speed and wind power probability distributions: a review. Energy Conversion and Management, Vol. 143, 2017, p. 109-122.
-
Sanhueza Antonio, Leiva Victor, Balakrishnan N. The generalized Birnbaum-Saunders distribution and its theory, methodology, and application. Communications in Statistics-Theory and Methods, Vol. 37, Issue 5, 2008, p. 645-670.
-
Sun Zhuling Regression estimation of the parameters of the Birnbaum-Saunders fatigue life distribution. Acta Armamentarii, Vol. 31, Issue 9, 2010, p. 1259-1262.
