Abstract
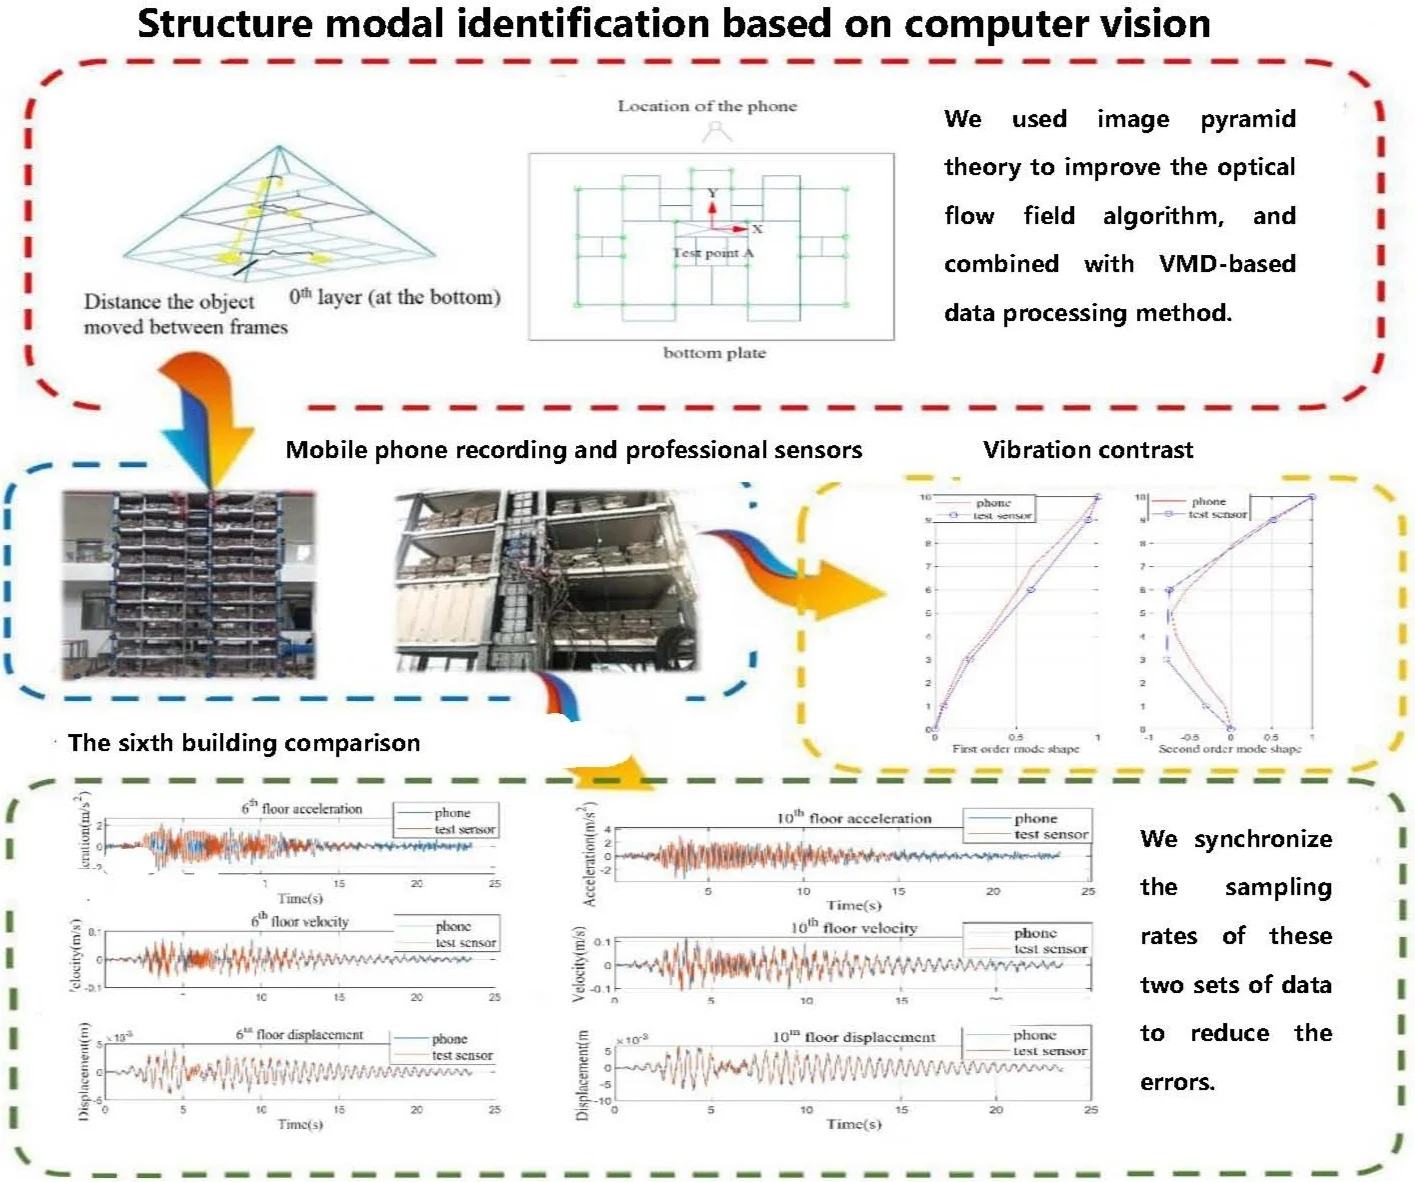
Mobile phones have the potential to become useful tool in structural modal identification. In this paper, shaking table test videos of a 10-story steel structure captured by mobile phone is processed using computer vision theory and then the modal parameters are identified. A signal processing method based on variational mode decomposition (VMD) is used to improve the accuracy of identification. Using optical flow algorithm, the vibration data is extracted from the video, and then the response of the structure is obtained from the vibration data of selected feature points. Then, the vibration data is processed by VMD and structural modal parameters (mode frequency and mode shapes) are identified using FFD. Finally, the identification results obtained from mobile phone and professional sensors are compared to verify feasibility and accuracy of the proposed modal identification method.
Highlights
- Mobile phones have the potential to become useful tool in structural modal identification.
- Shaking table test videos of a 10-story steel structure captured by mobile phone is processed using computer vision theory and then the modal parameters are identified.
- A signal processing method based on variational mode decomposition (VMD) is used to improve the accuracy of identification.
- Using optical flow algorithm, the vibration data is extracted from the video, and then the response of the structure is obtained from the vibration data of selected feature points.
- The vibration data is processed by VMD and structural modal parameters (mode frequency and mode shapes) are identified using FFD.
- The identification results obtained from mobile phone and professional sensors are compared to verify feasibility and accuracy of the proposed modal identification method.
1. Introduction
Structural modal identification is not only an important means to evaluate structural performance and safety but also a basic method for structural damage detection and health monitoring. Structural system identification needs to obtain structural response, such as displacement, acceleration, and strain. Traditional wired sensors can capture structural behavior accurately, but the mass and stiffness of the system may be affected, which will cause error. Because of the high cost and complex arrangements of the measuring points, non-contact structural vibration measurement based on computer vision methods has gradually become a research focus in recent years. The vibration measurement based on computer vision theory show great potential, and the non-contact sensor for modal identification is feasible [1]. At present, most of the dynamic detections based on vision uses high speed and high-resolution cameras [2, 3] as testing tools, which can obtain more response signal. However, such cameras are non-portable and expensive. Smartphones are equipped with image sensors and portable, which has the potential to replace professional cameras. With the development of imaging system, modal identification based on mobile camera has begun to take shape [4-6]. But related technologies are still under research, and further development in this field is needed. In this paper, a method using optical flow algorithm and VMD is proposed for structural modal identification. The feasibility and accuracy of the method is verified by adopting it to the shaking table test of a 10-story steel structure.
2. Methodology
2.1. Location of the camera and reference points
The flowchart of the method in this paper is shown in Fig. 1. The video of shaking table experiment was recorded by a mobile phone which was stabilized by a tripod. At the test point A (shown in Fig. 2) on the 1st, 3rd, 6th, 9th, and 10th floors of the structure, three professional sensors are placed for each floor which are respectively used to record two horizontal and one vertical acceleration response of the structure and the mobile phone is perpendicular to the ground and the structure (shown in Fig. 2). The width of the bottom plate is measured to establish the reference point between the image coordinate system and the real coordinate system.
Fig. 1Flowchart of the method

2.2. Vibration data extraction based on computer vision technology
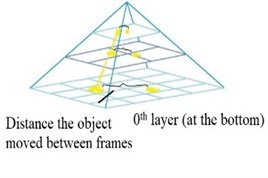
The video of structure vibration is processed by using the optical flow algorithm to extract the velocity response of the structure. Firstly, the feature points for tracking need to be selected in the vibration video. Therefore, the regions of interest (ROI) are manually selected in the first video frame, which is a circle with a radius of 5 pixels and the center of the circle (shown with the reference points in Fig. 3) [7]. Then, the optical flow method is used to calculate the velocity of the feature points. The algorithm assumes that the gray levels of feature points in two consecutive frames remain unchanged, which produces an image pyramid during processing (shown in Fig. 4), where the pyramid of 0th layer (at the bottom) is the original image. Every time the pyramid level goes up, pixel per inch (PPI) of the image is reduced by half, so that the corresponding vibration displacement of the same pixel line segment in the upper layer can be compressed to 1/2 of its vibration displacement in the lower layer.
Fig. 2Location of the camera
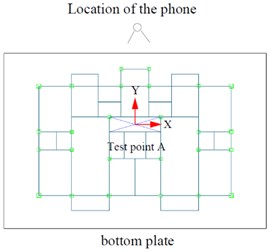
Fig. 3The structure and feature points
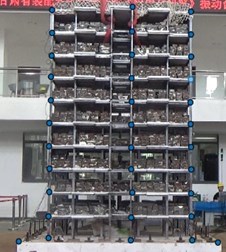
Fig. 4The image pyramid
2.3. Modal identification
Before modal identification, the VMD method is used to process the vibration data which is aiming to reduce the noise cause by the optical flow method and ambient vibration. For each vibration data, VMD is first used to decompose the data into several simple components, then the mode components which have the larger correlation coefficient with the original vibration data are summed up to construct the new vibration data which are used in the subsequent modal identification. The vibration noise which is commonly has the smaller correlation coefficient with the original vibration data is therefore reduced during above VMD process.
After the processed vibration data is obtained, the frequency domain (FFD) method is used for modal identification. FFD is based on the transfer function matrix or spectral matrix of the structure. At a certain frequency, the value of the transfer function matrix or spectral matrix contributes the most by one or several modes, and the modal parameters of the system are determined by singular value decomposition of the response spectral density function matrix. The procedure of the identification consists two steps, i.e., (1) identification of the natural frequency, and (2) identification of the mode shapes. By analyzing the power spectrum of test model structure, the natural frequency can be determined according to the peak frequency point of the power spectrum. The auto and cross power spectrum density of the data can be used to identify the mode shapes of the structure. The singular value decomposition of the power spectral density matrix can be obtained by [8]:
where the matrix is a unitary matrix holding the singular vector and is a diagonal matrix containing positive real singular values arranged from largest to smallest. Near a peak corresponding to the th mode in the spectrum this mode or may be a possible close mode will be dominating. If only the th mode is dominating here, the first singular vector is the estimation of the mode shape:
and the singular value is the power spectral density function of a single degree of freedom system.
In this paper, the average periodogram method is used to estimate the power spectrum density. This method divides the vibration signal data into several segments and calculates the power spectrum of each segment of data separately and then averages them. The calculation of self-power spectral density function and cross-spectral density function is shown as:
where is the Fourier transform of the th data segment of the random vibration acceleration response at a certain test point; is the conjugate complex number of ; is the data length of Fourier transform; is the average number of times [8].
3. Results and discussions
The shaking table test results of a 10-story steel model structure are taken to investigate the efficiency and accuracy of the proposed method. Test results in two cases (case 1 and case 2) with the peak ground acceleration (PGA) of ground motion in direction (shown in Fig. 2) as 0.07 g and 0.19 g respectively are compared and analyzed. For each case, 3-direction (2 horizontal: and directions, 1 vertical: direction) ground motions are input at the bottom plate of the structure with PGA ratio as 1:0.85:0.65, and the structure response in direction are presented.
The time history curves of structure velocity response of the 6th and 10th floors for two cases are shown in Figs. 5 to 8 (the results of the 1st, 3rd and 9th floors are similar; therefore, they are not presented here). For comparison purpose, the corresponding acceleration response and displacement response are also presented by time derivation or time integral. From visual inspection, the structure response extracted from smartphone video are in well agreement with those recorded by professional sensors. Taking the data in Case 1 as an example, the peak velocity of the 6th floor and 10th floor extracted by video is 0.064 m/s and 0.101 m/s respectively, while the peak velocity of the 6th floor and 10th floor from professional sensors is 0.069 m/s and 0.108 m/s respectively. The relative error of data from 6th floor and 10th floor is approximately 7.25 % and 6.48 % respectively.
With the structure response data, the modal parameters are identified using the FDD method mentioned above. In Table 1, the estimate of the natural frequency corresponding to the first two mode are given. The natural frequency estimated from video and those recorded by professional sensors are close to each other, the discrepancy between them is negligible. However, the natural frequency in Case 1 is slightly larger than the counterpart in Case 2 which may indicate that slight damage occurs in Case 2, since the ground motion intensity for Case 2 is corresponding to that of a moderate earthquake according to the design condition of the model structure. Ambient vibration can cause measurement uncertainty. However, the frequency spectrum of ambient vibration changes little with time during the video recording process, and it can be filtered out by VMD, which shows the characteristics and advantages of VMD.
Fig. 56th floor time history curves (Case 1)
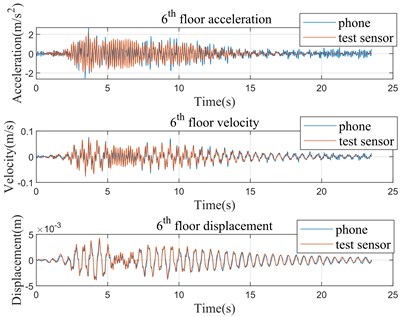
Fig. 610th floor time history curves (Case 1)
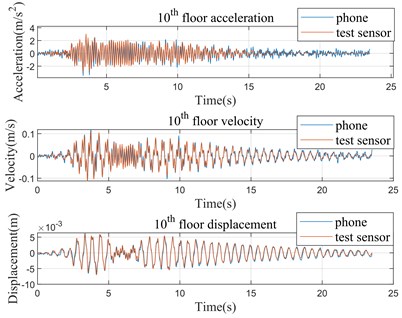
Fig. 76th floor time history curves (Case 2)
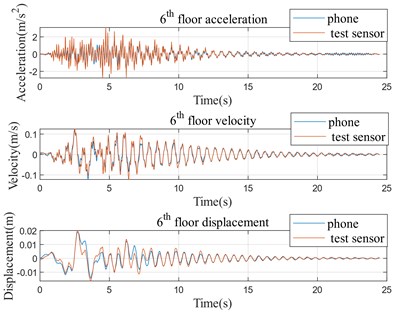
Fig. 810th floor time history curves (Case 2)
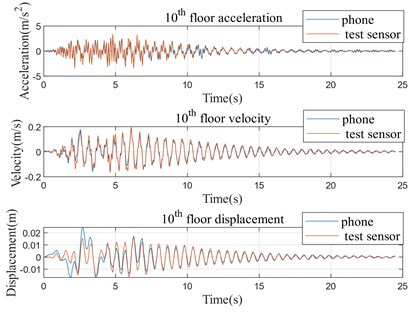
Table 1Identification of natural frequency
1st mode (Case 1 0.07 g) | 2nd mode (Case 1 0.07 g) | 1st mode (Case 2 0.19 g) | 2nd mode (Case 2 0.19 g) | |
Computer vision | 1.8513 Hz | 6.8541 Hz | 1.7007 Hz | 6.5511 Hz |
Professional sensors | 1.8501 Hz | 6.8403 Hz | 1.7009 Hz | 6.5516 Hz |
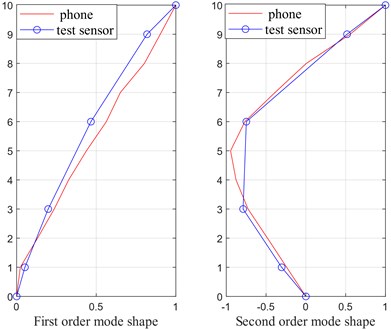
The estimate of mode shapes for the first two modes are presented in Figs. 9 and 10. Like the estimate of natural frequency, the mode shapes estimated using the data from videos and professional sensors are the same to each other. Since the professional sensors were only placed on 5 of the 10 floors of the model structure, the resulting mode shapes are piecewise lines, while the counterpart using data from videos are smooth lines. The more feature points of interest selected, the more accurate and smooth mode shapes can be obtained, which is the potential merit of the proposed method base on computer vision.
Fig. 9Mode shapes of the first two modes (Case 1)
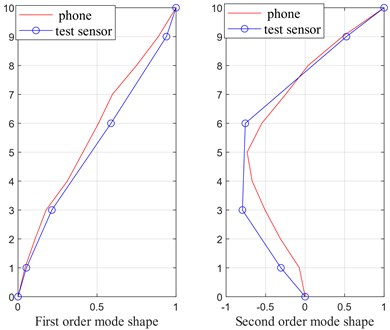
Fig. 10Mode shapes of the first two modes (Case 2)
4. Conclusions
In this paper, videoing the shaking table test by mobile phone camera, a modal identification method based on computer vision and VMD is proposed. According to the comparison the analysis results of the data extracted from smartphone video and the data recorded by professional sensors, the following conclusions are obtained.
1) Vibration data extracted from smartphone video using the computer vision technology can meet the requirements of measurement, which has high accuracy and precision. The structure modal identification based on computer vision is feasible.
2) Processing structure response using VMD can obtain the effective decomposition components of vibration signal and can reduce the noise cause by the algorithm and ambient vibration.
3) Using the optical flow algorithm, the vibration data at any feature point of interest can be obtained, which is the potential merit of the proposed method. The limitation of the number of professional sensors, the conventional test procedure is usually faced, therefore can be avoided.
4) Structural damage detection based on computer vision technology has potential to research.
References
-
Han J., Zhang Y., Zhang H. Displacement measurement of shaking table test structure model based on computer vision. Earthquake Engineering and Engineering Vibration, Vol. 39, Issue 4, 2019, p. 22-29, (in Chinese).
-
Chen J., Wadhwa N., Cha Y., et al. Structural modal identification through high speed camera video: motion magnification. Conference Proceedings of the Society for Experimental Mechanics Series, Vol. 7, 2014, p. 191-197.
-
Xiong W., Cheng Y. Non-contact identification algorithm of bridge vibration and modal based on high frame video analysis, (in Chinese). Journal of Southeast University (natural science edition), Vol. 50, Issue 3, 2020, p. 433-439.
-
Yoon H., Elanwar H., Choi H., Golparvar-fard M., Spencer B. F. Target‐free approach for vision-based structural system identification using consumer‐grade cameras. Structural Control and Health Monitoring, Vol. 23, 2016, p. 1405-1416.
-
Ozer E., Feng D., Feng M. Q. Hybrid motion sensing and experimental modal analysis using collocated smartphone camera and accelerometers, Measurement Science and Technology, Vol. 28, Issue 10, 2017, p. 105903.
-
Chen T., Zhou Z. An improved vision method for robust monitoring of multi-point dynamic displacements with smartphones in an interference environment. Sensors, Vol. 20, Issue 20, 2020, p. 5929.
-
Hosseinzadeh A. Z., Tehrani M. H., Harvey Jr P. S. Modal identification of building structures using vision-based measurements from multiple interior surveillance cameras. Engineering Structures, Vol. 228, 2021, p. 111517.
-
Brincker R., Zhang L., Andersen P. Output-only modal analysis by frequency domain decomposition. Proceedings of ISMA 25, Vol. 25, 2000.
About this article

