Abstract
The substantial increase in the number of motor vehicles in recent years has caused many traffic safety problems and has aroused widespread concern. As the basis of intelligent vehicle environment perception and a necessary condition for realizing the functions of assisted driving system, traffic sign recognition is of great significance for realizing automatic driving of vehicles, improving intelligent transportation systems, and promoting the development of smart cities.This paper mainly identifies traffic signs, using histogram of gradient feature extraction method. The image is collected and preprocessed by a vision sensor. The color threshold segmentation method and morphological processing are used to reduce the interference of the background area and enhance the contour of the sign area. Finally, HOG method is used to collect the gradient of each pixel point in the cell unit or the direction histogram of the edge to identify traffic signs. Through MATALB simulation, it is obtained that the HOG image feature extraction method has high accuracy, small error and short recognition time, which shows the effectiveness of the algorithm.
Highlights
- The HSV model is more intuitive, more widely used, and can better reflect the parameters of hue, saturation and brightness value.
- The morphological processing method adopted is image expansion, which will make the range of the target area larger. The background points that the target area contacts will be merged into the target object, so that the target boundary will expand outwwardly. It can be used to fill some holes in the target area and eliminate the small particle noise contained in the target area.
- HOG feature extraction to the collected images geometry and optical deformation happens in the global scope has good pertinence. The image features can be extracted accurately when the region of interest containing traffic signs is deformed.
1. Introduction
At present, the cause of urban traffic congestion is the significant increase in the number of motor vehicles. In order to effectively improve road traffic safety and reduce accidents, research teams at home and abroad have developed Advanced Driver Assistance System (ADAS). ADAS is composed of multiple subsystems such as lane line departure warning system, pedestrian detection system, and traffic sign detection system. As the core part of the traffic sign detection system, the camera and sensor are used to collect the information of the current traffic scene, and the image processing technology is used to extract the feature of the traffic sign in the road scene, so as to accurately identify the traffic sign category and provide road traffic information for the driver or driverless.
At present, traffic sign detection methods are mainly divided into four categories: traffic sign detection based on color information, shape features, saliency and feature extraction. As early as 2003, Hsiuming et al. used the red information in traffic signs to segment the image through the red pixels, and obtained the candidate regions containing the red pixels [1]. Asakura et al. also proposed a traffic sign detection method based on color information, which quickly extracted the specified color by using a Simple Vector Filter (SVF) and was able to remove irrelevant pixels. However, the disadvantage of this method is that it is greatly affected by light and cannot accurately simulate the perception of human eyes [2]. Zhu Shuangdong et al. proposed an intelligent detection method for the red inverted triangle sign, which used edge detection to judge the vertex position [3]. Zhang Jing et al. proposed a traffic sign segmentation method based on multi-feature fusion for circular traffic signs, and successfully segmented the circular traffic signs with non-color decomposition technology. However, such target detection methods are limited in detecting the types of targets [4]. Liang et al. trained the SVM classifier with polynomial kernel function to improve the brightness of the extracted color, and realized the detection and recognition of traffic signs by combining the improved HOG and SVM [5]. Liang Minjian proposed a high real-time recognition method that integrates HOG and Gabor features, and then selects Softmax as a classifier [6]. Hu Yaling et al. proposed a traffic sign detection algorithm based on multi-scale visual salience by combining Gabor filter and Fourier transform. Although this method can effectively improve the detection rate, its computational complexity is high, which is not conducive to meet the requirements of real-time engineering [7].
Due to the limitations of the information it contains, the interference cannot be removed well when the background is complex or the interference is very similar to the target,whether it is an algorithm based on color and shape analysis or an algorithm based on saliency.In order to better identify traffic signs, this paper uses HOG feature extraction method to divide an image into several small cell units, and then calculates the direction gradient histogram of each cell. According to the statistical theory, statistics are carried out according to the direction. Finally, the histogram of all cells is combined to form a descriptor that can describe the target to be detected. Through this appropriate feature description, traffic signs are more fully expressed, so as to improve the accuracy of traffic sign recognition. The simulation results show that the traffic sign recognition algorithm based on HOG feature extraction has high accuracy, small error and short recognition time, which verifies the effectiveness of the traffic sign recognition algorithm based on HOG feature extraction.
2. Traffic sign detection and recognition
2.1. Types and functions of traffic signs
In view of the regional and cultural differences, the traffic sign standards implemented by various countries in the world are different. At present, the implementation standard of domestic road traffic signs is “Specification for urban road traffic signs and markings GB51038-2019”. According to the standard, China 's traffic signs can be divided into two categories: main signs and auxiliary signs. The main signs can be divided into warning signs, prohibition signs, indication signs, guide signs, tourist area signs, operation area signs and warning signs. Among them, warning signs, prohibition signs and indication signs are the most important and common traffic signs. Warning signs are mainly used to warn vehicle drivers and pedestrians that the road ahead is dangerous. Injunction signs are mainly used to prohibit or limit the traffic behavior of vehicles and pedestrians, and road users should strictly abide by them. Indicator signs are mainly used to indicate the movement of vehicles and pedestrians. There are 131 kinds of warning signs, prohibition signs and indication signs in China, which are composed of 5 main colors (red, yellow, blue, black and white). As shown in Table 1.
Table 1Chinese road traffic signs classification
Category | Feature | Schematic diagram |
Warning sign | equilateral triangle, black side, yellow background, black pattern, vertex facing upwards | 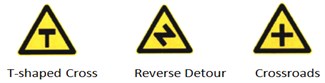 |
Ban sign | equilateral triangle, circle, red circle, white background, black pattern, top foot down |  |
Indication sign | rectangular, circular, blue background, white pattern | 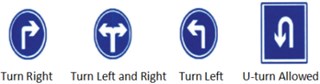 |
2.2. Traffic sign detection
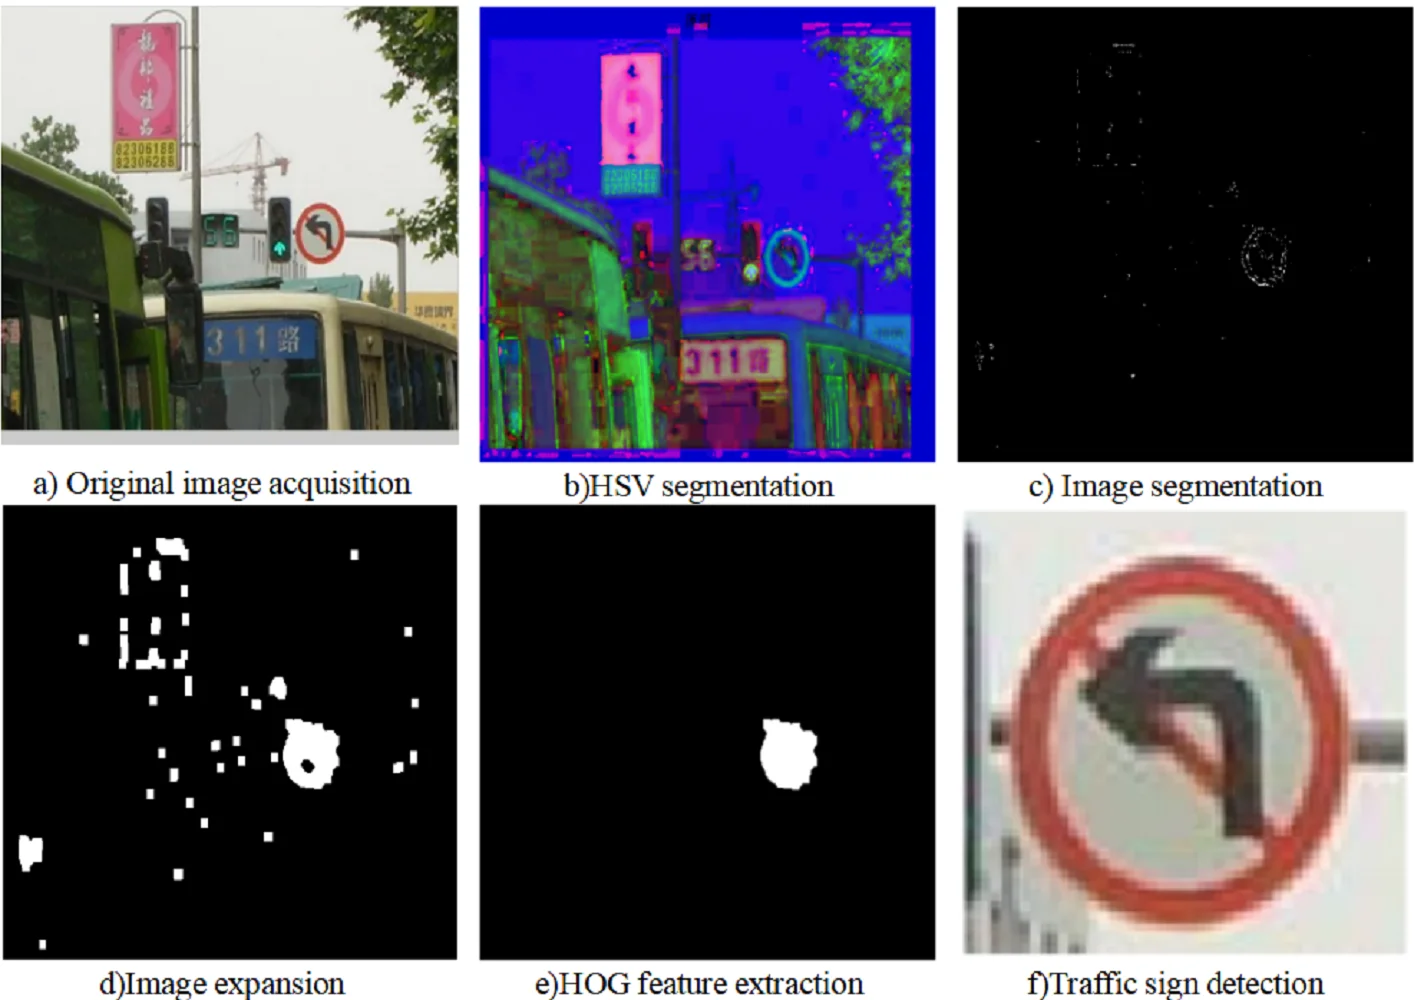
The flow of traffic sign detection using vision sensor is mainly “Original Image Collection –Image Preprocessing – Image Segmentation Detection – Image Feature Extraction – Traffic Sign Detection”. This is shown in Fig. 1.
Fig. 1Traffic sign detection process
a) Original image acquisition
b) Image preprocessing
c) Image segmentation
d) Image feature extraction
e) Traffic sign detection
2.2.1. Original image acquisition
At present, the types of environment sensing sensors of intelligent connected vehicle (ICV) mainly include vision sensors and radar sensors. Radar sensors include ultrasonic radar, millimeter-thin radar and laser radar. Radar sensors are generally used for parking, forward hedging and side backward hedging, while visual sensors are mostly used for feature perception and traffic detection, which are more suitable for original image acquisition.
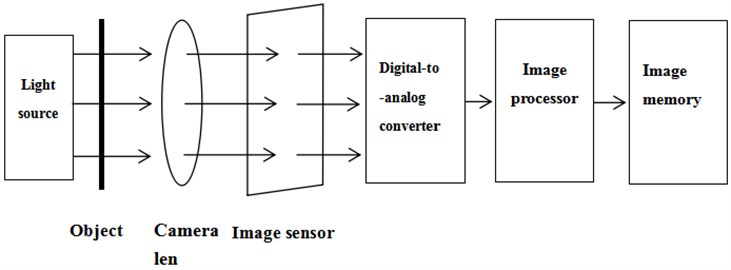
Visual sensor refers to the sensor that detects the target and outputs data and judgment results through image processing of the image captured by the camera. The vision sensor is mainly composed of a light source, a camera len, an image sensor, a digital-to-analog converter, an image processor, and an image memory, as shown in Fig. 2. Its main function is to obtain enough original images to be processed by the machine vision system.
Fig. 2Composition of a vision sensor
2.2.2. Image preprocessing
It is the first step in the process of traffic sign detection to quickly and correctly segment the region of interest of traffic sign from the image to be detected. The images to be detected collected by the equipment are adversely affected by various external conditions. In order to obtain detection results that are more conducive to subsequent processing, it is necessary to carry out other processing processes on the images to improve the image quality. Therefore, a reasonable and effective preprocessing method is an important prerequisite for traffic sign detection.
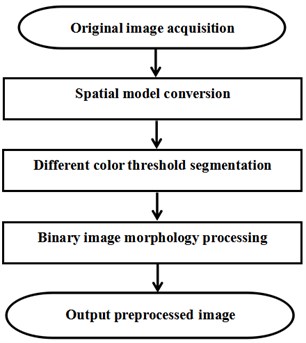
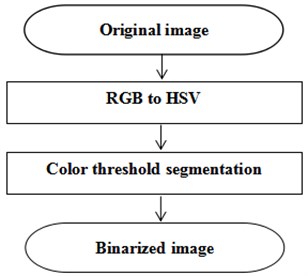
The image preprocessing process is shown in Fig. 3.
Fig. 3Image preprocessing process
2.2.3. Color space model
Traffic signs have significant color features, which are easy to distinguish from the background and easy for pedestrians to observe. Besides, the color features have strong anti-interference ability to deformation, translation, rotation, etc. Therefore, the color segmentation method is usually used to detect traffic signs. Color feature models mainly include RGB and HSV color space models.
1) RGB color space model.
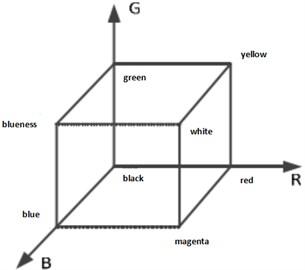
The RGB color space is based on the three basic colors R(Red: Red), G(Green: Green) and B(Blue: Blue), which are superimposed to different degrees to produce rich and extensive colors, so it is commonly known as the three-primary color mode. Fig.4. is the schematic diagram of RGB color space model, where the value range of each primary color is [0, 255]. When all three are 0, the overall color of the image is black, while when all are 255, the image is white.
In practical applications, the RGB color space is simple and intuitive, easy to understand and lower computational complexity, but sensitive to illumination change, especially at night, haze and rainy day visibility is not high, under the condition of three primary components will change in the color space, it's easy to have a color distortion, leading to significant limitations in practical applications.
Fig. 4RGB color space
2) HSV color space model.
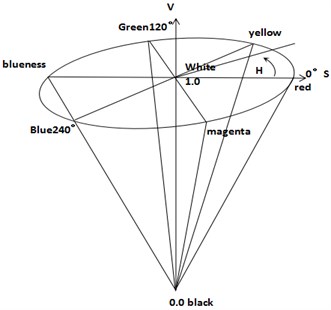
HSV color space is similar to human visual perception system, mainly composed of three parameters, Hue, Saturation and Value. The Fig.5. shows the HSV color space model. The point at the bottom of the vertebral body indicates zero brightness and black color, whereas the point at the top of the vertebral body corresponds to white color. H represents the perception of different colors by the sensory system. Starting from the position of 0° red, 120° counterclockwise rotation around the V axis is green, and then it is blue when rotating to 240°. The complementary colors differ by 180° respectively. The value of S is in the range of [0,1]. The larger the value of S, the brighter the color looks. The central axis of the vertebral body model represents brightness V with a range of [0, 1]. When V value is 0, it represents black, and when V value is 1, it represents white.
In the field of image recognition, because the HSV model is more intuitive, more widely used, and can better reflect the parameters of hue, saturation and brightness value, the collected RGB model is usually converted to the HSV model during the original image collection.
Fig. 5HSV Color Space
The specific formula for converting RGB model to HSV model is as follows:
As can be seen from the above equation, when the color space is converted from RGB to HSV, a nonlinear operation is required. Table 2 below shows the segmentation threshold of HSV color space after the nonlinear operation.
Table 2HSV color space threshold segmentation
Color | H | S | V |
Red | H > 340 | S > 43 | V > 46 |
Yellow | 75 > H > 26 | S > 43 | V > 46 |
Blue | 250 > H > 100 | S > 142 | V > 80 |
2.2.4. Color threshold segmentation
Threshold segmentation is to use the three characteristics of HSV, Hue, Saturation and Value, to set a range to extract the desired target color different from the background. The advantage of color threshold-based segmentation is that it is easy to understand and intuitive. Fig. 6 shows the process of color threshold segmentation.
Fig. 6Segmentation process of color threshold
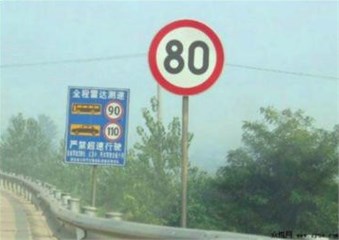
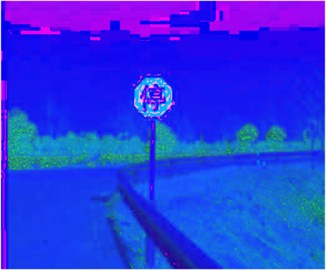
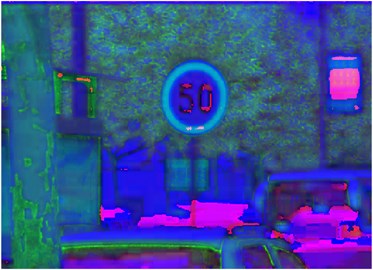
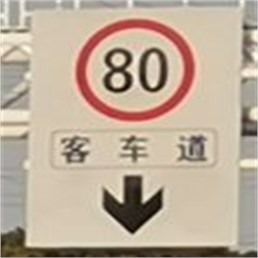
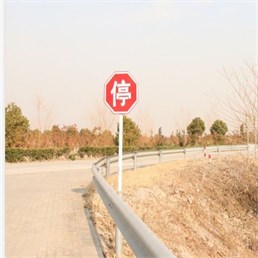
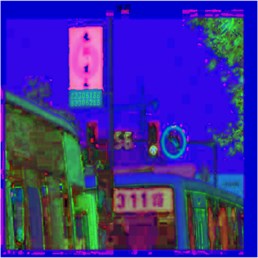
The following figure shows the segmentation of several traffic signs collected from the natural environment based on the HSV color space model. The binarization effect diagram after the segmentation is shown in Fig. 7.
As can be seen from the figure, HSV color threshold segmentation method can be used to separate various interference objects in the background of the original image from the objects that need to be detected, which reduces the difficulty of detection and reduces unnecessary errors for the next step of morphological processing.
2.2.5. Morphological processing
The binary image obtained by using the color threshold segmentation algorithm still has a large number of interference and miscellany points, and the collected image may be stained and obstructed, which leads to incomplete segmentation of the logo contour. This not only increases the number of follow-up detection areas, but also brings unnecessary errors to target detection, leading to the phenomenon of false detection. Therefore, in this paper, morphological processing method is used to further filter the binary image to eliminate some irrelevant interference.
Fig. 7HSV color threshold segmentation
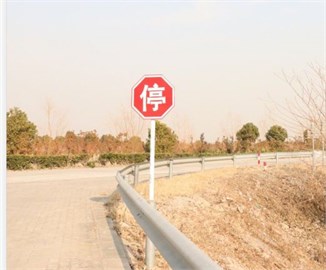
a) Original image
b) HSV segmentation
c) Original image
d) HSV segmentation
Morphological processing is based on the morphological structure elements, the fusion of a variety of logical operations to detect the image to extract the target area of interest, and according to the corresponding shape texture features to analyze and understand the image. Morphological processing is mainly aimed at binary image processing, which can be divided into four forms: corrosion, expansion, open operation and close operation.
1) Image corrosion.
Image etching is an operation to obtain the local minimum value of the image. By reducing the boundary range of the target image, the burr generated by the boundary and the small interference points in the image are eliminated, which plays a role in filtering the noise points. A represents the binary image obtained after color segmentation, and the corrosion template is set as B, then the mathematical definition is as follows:
wherein, is the binarization image after corrosion treatment, is the initial binary image, is the structural element of the corrosion template, and is the position of the origin of the structural element.
2) Image expansion.
Image expansion is an operation to obtain the local maximum value of the image. By fusing the background information which is in contact with the boundary of the target region with the target region, the boundary range of the region to be processed is expanded. The basic principle of image expansion is similar to that of image corrosion. A binary image is expanded by structural element , which can be expressed as ⊕. The specific definition is shown as follows:
where, represents the binary image after expansion processing, represents the original binary image, represents the expansion template, and represents the origin position of structural elements.
3) Open operation.
Image operation is the process of corroding the binary image first and then expanding, which can not only effectively eliminate the burr and outliers generated by the image boundary, but also keep the basic contour shape of the target area unchanged. Its expression is as follows:
where, the binary image processed by operation, represents the structural element of open operation, and represents the original binary image.
4) Close operation.
The image closing operation is a process of first expanding and then corroding the binary image, which can effectively fill the small holes in the original image, connect the narrow cracks, and make the boundary of the target region smoothen. The process of closed operation can be expressed as:
where, represents the binary image processed by the closed operation, represents the structural element of the open operation, and is the original binary image.
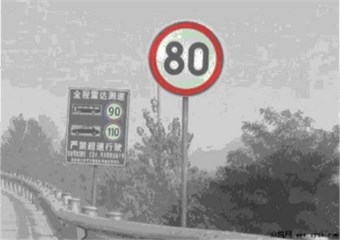
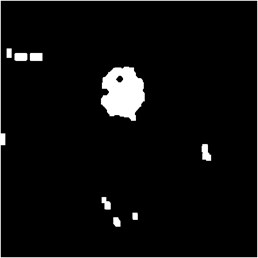
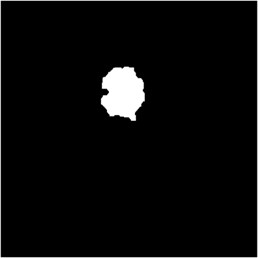
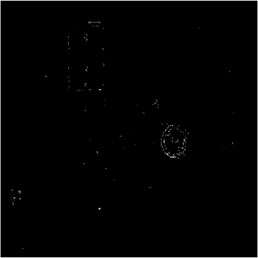
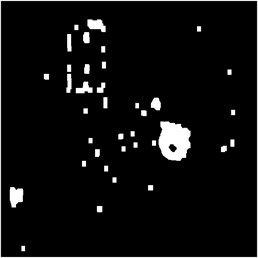
The morphological processing method adopted in this paper is image expansion, which will make the range of the target area larger. The background points that the target area contacts will be merged into the target object, so that the target boundary will expand outwardly. It can be used to fill some holes in the target area and eliminate the small particle noise contained in the target area. Fig. 8 shows the effect after image expansion.
Fig. 8Comparison diagram of image expansion
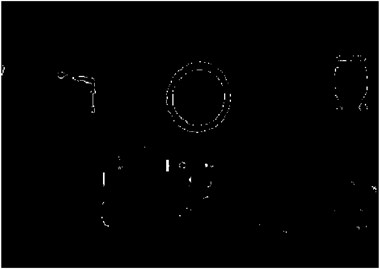
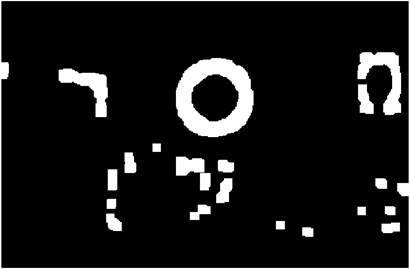
It can be seen from Fig. 8 that the noise points in the binary graph are weakened, while the contour of the marker area is enhanced. In other areas of the image, there are still some noise points formed by the contour of background interference. After image feature extraction, the influence of background interference will be further reduced.
3. HOG feature extraction
After color threshold segmentation and morphology processing, a large number of target candidate regions can be obtained from traffic sign images. However, due to the complexity of background environment, sometimes interfering objects will be misdetected as traffic signs, and there may be adhesion, stain and other situations, which seriously affects the accuracy of detection. In order to further improve the detection accuracy, after completing the preprocessing and segmentation of traffic signs, this paper further uses the HOG image feature extraction algorithm to filter out the misdetected non-traffic sign areas and get the image areas to be detected.
3.1. Overview of HOG feature method
1) HOG definition and application.
Is a feature descriptor used for object detection in computer vision and image processing. By calculating and counting the gradient direction histogram of the local area of the image to constitute the image features, has a strong image feature description ability, is widely used in target detection, tracking and recognition and other aspects.
2) The basic idea of HOG feature.
An image is divided into several small cells, and then the histogram of the direction gradient of each cell is calculated. Finally, the histogram of all cells is combined to form a descriptor that can describe the target to be detected.
3) HOG advantage.
Compared with other description method, the characteristics of a HOG feature extraction has the advantage that in the face of complex and diverse natural environment and road traffic conditions, can be more accurate and real-time identification of road traffic signs, HOG feature extraction to the collected images geometry and optical deformation happens in the global scope has good pertinence. The image features can be extracted accurately when the region of interest containing traffic signs is deformed. Secondly, for the local gray scale is strongly normalized, rough sampling in the spatial domain, or target detection in the subtle direction, the subtle change of the target will not affect the detection results. Therefore, HOG feature is very suitable for the detection of non-deformable objects. However, ordinary feature description methods are easy to be affected by factors such as weather conditions and environment, which greatly reduces the accuracy of detection and recognition.
3.2. Implementation process of HOG feature extraction algorithm
1) Gamma color correction. Since HOG feature is not sensitive to specific color information, the original color image can be grayed first. Then, in order to further reduce the adverse effects of light changes and shadows in local areas of the image on feature extraction, the Gamma color correction algorithm is used to normalize the grayed image. The formula for Gamma color correction is as follows:
where Gamma is a power of the index.
Image gradient calculation. After preprocessing the input original color image, the corresponding gradient value of the gray image should be calculated. In this paper, Sobel operator is used to carry out convolution operation on gray image, and the horizontal and vertical gradients of each pixel with gray value are obtained. Assuming that the gray value at the pixel point is , and the gradient in the horizontal and vertical directions can be expressed as and , then:
Then, the magnitude and direction of the gradient value of the pixel can be obtained as follows:
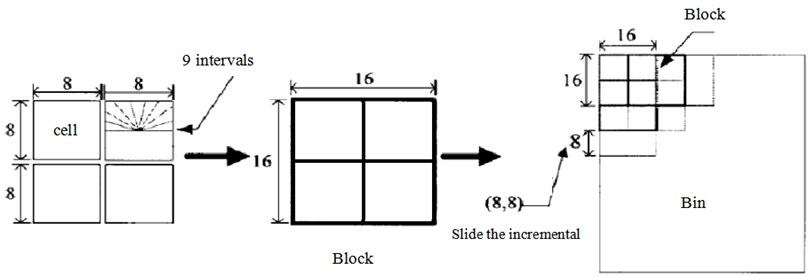
3) Calculate the histogram of gradient of each cell unit. Before calculating the gradient histogram of Cell, it is necessary to divide the segmented traffic sign image into different Cell units, each Cell unit contains C1×C2 pixels, each Block area contains B1×B2 Cell units, and each Block area overlaps each other to a certain extent. Then, the gradient direction of [0, 360°] is divided into intervals (Bin) in each cell unit, as shown in the Fig. 9 in detail. Finally, the gradient amplitude in each cell unit is calculated by the formula according to the interval where the corresponding gradient direction angle is:
where, represents the th cell unit, and represents the KTH interval in each cell unit.
Fig. 9Division diagram of cell unit, region block and interval bin
4) Gradient direction normalization and vectorization. According to Eq. (15), the gradient histogram features of all cell units in each Block are cascaded to obtain the characteristic Hb of each Block, and then the L2 norm is used to normalize the HB to obtain NHB, as shown in Eq. (16):
where, and can be used to prevent the divisor from being 0. Finally, the NBH features of all the Block areas in the detection window are combined in series to obtain the HOG feature vector of the window, namely, the vectorization of the features in the window is realized:
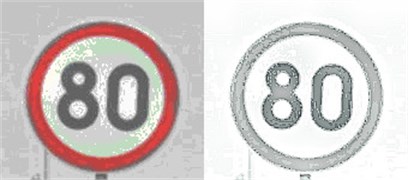
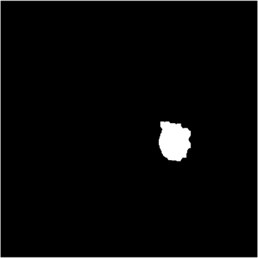
Fig. 10 shows the process of image feature extraction for several traffic signs collected from the natural environment:
After the feature extraction of the HOG image, the sharp contrast can be seen from the image. The interference points in the non-traffic sign area are further filtered out, which greatly improves the accuracy of detection.
Fig. 10Image feature extraction


4. Simulation and result analysis
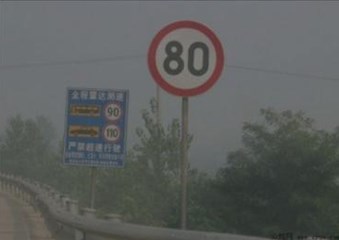
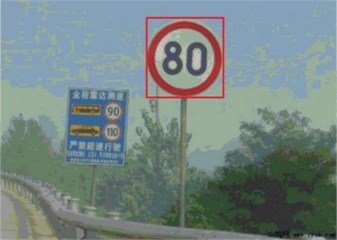
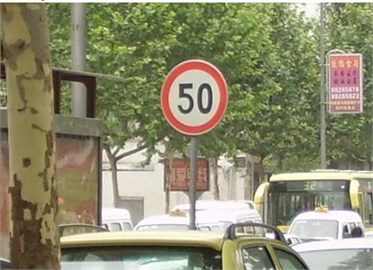
After color segmentation and morphological processing of traffic signs, the HOG feature extraction area needs to be accurately detected. In order to fully verify the effectiveness of the traffic sign detection algorithm based on HOG feature extraction, the detection of traffic signs is realized by programming simulation in Intel(R) Core(TM), 2.20 GHz, 12 GRAM, 64-bit Win7 operating system and Matlab R2019A. Fig. 11 and Fig. 12 show the running results.
Fig. 11Recognition process of speed limit sign
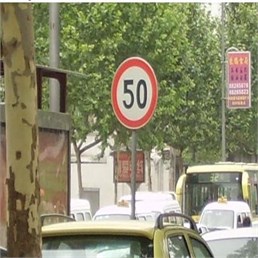


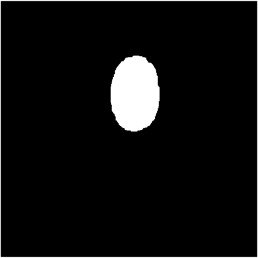
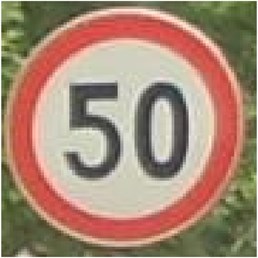
Fig. 12Inhibition flag recognition process
The test results are shown in Fig. 12 and Fig. 13. The simulation results show that the traffic sign detection algorithm based on HOG feature extraction can accurately and quickly identify the traffic sign images, meet the requirements of accuracy and real-time, and achieve good results.
5. Conclusions
In this paper, the detection algorithm based on HOG feature extraction, finished on the natural environment of road traffic sign detection, first of all, through visual sensors to collect images, improve image quality, the technology of image preprocessing using color threshold segmentation method will be collected RGB image space model is converted into HSV space model and threshold segmentation, The pre-processed binary image is obtained. Morphological processing is used to separate all kinds of interference objects in the background of the original image from the target objects to be detected, and the non-traffic sign area which is detected by mistake is filtered out to reduce the difficulty of detection. Finally, the target area is further screened through HOG feature extraction, and the direction histogram of the gradient or edge of each pixel in the cell unit is collected. By calculating and counting the direction histogram of the gradient in the local area of the image, the image features are constructed, so as to quickly and correctly identify the traffic signs.
The simulation results show that the algorithm based on feature extraction also has some shortcomings. Since the detection realized by us is the still image taken by the camera, if the input is the dynamic image, the factors such as motion blur, shadow or highlight need to be taken into account. In practical application, the identification of traffic signs by the auxiliary driving system is based on dynamic video stream. Therefore, in the future work, the traffic sign detection and recognition algorithm under the dynamic video environment should be further studied.
References
-
H.-M. Yang, C.-L. Liu, K.-H. Liu, and S.-M. Huang, “Traffic Sign Recognition in Disturbing Environments,” in Lecture Notes in Computer Science, Berlin, Heidelberg: Springer Berlin Heidelberg, 2003, pp. 252–261, https://doi.org/10.1007/978-3-540-39592-8_35
-
K. Hirose, T. Asakura, and Y. Aoyagi, “Real-time recognition of road traffic sign in moving scene image using new image filter,” in 2000 IEEE International Conference on Industrial Electronics, Control and Instrumentation, pp. 13–18, https://doi.org/10.1109/iecon.2000.972618
-
Zhu Shuangdong, Zhang Yi, and Lu Xiaofeng, “Intelligent detection method for triangular traffic signs,” (in Chinese), Journal of Image and Graphics, Vol. 11, No. 8, pp. 1127–1131, 2006.
-
N. Zhajing et al., “Multiple feature fusion of circular traffic sign detection,” (in Chinese), Journal of pattern recognition and artificial intelligence, Vol. 24, No. 2, pp. 226–232, 2011.
-
M. Liang, M. Yuan, X. Hu, J. Li, and H. Liu, “Traffic sign detection by ROI extraction and histogram features-based recognition,” in 2013 International Joint Conference on Neural Networks (IJCNN 2013 – Dallas), pp. 1–8, Aug. 2013, https://doi.org/10.1109/ijcnn.2013.6706810
-
N. Liaminjian et al., “A traffic sign recognition method based on HOG-Gabor feature fusion and softmax classifier,” (in Chinese), Journal of Traffic and Transportation Engineering, Vol. 17, No. 3, pp. 151–158, 2017.
-
Hu Yaling, “Research on traffic signs detection and recognition based on visual saliency,” (in Chinese), Lanzhou University of Technology, Gansu, 2012.
-
A. Ruta, Y. Li, and X. Liu, “Real-time traffic sign recognition from video by class-specific discriminative features,” Pattern Recognition, Vol. 43, No. 1, pp. 416–430, Jan. 2010, https://doi.org/10.1016/j.patcog.2009.05.018
-
I. Qyueya, “Research on key technology of traffic sign detection and recognition,” (in Chinese), Changchun University of Science and Technology, 2019.
-
N. Zhaxu, “Research on traffic sign recognition method based on machine learning,” (in Chinese), Xi’an University of Technology, 2019.
-
Hai Song Ha, “Rapid detection and recognition of traffic signs based on convolutional neural network,” (in Chinese), Harbin University of Science and Technology, 2020.
-
Sun Yan Yan, “Research on traffic sign detection and recognition method based on deep learning,” (in Chinese), Zhengzhou University, 2020.
-
A. Hcong, “Detection and classification of traffic sign target in natural scenes,” (in Chinese), Guilin University of Electronic Science and Technology, 2020.
-
Yao Zhaoxiao, “Research on traffic sign detection and recognition method based on machine learning,” (in Chinese), Shanghai University of Engineering Science, 2020.
-
N. Zhawei, “Research on road traffic signs recognition method based on support vector machine,” (in Chinese), Dalian Jiaotong University, 2019.
-
N. Dalal and B. Triggs, “Histograms of oriented gradients for human detection,” in 2005 IEEE Computer Society Conference on Computer Vision and Pattern Recognition (CVPR'05), pp. 886–893, https://doi.org/10.1109/cvpr.2005.177
-
Wang Jiaojiao, “A study of traffic sign detection and recognition based on significance and convolutional neural network,” (in Chinese), Chang’an University, 2017.
-
N. Wagan, “Research on traffic sign detection and recognition algorithm based on machine vision,” (in Chinese), China University of Mining and Technology, 2019.
-
Tan Zhaolin, “Research on traffic sign recognition in natural scene based on deep learning,” (in Chinese), South China University of Technology, 2018.
-
X. Qingzhi, “Traffic sign recognition and implementation based on deep learning,” (in Chinese), Beijing Jiaotong University, 2018.
Cited by
About this article

