Abstract
In recent years, image processing technology has been developing and maturing, but due to the influence of many interfering factors in the acquisition process, there is a large amount of redundant information in the images obtained. The line segment detection algorithm in image extraction needs to be improved. This study utilizes computer technology to improve the line segment detection technology, and designs a line segment detection algorithm based on the linear detection improvement. Firstly, based on the basic principle of straight line detection algorithm, for the problems of line segment breakage and missing in straight line detection, RGB three-channel grayscale map is applied to detect line segments. Then the detected line segments are connected, merged and deleted. The test results show that the line segment detection algorithm improved based on straight line detection has the highest accuracy rate of 94.50 %, and the average processing time per image is also the lowest at 0.2 s. The algorithm runs faster at 0.25 s and has a higher F-value. It is able to detect the boundaries of a variety of rectangular targets, using the improved line segment detection algorithm has a wide range of applicability, lower error rate, and strong anti-interference ability. The improved line segment detection algorithm has a greater advantage in rectangular target extraction for document, text and book type images.
1. Introduction
With the continuous progress of science and technology and the promotion of intelligent devices, the quality of captured images is getting higher and higher. However, the demand for massive image processing has also increased, including the processing of digital document images such as personal ID photos and reports [1]. For these massive image information, manual processing is not only inefficient, but also easy to recognize errors, resulting in economic losses [2]. The use of computer technology, automatic image extraction and detection, saving a lot of labor costs while also improving detection accuracy. The key to automatic computerized image processing technology is to remove unwanted redundant background information and extract the desired targets directly from the image [3]. Compared with traditional image features such as edge curves or feature points, straight line segment (LS) features contain richer information about the angles, centroids, geometric relationships and topology of the most basic straight LSs in the scene [4-5]. In order to analyze the basis of the image content or to detect the high-level features of the image, the information of the image is extracted using the line segment detection (LSD) method. However, in practice, due to the variety of image types, different shooting equipment, varying light intensity and complex backgrounds, the uncontrollable factors of image extraction increase, which greatly interferes with the LSD in image extraction. Currently proposed LSD algorithms in image extraction are generally targeted at certain specific scenes, such as aerial images, road signs and license plates [6], and their accuracy is much lower when applied to other types. In order to solve such problems, this study improves the LSD algorithm in image extraction and proposes a rectangle detection algorithm based on straight LSD with higher accuracy and adaptability.
This research is divided into four parts: the second part gives an overview of the current state of research on LSD algorithms in image extraction. The third part proposes the design of LSD algorithm in image extraction, the first section describes the basic principle of the LSD algorithm, and the second section improves the LSD algorithm. In the fourth section for three types of images, card, book and document are extracted experimentally using the improved LSD algorithm and the improved LSD is compared with other image extraction algorithms.
2. Literature review
With the continuous development of computer technology and the increasing amount of massive image information, scholars at home and abroad have conducted extensive research on image processing technology. Image processing technology is applied in various industries. Hua et al. use image processing technology to carry out intelligent and standardized management of pig farming through data analysis of images. The study illustrates that the use of image processing technology can help hog farming for manual management, improve management efficiency and productivity, and reduce the probability of pig illness and mortality [7]. Jiang et al. used in the sports industry by recognizing the action images of sports through operations such as image acquisition and feature extraction. This technique can help athletes to train better and perform standardized movements [8]. Image extraction is an important step in automatic computer image processing technology. Wang in financial stock image processing technology, based on image recognition technology, the image is normalized and feature recognition is performed with grayscale images. Then combined with stock image features, minor fluctuations are ignored and drying process is removed. The method improves the accuracy of the image and can reflect the stock situation more intuitively [9]. Dai et al. proposed a straight line segment optimization algorithm for the problem of straight lines being easily broken in the information extraction of optical remote sensing images, which is based on the texture features and geometric features analysis of the law of line segment breakage. The algorithm simulates different real-world scenarios for simulation experiments. It is not only able to solve the LS breakage caused by terrain occlusion and edge jaggedness, but also has a great advantage in optimizing the length of the LSs and suppressing the problem of over-extraction compared with other methods [10]. K. S. et al. proposed a method for measuring structural vibration displacement based on photographic images, which used photographic images to measure structural vibration displacement at a distance, and the experimental results showed that it had good accuracy [11]. In addition, in the wireless vibration detection neighborhood, Zhang D. et al. used imaging processing methods for multi-phase applications related to vibration detection [12]. Although some researches have made remarkable progress in image processing technology, there are still problems such as insufficient accuracy and slow processing speed in the field of rectangular object detection, especially in the application of complex environment.
The existing LSD can be categorized into two main categories according to the principle of edge information based LSD algorithms and Hough transform based line segment detection algorithms. Feng et al. proposed a new algorithm combining the information fusion detection based on the image edge detection technology, which was investigated from fuzzy radial basis fusion discrimination. And the improved median filter denoising was chosen to compare the edge detection effect of different operators. According to the findings, it can accelerate the preprocessing speed, meet the real-time detection, and reduce the amount of data processed by the upper computer [13]. Zhang et al. proposed a new algorithm applied to the recognition of arrow markings and text markings between lane lines. The algorithm consists of four parts: Gaussian blurring, image graying process, DLD thresholding algorithm, correlation filtering edge extraction and Hough transform. According to the findings, the highest recognition rate of 97.2 % for interference recognition between lane lines on Caltech Lanes dataset [14]. Rectangular target detection is an improved algorithm based on straight LSD algorithm which is more widely used in real life applications. Singh et al. proposed a sensor based on silicon nanowire rectangular optical waveguide for early detection of lung cancer. The detector was parameter optimized by a two-dimensional vector finite element method, which is very effective in the early detection of lung cancer [15]. Xu et al. proposed Lucas-Kanade optical flow algorithm to detect moving obstacles around agricultural machinery, which is based on detecting panoramic images with fast detection technique, combined with clustering segmentation algorithm and intraclass variations in the direction of the optical flow and the length of the optical flow to filter out the noisy optical flow. The experimental results show that the algorithm takes an average time of 0.801 s to process 100 frames of images, and the accuracy of dynamic agricultural machinery detection is 88.06 % [16]. In this study, an innovative improvement is made on the basis of the existing line segment detection algorithm. Different from previous studies, our proposed algorithm optimizes the line segment merging and filtering mechanism, reduces the false detection rate, and improves the detection speed through advanced point-line relationship calculation method, thus effectively addressing the challenges in complex image environments.
To sum up, in order to improve the accuracy of rectangle detection and expand the actual scope, the main contribution of this study is to propose a more efficient and accurate rectangular object detection algorithm. Compared with the existing methods, our algorithm shows higher accuracy and faster processing speed when processing complex images, which provides a new possibility for the application of image processing technology in various fields, especially in the dynamic environment of real-time image processing. Firstly, the color image is converted into a grayscale image, and then the LSD algorithm is used to detect the RGB three-channel grayscale map to get the straight LSs. Secondly then the detected straight line segments are merged, filtered, connected and deleted. Then calculate the distance between point and point, point and line, line and line, and the coordinates of the intersection point. Finally, the required information is extracted from the image based on rectangular target detection.
3. Improvement of line segment detection algorithm in image extraction
This section first introduces the basic principles of straight line detection algorithm, and then proposes a rectangle detection algorithm based on the improved straight line detection algorithm by linking, merging, and deleting repetitive interfering LSs in the group of LSs in response to the existence of problems such as broken and missing line segments in straight line detection.
3.1. Improved LSD based on LSD
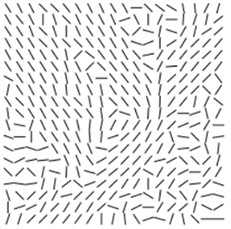
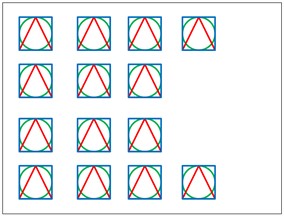
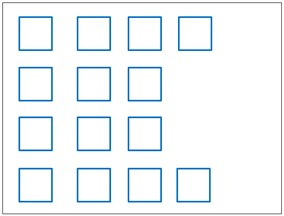
Line Segment Detection is a LSD algorithm based on the Hough transform [17-18]. The most basic idea of the LSD algorithm is to detect the set of pixel points in the image with large changes in the gradient, and it is precisely by using the gradient information and level-line that the LSD algorithm performs the detection of the straight line [19-20]. Row and column lines refer to the set of pixels with large gradient changes in the image, and they represent the linear features existing in the image. The method of acquiring the line is to detect the position and direction of the line segment by using gradient information and horizontal line Angle. The LSD algorithm first calculates the angle of the level line for each. The LSD algorithm first calculates the angle of the horizontal line of each pixel point, and then generates a horizontal unit vector field. The horizontal line angle of the pixel is also the vertical angle of the gradient direction of the pixel. After obtaining the horizontal line field, the region is utilized to cut it into several connected domains using the region growing method. The horizontal line angle of all pixels in each connected domain cannot vary more than a tolerance value, such a connected domain is called a line support region, and each line support region is a candidate for LSD, as displayed in Fig. 1.
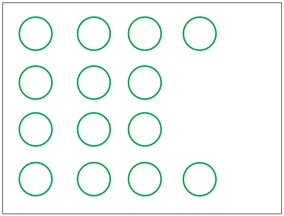
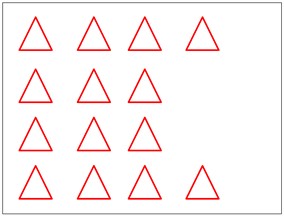
As you can see from Fig. 1, the green, orange, and blue regions represent different line support regions. The scale of digital discrete image will affect the effect of line segment detection. However, the digital discrete image without scaling will be prone to the jagged effect, resulting in the detected line segments are missed or broken, as shown in Fig. 2.
Fig. 1Diagram of the process of obtaining the line support region
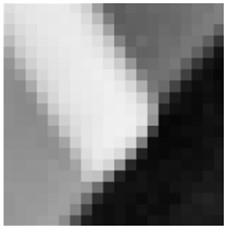
a) Image
b) Level-line
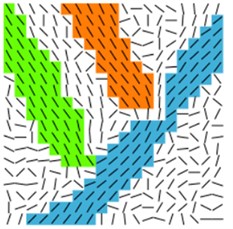
c) Line support regions
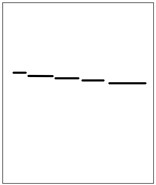
Fig. 2Results of LSD detection of two edges in digital discrete image without scaling
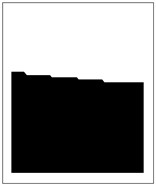
a) Original image
b) Line segment detection
c) Original image

d) Line segment detection
As can be seen from Fig. 2, Fig. 2(a) and (c) show the edges of the image at different angles, and Fig. 2(d) and (b) show the LSD results for the corresponding edges. Four LSs are detected in Fig. 2(a), while no LSs are detected in Fig. 2(c). The digital discrete images are scaled using Gaussian will sampling and the Gaussian kernel is computed in Eq. (1):
where, represents the Gaussian kernel standard deviation and also the scaling scale, represents the overall sample, represents the scaling factor. and are reasonable values to obtain a good balance between avoiding aliasing and avoiding image blurring. After image scaling, region growing construction is performed, and all pixel points are sorted according to the gradient size to get the linear support region. To determine the attributes such as angle, length and width of the straight line, rectangle fitting is required. The direction of the long side of the rectangle is the first axis of inertia of the linear support region, and the center of the rectangle is the center of mass of the linear support region, whose calculation formula is shown in Eq. (2):
where, represents the set of all pixels in the region, and represents the gradient size of the pixel in the linear support region. The line segment detection of the rectangular boundary will get a large number of line segment groups containing interfering line segments, so the line segment groups need to be screened according to certain rules. The main step of rectangle screening is to categorize the detected line segments according to their angle with the horizontal direction, and then filter them based on the direction and length of the line segments.
During image acquisition, due to the interference of various factors, the extraction of rectangular target boundaries from various complex backgrounds is not precise enough, and in order to address this problem, the LSD is improved in this section. Since the LSD algorithm can only process single-channel grayscale images, when the image contains multiple channels of color images, the LSD algorithm cannot be directly processed for color images. The color image needs to be converted into a grayscale image before it can be detected using the LSD algorithm, but because the conversion process may lose much line segment information, which may eventually lead to the occurrence of line segment leakage detection.
Based on the different color contrast between multiple channels of the color image, it is divided into R (red), G (green) and B (blue) three-channel grayscale maps [21], and then use the LSD algorithm to detect the three-channel grayscale maps linearly respectively, and finally the results obtained from the detection are fused. The effect of multi-channel detection of color image is shown in Fig. 3.
Fig. 3Schematic diagram of RGB channel detection of color image
a) RGB color image
b) Blue component image
c) Green component image
d) Red component image
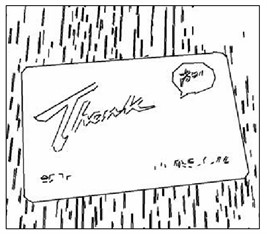
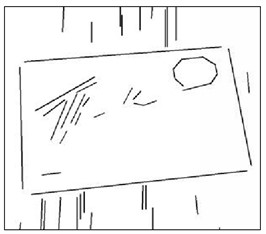
As can be seen from Fig. 3, (a) figure is the original image of the color image, (b) figure is the grayscale map detection result of the red channel, (c) figure is the grayscale map detection result of the green channel, and (d) figure is the grayscale map detection result of the blue channel. The line detection of the three channels of RGB obtains the three line groups of line R, line G, and line B, respectively, and the three parts of the three channels that have a better detection result are Fusion is carried out to complement the strengths of the three channels. Multi-channel detection not only reduces the probability of leakage to get better detection results, but also helps in the case of fracture. The scaling factor of Eq. (1) is too small, so that some details of the image are ignored in the detection process. Although it is easy to detect the longer LSs in the original image, it is not possible to detect the shorter LSs. If the scaling factor is too large, the longer LSs are easily broken and the shorter LSs in the original image are easily detected. The LSD results for the original image under different scaling scales are displayed in Fig. 4.
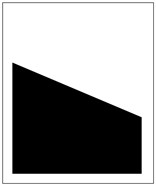
From Fig. 4(a) figure is the original image of the color image, Fig. 4(b), (c) and (d) figures are converted to grayscale image and scaled according to the scaling scale as 0.8, 0.6 and 0.4, and the LSD algorithm line segment detection to obtain the three images. (b) Scaled according to 0.8, the images contain a large number of interfering line segments. (c) scaled according to 0.4 and long LSs on the image boundary are missed to be detected. (d) scaled according to 0.6, the rectangular boundary line segments are detected better with reduced background and interfering line segments. Therefore, in this study, the image is scaled using the scaling scale 0.6 and the line segment joining operation is used to reduce the broken long line segments.
Fig. 4Plot of LSD results of LSD algorithm under three scaling scales

Original image
b)0.8
c)0.4
d)0.2
3.2. Improved LSD algorithm based on line segment fusion
After LSD of the grayscale maps of the three channels of the color image RGB, three line segment groups lineR, lineG, and lineB are obtained, and the merging of the LS groups results in the line segment group. a large number of overlapping LSs in the LS group are not required for the experiment, and these overlapping LSs need to be deleted. Firstly, reorder the LSs in the LS group according to their lengths in descending order, and the sorted LSs are labeled as , , , . Set as the LS length distance threshold, and the length of the LS meets . The Euclidean distance [22] between the endpoints of line segment and line segment is calculated as Eq. (3):
where, and are the two endpoints of the line segments , , , . If the distance between the two endpoints of the LS is less than the threshold value , it means that the line segment cannot be linked with other linearity from both ends, which is set to , and vice versa, which is set to . The threshold value of the distance between the two endpoints of the LS is shown in Eq. (4):
where, , is the width and height of the image, and represents the distance coefficient of the endpoints. When , or , , it means that the two line segments overlap, then the duplicate line segment is deleted from . Repeat the above steps to match the line segments sequentially until all duplicate line segments are removed from . If the manually calibrated boundary line segments are detected accurately, it means that the results are detected accurately, and the accuracy rate is calculated in Eq. (5):
where, represents the samples with accurate detection results, and represents all samples. Recall is also one of the metrics for performance evaluation of linear detection algorithms, which is calculated in Eq. (6):
where, is a manually labeled image sample. The reconciled average of the two metrics, accuracy and recall, is the F-Score, which is calculated in Eq. (7):
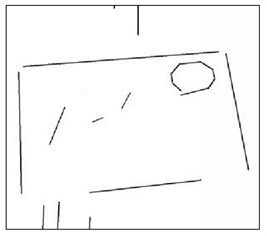
where, is a parameter whose value is determined by the weight value of accuracy and recall. Since accuracy and recall are equally important in this study, is set to 1. In the image background due to the LSD algorithm detection, the line segments may be broken, so the broken lines need to be connected. The process of connecting the line segments may lead to positional shift condition when connecting due to the presence of pseudo-edge line segments and interfering LSs, as illustrated in Fig. 5.
Fig. 5Schematic diagram of rectangular boundary line segments misconnected with interference line segments
a) Before the segment link
b) After the segment is linked
From Fig. 5, the misconnection of the interfering line segments with the rectangular boundary line segments leads to an offset in the vertex position of the boundary line segments. To address this situation, this study proposes a new line segment strategy. It is set that if the distance between the endpoints of two LSs is less than a threshold and the two LSs are approximately perpendicular, the two LSs cannot be linked with other LSs. To deal with noise lines with the same Angle, an additional Angle sensitivity analysis is introduced in this study. When two line segments are at the same Angle, we will check their spatial position relationship. If these line segments are spatially far apart or do not conform to a known target structure, they are identified as noise lines and excluded from the analysis. After the LSs in the LS group are merged, the link flag bits , are set to the two endpoints of any one of the line segments . The slopes of the lines and are calculated using the Eq. (8):
where, , represents the horizontal coordinate of the endpoint, and , represents the vertical coordinate of the endpoint. According to the calculated slope of the LS, and then calculate the straight line angle, the straight line angle calculation formula is shown in Eq. (9):
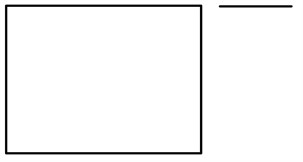
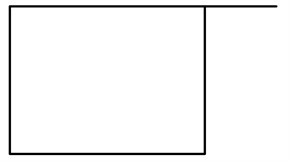
where, represents the angle of the line, and when [80°, 90°], it means that the line segment is perpendicular to . According to the angle of the LS, determine the position between the LSs as shown in Fig. 6.
Fig. 6Schematic diagram of line segment angles
From Fig. 6, it can be seen that when is less than the angle threshold , then it means that the line segment is parallel to . The linear equation of the line segment is set as Eq. (10):
where, , are all the parameters of the variables, which satisfy the different time zero, and is a constant. The formula for each parameter is given in Eq. (11):
After obtaining Eq. (11), the distance from the point to the LS is then calculated and its formula is given in Eq. (12):
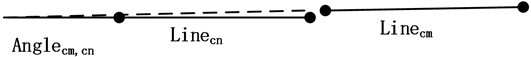
where, and represent the distance between the point , and the line segment , respectively. Next, the perpendicular distance between the line segment and the line segment is calculated using the formula in Eq. (13):
where, indicates the vertical distance between line segments and . When the value of is less than the vertical distance , it means that the two LSs are on the same horizontal line. The calculation formula between points is shown in Eq. (14):
where, , represents the distance between the point and the point , ; and represents the distance between the point , and the point , . Two LSs are said to be adjacent if the minimum value between points is less than the horizontal distance threshold. When the distance between points and LSs, the distance between LSs, and the distance between points are all satisfied, the extendable endpoints are linked to form a new line segment . The new segment is added to the segment group and the original and are deleted from the segment group. In order to increase the speed of subsequent processing, short interfering segments can also be deleted. The formula for calculating the minimum threshold of the rectangular side length is shown in Eq. (15):
where, , is the width and height of the image respectively, and represents the minimum side length coefficient set for the target rectangle. Calculate the length of each side in the line group according to Eq. (3), and if the length of the LS in the line group is less than , it will be regarded as an interfering LS and will be deleted. The expressions of linear equations of line segments , , , are calculated according to Eq. (10) and their expressions are shown in Eq. (16):
Eq. (16) is the expression of the linear equation of the line segments , , , . Based on the linear equations of the lines, the coordinates of the corresponding intersection points of the two intersecting LSs are calculated, and the formula is shown in Eq. (17):
where, , , , , represent the straight lines , , ,. According to the obtained coordinates of the intersection points, the four boundary lines of the rectangular target are formed. According to the above processes and steps, the process of line segment extraction is shown in Fig. 7.
4. Analysis of experimental results of the improved LSD
In this section, the difference between the improved LSD algorithm and other algorithms for image processing is first verified, and then the manually calibrated rectangular vertices are compared and analyzed with the detected vertices. The data acquisition process begins with the selection and classification of the dataset used in the experiment, which contains 2213 images divided into three categories (book, document, card) to cover different types of rectangular objects. The second is the distribution of sample number, which ensures that the number of three types of images is almost the same on the whole, respectively 769 book images, 684 document images, and 760 card images, so that the algorithm has the generalization ability. In addition, in order to improve the diversity of the data set, a variety of different mobile devices were used to shoot, including mobile phones from vivo, Huawei, Xiaomi, iPhone and other brands. The collected data is named Tu-Pxiang according to the above process. Table 1 shows the hardware parameters of different mobile devices.
Fig. 7Schematic diagram of the main flow for segment extraction
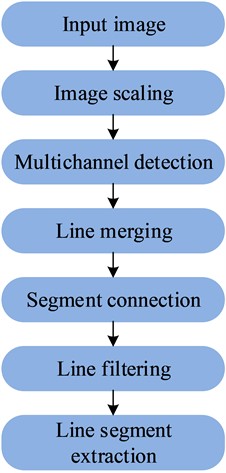
Table 1Parameters for different mobile devices
Parameters | vivo | Huawei (brand) | millet | iPhone |
Color gamut | sRGB | sRGB | sRGB | sRGB |
Resolution (of a photo) | 1920×1080 | 4000×3000 | 3456×4608 | 4200×3456 |
Bit depth | 24 | 24 | 24 | 24 |
Horizontal dpi | 72 | 72 | 72 | 72 |
Vertical dpi | 72 | 72 | 72 | 72 |
As can be seen from Table 1, the resolution has a great impact on the images. The images with different resolutions are collected and then labeled using Labelme labeling software. Data preprocessing process: Considering the important influence of resolution on image effect, the collected images with different resolutions need to be analyzed in the experiment, and these images should be labeled for subsequent experiments. Labelme labeling software was used to manually calibrate the rectangular vertices in the image to obtain high-quality labeling data as the ground truth of the experiment. The experimental running platform is 3.6 GHz Intel Core i7, 16 GB RAM, 4-core and 8-thread CPU. The faster the running speed of the algorithm the more advantageous it is in practical applications. The improved IM-LSD algorithm and LSD algorithm in this paper, the Kanade optical flow algorithm based on the rapid detection technology of panoramic images in literature [16], the MIDV algorithm based on Hough transform in literature [23], and the Linelet algorithm based on the optimal combination of atomic and ion lines in literature [24], are introduced. As well as the MCMLSD algorithm based on perceptual grouping and global accumulation in Hough domain in literature [25], the six algorithms were compared in C\C++ environment. IM-LSD, Kanade, MIDV, MCMLSD, Linelet and LSD algorithms in the same dataset are shown in Fig. 8.
From Fig. 8. For the card class target image, the accuracy of line segment detection in image extraction of IM-LSD algorithm proposed in this study reaches 92.65 %, which is 20.06 % improved compared to Kanade algorithm and 55.38 % improved compared to Linelet algorithm. For book-like target images, the LSD accuracy in image extraction of IM-LSD algorithm reaches 94.12 %, which is 8.87 % higher compared to MCMLSD algorithm and 52.23 % higher compared to MIDV algorithm. For document type target images, the accuracy of line segment detection in image extraction of IM-LSD algorithm is 86.56 %, which is improved by 7.65 % compared to Kanade algorithm and 47.21 % compared to Linelet algorithm. Still IM-LSD algorithm has the highest accuracy among the three different types of image detection. Then the above algorithms are compared and analyzed in terms of the number of LSD. Fig. 9 illustrates the results.
Fig. 8Accuracy of detection by different algorithms
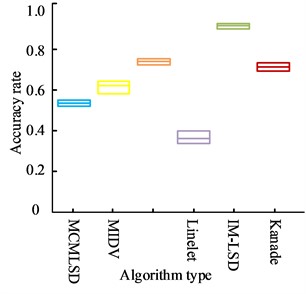
a) Text type
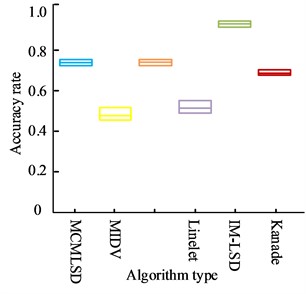
b) Book type
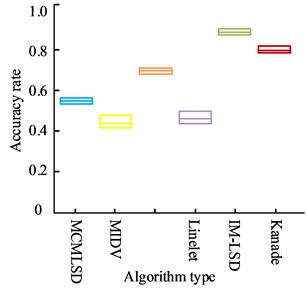
c) Type of documentation
Fig. 9Comparison of the number of lines detected by different algorithms
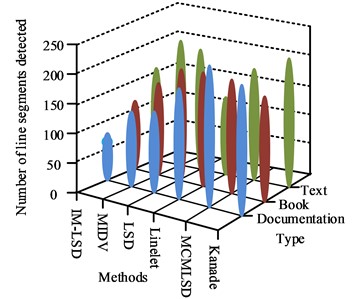
a) Training set
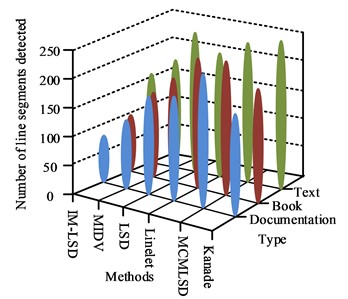
b) Test set
From Fig. 9, the number of lines detected using different algorithms for three types of rectangular target images, namely, document, card and book, varies and differs greatly. However, both on the training set and test set, the IM-LSD detects the least number of lines. The average value of the number of lines extracted from card-based images is around 65, the average value of the number of lines extracted from book-based images is around 106, and the average value of the number of lines extracted from book-based images is around 152. The detection time of the above algorithms are compared and analyzed and the results are shown in Fig. 10.
Fig. 10Comparison of processing time of different algorithms
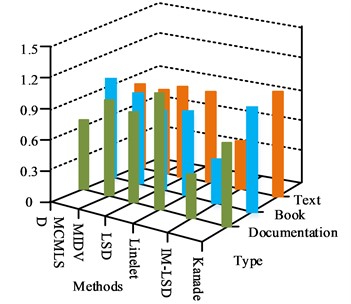
a) Training set
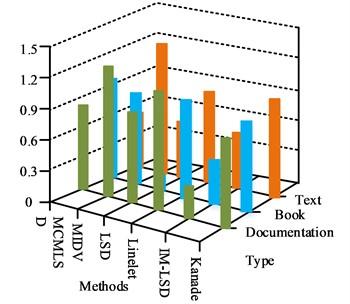
b) Test set
From Fig. 10, the IM-LSD check detection speed is significantly faster than the other algorithms, both on the training set and the test set. The line detection speed of IM-LSD algorithm for card-like images is around 0.2 s, the line detection speed of IM-LSD algorithm for book-like images is around 0.3 s, and the line detection speed of IM-LSD method for document-like images is around 0.4 s. Compared with other algorithms, the IM-LSD algorithm has the fastest detection speed, which is due to the fact that the improved algorithm merges the LSs, removes the duplicate LSs and too short interference LSs in the original LS group , and improves the speed of subsequent processing. The manually calibrated rectangular vertices are then compared and analyzed with the detected vertices, and if the distance between the detected vertices and the manual vertices is greater than , the detection result is considered to be incorrect, and less than or equal to , the detection result is considered to be accurate. The six algorithms IM-LSD, Kanade, MIDV, MCMLSD, Linelet and LSD are experimented on dataset. Table 2 displays the detection results.
Table 2Vertex test results for different algorithms
Arithmetic | Average processing time (s) | Accuracy (%) |
MCMLSD [25] | 0.65 | 71.76 % |
MIDV [23] | 0.49 | 80.09 % |
LSD | 0.43 | 82.21 % |
Linelet [24] | 0.72 | 78.93 % |
Kanade [16] | 0.63 | 82.34 % |
IM-LSD | 0.20 | 94.18 % |
As can be seen from Table 2, in the mixed class rectangular target detection experiments, the IM-LSD algorithm has the highest detection accuracy of 94.50 %, and the MCMLSD algorithm has the lowest detection accuracy of 71.76 %. the IM-LSD algorithm has the shortest average processing time per image of 0.2 s, and the Linelet algorithm has the longest average processing time per image of 0.72 s. in the in the dataset, the IM-LSD algorithm has the fastest average processing time per image and the highest accuracy among the six algorithms. Finally, the F-values of the six algorithms IM-LSD, Kanade, MIDV, MCMLSD, Linelet and LSD are compared and their experimental results are shown in Fig. 11.
Fig. 11F-value of processing speed for different algorithms
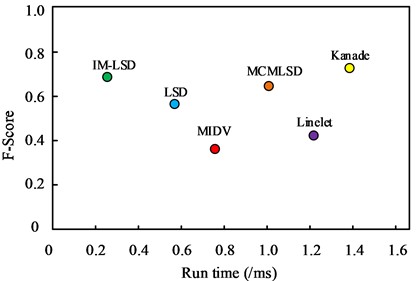
In Fig. 11, the abscissa represents the running time of different segment detection algorithms on Tu-pxiang data set, and the ordinate represents the F- value of different segment detection algorithms. IM-LSD algorithm runs faster at 0.25 s and has a higher F-value of about 0.7. This is because IM-LSD algorithm scales the original image when detecting line segments, which reduces the cost of computation, and thus consumes a shorter period of time compared to several other algorithms. The shorter the running time and the faster the speed of the algorithm, the better the effect in practical applications and the more practical application value.
5. Conclusions
Aiming at the excessive number of line segments and easy breakage of line segments in line segment detection in image extraction, this study designed an improved LSD based on LSD algorithm. According to the findings, the accuracy of LSD in image extraction of IM-LSD algorithm proposed in this study reaches 92.65 %, which is 20.06 % higher than Kanade algorithm and 55.38 % higher than Linelet algorithm. The accuracy of IM-LSD algorithm is 94.12 % and 86.56 % in book and document target images respectively. The number of lines detected by IM-LSD algorithm is the least, the number of lines extracted from card images, book images and document images are around 65, 106 and 152 respectively. the detection speed of IM-LSD algorithm is significantly lower than other algorithms, the line detection speed is around 0.2 s, and the line detection speed is around 0.5 s. In the card images, the line detection speed is around 0.5 s. in the document images, the line detection speed is around 0.5 s. The line detection speed is about 0.2 s for card images, about 0.3 s for book images, and about 0.4 s for document images. In the mixed class rectangular target detection experiments, the IM-LSD algorithm has the highest detection accuracy of 94.50 % and the lowest average processing time of 0.2 s. The IM-LSD algorithm runs faster at 0.25 s and has a higher F-value. It shows that the improved LSD based on the LSD algorithm designed in this study effectively solves the problems of excessive number of interfering line segments, fuzzy rectangular boundaries and easy to break line segments, improves the speed of image extraction and detection, and better resists external interference. Finally, the shortcoming of this study lies in the small number of image types in the data set, and more types of images will be added in the future for further comparison and optimization. In addition, the improved LSD algorithm proposed in this study is only used for line detection, and whether it can effectively process curve line segments can be studied in the future.
References
-
M. Tong, K. Shao, X. Luo, and H. Duan, “Application of a fractional grey prediction model based on a filtering algorithm in image processing,” Mathematical Problems in Engineering, Vol. 2020, No. 11, pp. 1–18, Oct. 2020, https://doi.org/10.1155/2020/4170804
-
D. Liu, J. Shen, A. Wang, and C. Wang, “Secure real-time image protection scheme with near-duplicate detection in cloud computing,” Journal of Real-Time Image Processing, Vol. 17, No. 1, pp. 175–184, Jun. 2019, https://doi.org/10.1007/s11554-019-00887-6
-
N.-D. Hoang, “Automatic detection of asphalt pavement raveling using image texture based feature extraction and stochastic gradient descent logistic regression,” Automation in Construction, Vol. 105, No. 9, p. 102843, Sep. 2019, https://doi.org/10.1016/j.autcon.2019.102843
-
Y. Liu, Z. Xie, and H. Liu, “LB-LSD: A length-based line segment detector for real-time applications,” Pattern Recognition Letters, Vol. 128, No. 12, pp. 247–254, Dec. 2019, https://doi.org/10.1016/j.patrec.2019.09.011
-
D. Wang, Q. Liu, and Q. Yin, “Fast line segment detection and large scene airport detection for PolSAR,” Remote Sensing, Vol. 14, No. 22, p. 5842, 2022.
-
Y. Fang, B. Luo, T. Zhao, D. He, B. Jiang, and Q. Liu, “ST‐SIGMA: Spatio‐temporal semantics and interaction graph aggregation for multi‐agent perception and trajectory forecasting,” CAAI Transactions on Intelligence Technology, Vol. 7, No. 4, pp. 744–757, Nov. 2022, https://doi.org/10.1049/cit2.12145
-
S. Hua, K. Han, Z. Xu, M. Xu, H. Ye, and C. Q. Zhou, “Image processing technology based on internet of things in intelligent pig breeding,” Mathematical Problems in Engineering, Vol. 2021, No. 12, pp. 1–9, Mar. 2021, https://doi.org/10.1155/2021/5583355
-
Z. Jiang, F. Zhang, and L. Sun, “Sports action recognition based on image processing technology and analysis of the development of sports industry pattern,” Scientific Programming, Vol. 2021, No. 14, pp. 1–11, Dec. 2021, https://doi.org/10.1155/2021/4815097
-
J. Wang, “Application of wavelet transform image processing technology in financial stock analysis,” Journal of Intelligent and Fuzzy Systems, Vol. 40, No. 2, pp. 2017–2027, Feb. 2021, https://doi.org/10.3233/jifs-189204
-
J. Dai, G. U. Yue, G. Jin, and L. Zhu, “Line segment optimization algorithm for high resolution optical remote sensing image based on geometric and texture constraints,” Acta Geodaetica et Cartographica Sinica, Vol. 3, No. 3, pp. 115–127, 2020, https://doi.org/10.11947/j.jggs.2020.0311
-
K.-S. Son, H.-S. Jeon, J.-H. Park, and J. W. Park, “Vibration displacement measurement technology for cylindrical structures using camera images,” Nuclear Engineering and Technology, Vol. 47, No. 4, pp. 488–499, Jun. 2015, https://doi.org/10.1016/j.net.2015.01.011
-
D. Zhang, A. Polamarasetty, M. O. Shahid, B. Krishnaswamy, and C. Ma, “Passive mechanical vibration processor for wireless vibration sensing,” arXiv:2305.10687, Jan. 2023, https://doi.org/10.48550/arxiv.2305.10687
-
L. Feng, J. Wang, and C. Ding, “Image edge detection algorithm based on fuzzy radial basis neural network,” Advances in Mathematical Physics, Vol. 2021, No. 4, pp. 1–9, Dec. 2021, https://doi.org/10.1155/2021/4405657
-
Z. Zhang and X. Ma, “Lane recognition algorithm using the hough transform based on complicated conditions,” Journal of Computer and Communications, Vol. 7, No. 11, pp. 65–75, Jan. 2019, https://doi.org/10.4236/jcc.2019.711005
-
R. Singh and V. Priye, “Ultrahigh-sensitivity label-free optical biosensor based on a silicon nanowire rectangular optical waveguide for lung cancer detection,” Journal of the Optical Society of America B, Vol. 36, No. 9, pp. 2402–2406, Sep. 2019, https://doi.org/10.1364/josab.36.002402
-
H. Xu, S. Li, Y. Ji, R. Cao, and M. Zhang, “Dynamic obstacle detection based on panoramic vision in the moving state of agricultural machineries,” Computers and Electronics in Agriculture, Vol. 184, No. 5, p. 106104, May 2021, https://doi.org/10.1016/j.compag.2021.106104
-
C. Liu, R. Abergel, Y. Gousseau, and F. Tupin, “LSDSAR, a Markovian a contrario framework for line segment detection in SAR images,” Pattern Recognition, Vol. 98, No. 1, p. 107034, Feb. 2020, https://doi.org/10.1016/j.patcog.2019.107034
-
Y. Park, “Discrete Hough transform using line segment representation for line detection,” Optical Engineering, Vol. 50, No. 8, p. 087004, Aug. 2011, https://doi.org/10.1117/1.3607414
-
C. Cuevas, D. Quilón, and N. García, “Automatic soccer field of play registration,” Pattern Recognition, Vol. 103, No. 2, p. 107278, Jul. 2020, https://doi.org/10.1016/j.patcog.2020.107278
-
Q. Zheng, X. Tian, N. Jiang, and M. Yang, “Layer-wise learning based stochastic gradient descent method for the optimization of deep convolutional neural network,” Journal of Intelligent and Fuzzy Systems, Vol. 37, No. 4, pp. 5641–5654, Oct. 2019, https://doi.org/10.3233/jifs-190861
-
L. Fei and W. Key, “Design of optical imaging system for RGB three-channel diffraction telescope,” Journal of Applied Optics, Vol. 40, No. 3, pp. 369–372, Jan. 2019, https://doi.org/10.5768/jao201940.0301002
-
X. Song, S. Wu, G. Li, and L. Lin, “A calibration set selection method fusing multi-component based on Euclidean distance in spectral analysis of complex solution,” Infrared Physics and Technology, Vol. 123, No. 7, p. 104116, Jun. 2022, https://doi.org/10.1016/j.infrared.2022.104116
-
D. V. Tropin, A. M. Ershov, D. P. Nikolaev, and V. V. Arlazarov, “Advanced Hough-based method for on-device document localization,” Computer Optics, Vol. 45, No. 5, pp. 702–712, Oct. 2021, https://doi.org/10.18287/2412-6179-co-895
-
Y. Xu et al., “High spectral stability and quantitative accuracy of LIBS by optimization of a combined atomic and ionic line algorithm,” Journal of Analytical Atomic Spectrometry, Vol. 37, No. 2, pp. 351–357, Feb. 2022, https://doi.org/10.1039/d1ja00391g
-
J. H. Elder, E. J. Almazàn, Y. Qian, and R. Tal, “MCMLSD: A probabilistic algorithm and evaluation framework for line segment detection,” Computer Vision and Pattern Recognition, Vol. 2020, No. 1, pp. 2031–2039, Jan. 2020, https://doi.org/10.48550/arxiv.2001.01788
About this article

This research was supported by the Science and Technology Key Project of Henan Province (No. 222102210128, 232102321072), Science and Technology project of Nanyang (No. KJGG036).
The datasets generated during and/or analyzed during the current study are available from the corresponding author on reasonable request.
Yuemei Ren: conceptualization, data curation, writing-original draft preparation, supervision; Lei Li: writing-review and editing, methodology.
The authors declare that they have no conflict of interest.
