Abstract
Presently, the tunnel construction of China is changing from “mainly construction” to “equal emphasis on construction and maintenance”. In this context, tunnel structure inspection, monitoring, and maintenance technologies have developed rapidly. However, the effective use and in-depth mining of massive data has always been the most difficult point in this field. Based on deep learning technology, this paper carries out in-depth mining of the multi-source data of the tunnel structure, so that the convergence and deformation of the section during the operation of the shield tunnel is predicted in a short time. Taking the Nanjing Yangtze River shield tunnel project as an example, the indicators are screened based on the fluctuations of the pair wise correlation coefficients of all monitoring indicators. And based on the Keras (a high-level neural network API) framework, a short-term prediction model of the convergent deformation of the shield tube section at this location is established. The results show that the model successfully predicts the convergence of the tunnel section in the next 10 days, and the prediction accuracy reaches 93.6 %. The short-term prediction of key sections and the near warning sections is realized, so as to prevent it in advance.
1. Introduction
Presently, the tunnel construction of China is changing from “mainly construction” to “equal emphasis on construction and maintenance” [1]. In order to meet the management of massive data such as structural information, inspection information, monitoring information, and maintenance information of long and large tunnels, many applications of informatization and intelligent technology in tunnel structural inspection, monitoring, and maintenance have emerged, for example, based on data-driven tunnel structure safety evaluation, risk early warning, and more [2].
Mehdi and Bahram comparatively analyzed the artificial neural network (ANN), multiple linear regression (MLR), multiple nonlinear regression (MNR), support vector regression (SVR), Gaussian process regression (GPR), regression tree and tree set (ET) on the prediction of tunnel convergence speed [3]. SVR is considered to be a better choice, but the accuracy of prediction needs to be improved. Mohammadi et al. relied on the Niayesh subway tunnel in Tehran to compare and analyze the effects of artificial neural networks and multi-layer perceptrons (MLP) in the prediction of tunnel settlement [4]. It was believed that the optimized MLP model showed a relatively high accuracy, but the prediction model under the influence of multiple variables has not been studied. Ghorbani et al. established an artificial neural network prediction model and used this model to successfully predict the support pressure of a circular tunnel in elastoplastic strain softening rock mass [5]. But it did not introduce the principle of selecting input variables in the model. Ghiasi established a numerical simulation calculation model and a multi-layer perceptron (MLP) prediction model [6]. It predicted the surface settlement during a single circular tunnel excavation process, and believed that the prediction result was reasonable.
Based on the Nanjing Yangtze River shield tunnel, this paper has carried out a large amount of data preprocessing and related analysis. Based on the Keras deep learning framework, a prediction model for the convergence and deformation of the shield tunnel structure section is established and trained, so as to realize the short-term prediction of the convergent deformation of the target section. Through the model prediction of key indicators for the sections that focus on the sections or are close to the risk warning, grasping and foreseeing the risk changes of the target section of the tunnel can prevent problems in advance.
2. Basic structure and working principle of Keras framework
Keras is an advanced neural network framework based on Python written with TensorFlow, Theano, and CNTK as the backend engine. It was proposed by Google engineer Francois Chollet in 2015. Keras has developed rapidly since its birth, and has become one of the most mainstream deep learning frameworks in the world, like TensorFlow and Pytorch.
In terms of code structure, Keras is written by object-oriented method, which is completely modular and extensible [7]. Its operation mechanism and description documents take user experience and difficulty into account and try to simplify the implementation difficulty of complex algorithms. Keras supports the mainstream algorithms in the field of modern artificial intelligence, including neural networks with feedforward structure and recursive structure, and can also participate in the construction of statistical learning models through encapsulation. In terms of development environment, Keras can be transformed into components under TensorFlow, Microsoft CNTK and other systems according to background settings.
Since the health monitoring and maintenance system of Nanjing Yangtze River tunnel is a huge and logically complex operating system, and the prediction model proposed in this paper has been embedded in the system and is being debugged, it is necessary to continuously carry out debugging work such as model improvement. In this process, the modular characteristics of Keras framework can significantly improve the efficiency of model debugging. Therefore, this paper selects Keras frame to study the prediction model of section convergence displacement of shield tunnel.
3. Application of calculation example
3.1. Nanjing Yangtze River tunnel monitoring plan
The north line of the Nanjing Yangtze Tunnel passes through argillaceous and silty clay, silt sand, gravel sand, cobbles and pebbles, and siltstone. The shield tunnel structure is a double-tube and double-layer scheme and it is assembled with staggered joints. Each ring tube segment is ten pieces, with an outer diameter of 14.5 m, a thickness of 0.6 m and a width of 2 m. Fig. 1 shows the layout of the Nanjing Yangtze River Tunnel section monitoring, including 3 earth pressure meters, 3 water pressure meters, 4 transverse joint gauges, 4 longitudinal joint gauges, 1 laser convergence gauge, and 3 inclination angle gauges, and 2 thermometers.
3.2. Data preparation
This article takes the monitoring data of Nanjing Yangtze River Tunnel from September to November 2016 as an example. A total of 19 sets of monitoring data with 7 monitoring indicators of section S04 are selected as samples. Monitoring indicators include earth pressure, water pressure, transverse joint gauge, longitudinal joint gauge, inclinometer, section convergence and temperature. The input and output variables are selected as shown in Table 1. The time history curve of the monitoring data is shown in Figs. 2-8. The monitoring data of water pressure has obvious deviations from the other two groups, and the change trend and fluctuation law are obviously different, thus the data group is excluded. and are almost completely missing, and these two sets of data are excluded. The monitoring data of segment tilt has 4 monitoring points missing, and the missing values can be filled by Lagrange interpolation.
Fig. 1Section monitoring plan of Nanjing Yangtze River Tunnel
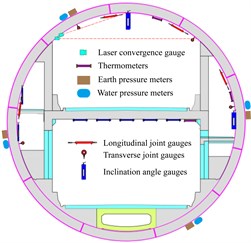
Fig. 2Water pressure monitoring data
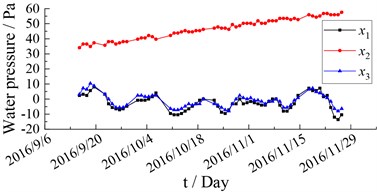
Fig. 3Earth pressure monitoring data
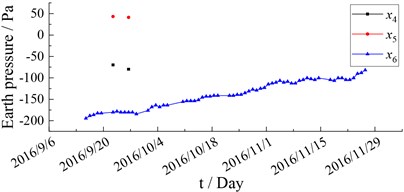
Fig. 4Monitoring data of transverse joint opening
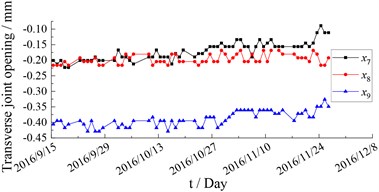
Fig. 5Monitoring data of longitudinal joint opening
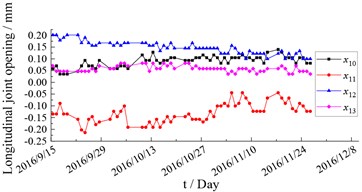
Fig. 6Inclinometer monitoring data
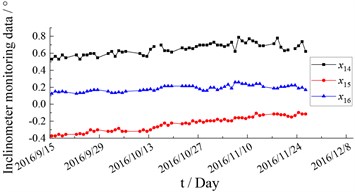
Fig. 7Temperature monitoring data
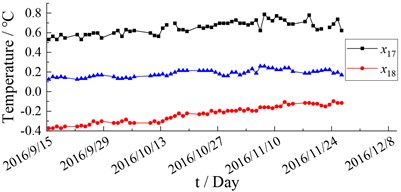
Fig. 8Monitoring data of section convergence
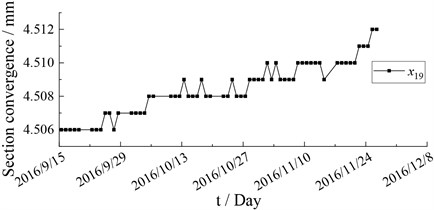
Table 1Model input and output variables
Variable attributes | Variable Type | Variable No. | Variables | Number of components | Variable unit |
Input variables | Load variables | - | Earth pressure | 3 | Pa |
- | Water pressure | 3 | Pa | ||
Structure variables | - | Transverse joint gauge | 4 | mm | |
- | Longitudinal joint gauge | 3 | mm | ||
- | Inclinometer | 3 | ° | ||
Environment variables | - | Temperature | 2 | ℃ | |
Out variables | Structure variables | Section Convergence | 1 | mm |
3.3. Correlation analysis
Fig. 9 shows the thermal map of the correlation between section convergence and 7 strong correlation indicators (the darker or the lighter the color, the higher the correlation). Table 3 shows all the indicators whose correlation coefficient with the section convergence is above 0.7.
Fig. 9Thermodynamic diagram of section convergence and 7 strong correlation indexes
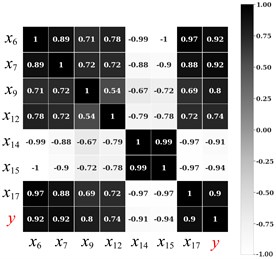
In order to ensure the model training effect and application performance, the selection of sample data is the key. This paper not only selects the data with the highest absolute correlation, but also the data with higher correlation among other indicators. Selecting data with high absolute correlation can ensure the training effect of the model. Whereas selecting multiple types of index data on the basis of considering the correlation can improve the overall stability of the model when it is applied.
Generally, the sample data used for model training contains 7 sets of data, i.e. earth pressure , transverse joint opening , transverse joint opening , longitudinal joint opening , temperature and , inclinometer , are shown in Table 2.
Table 2Statistical table of correlation between section convergence and 7 strong correlation indicators
Item | and | |||||
Correlation | Positive correlation | Positive correlation | Positive correlation | Negative correlation | Negative correlation | Positive correlation |
Relativity | 0.92 | 0.92 | 0.74 | –0.81 | 0.91/0.94 | 0.90 |
3.4. Model building and training
1) Data normalization. Data normalization is a method of data transformation in statistics. The data of different dimensions can be at the same numerical magnitude, thereby speeding up the convergence speed of deep learning algorithms and improving the accuracy of loop iteration solutions. This paper uses the MinMaxScaler() function in the scikit-learn library to normalize the data, and convert all the data to values in [0, 1].
2) Build a deep learning model based on Keras. This article uses the Sequential model in Keras. The parameters that can be determined include: Input Dense = 7, Output Dense = 1, mean square error, r2_score used as the accuracy evaluation function. In addition, the model training effect is also affected by many key functions and parameters, such as weight initialization function, activation function and its parameters, learning rate function and error function. To solve the over fitting problem in the process of model training, dropout rate technology and early stopping function are used. Among them, dropout rate can randomly remove several neurons during training. In essence, it generates and trains multiple grids, and then uses multiple networks to predict, so as to reduce the risk of over fitting. The early stopping function can stop the model training early when there is no room for improvement, so as to avoid the over fitting problem to a certain extent. In this paper, the control variable method is used to optimize the selection of various optional parameters. The comparison and selection process and results of each parameter are shown in Table 3.
Table 3Comparison and selection process and results of key functions and parameters of the model
Item | Comparison item | Average model accuracy of 10 training sessions |
Number of hidden layers | Hidden Dense = 1 | 0.895 |
Hidden Dense = 2 | 0.912 | |
Hidden Dense = 3(√) | 0.937 | |
Hidden Dense = 4 | 0.933 | |
Hidden Dense = 5 | 0.916 | |
Weight initialization function | glorot_uniform(√) | 0.938 |
lecun_normal | 0.936 | |
lecun_uniform | 0.922 | |
glorot_normal | 0.914 | |
he_normal | 0.906 | |
he_uniform | 0.927 | |
Activation function | LReLU(√) | 0.955 |
ReLU | 0.951 | |
tanh | 0.898 | |
PReLU | 0.855 | |
Earlystopping function | Patience = 500 | 0.912 |
Patience = 1000(√) | 0.921 | |
Patience = 1500 | 0.903 | |
Patience = 2000 | 0.901 | |
Patience = 2500 | 0.886 | |
Dropout rate | P_keep = 0.1 | 0.915 |
P_keep = 0.2(√) | 0.927 | |
P_keep = 0.3 | 0.910 | |
P_keep = 0.4 | 0.889 | |
P_keep = 0.5 | 0.879 | |
Epoch_size | 10 | 0.887 |
12 | 0.891 | |
14 | 0.902 | |
16(√) | 0.919 | |
18 | 0.899 | |
20 | 0.891 | |
Learning rate function and parameters | Adam () | |
4. Model training and prediction effect evaluation
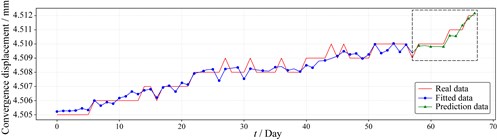
That is, according to the monitoring data of the previous 58 days, the mathematical relationship model of the section convergence and 7 strong correlation indexes is learned, and the model is used to predict the tunnel section convergence y in the next 10 days. After 17,000 loop iterations of this model, it is calculated that the fitting accuracy of this model is 0.959, and the prediction accuracy is 0.936. The model error and accuracy analysis is shown in Table 4. The model fitting and prediction results are plotted as shown in Fig. 10. The red is the real data, the blue is the fitted data after training, and the green is the predicted data using the model.
Table 4Model error and accuracy analysis
Training times | Training duration | Mean square error | Fitting accuracy | Prediction accuracy |
17000 | 65 s | 0.000772 | 95.9 % | 93.6 % |
Fig. 10Fitting and prediction effect of data after inverse normalization
5. Conclusions
This article takes the monitoring data of Nanjing Yangtze River Tunnel from September to November 2016 as an example. The research shows that:
1) The fitting accuracy of the model to the selected multivariate monitoring data of the first 58 days reaches 95.9 %, and successfully predicts the convergence of the tunnel section in the next 10 days. Its prediction accuracy reaches 93.6 %, and the model prediction effect is good.
2) The prediction object of the deep learning model in this paper is the amount of section convergence. In fact, this method can be used to predict any index in the monitoring data, and multiple deep learning prediction models can be established. Based on this, many engineering applications can be carried out, such as sensor failure alarm function: If it is found that the correlation between a certain index and other indexes is all reduced, it is basically determined that the sensor corresponding to the index is malfunctioning.
3) The model has fast running speed, good prediction effect, and all functions can be embedded in the tunnel health monitoring platform or tunnel information management system, so as to realize the real-time prediction of key sections and nearby warning sections, and prevent problems in advance.
References
-
W. B. Ma and J. F. Chai, “Development status of disease detection, monitoring, evaluation and treatment technology of railway,” (in Chinese), Tunnels in Operation. Tunnel Construction, Vol. 39, No. 10, pp. 1553–1562, 2019.
-
T. Li, W. G. Qiu, and Y. Liu, “Development and application of a data-driven tunnel geological information fine management system,” Tunnel Construction, Vol. 39, No. 1, pp. 68–74, 2019.
-
M. Torabi-Kaveh and B. Sarshari, “Predicting convergence rate of Namaklan Twin Tunnels using machine learning methods,” Arabian Journal for Science and Engineering, Vol. 45, No. 5, pp. 3761–3780, May 2020, https://doi.org/10.1007/s13369-019-04239-1
-
S. D. Mohammadi, F. Naseri, and S. Alipoor, “Development of artificial neural networks and multiple regression models for the Natm tunnelling-induced settlement in Niayesh Subway Tunnel, Tehran,” Bulletin of Engineering Geology and the Environment, Vol. 74, No. 3, pp. 827–843, 2015, https://doi.org/10.1007/s10064-014-0660-2
-
A. Ghorbani, H. Hasanzadehshooiili, and Sadowski, “Neural prediction of tunnels’ support pressure in elasto-plastic, strain-softening rock mass,” Applied Sciences, Vol. 8, No. 5, p. 841, May 2018, https://doi.org/10.3390/app8050841
-
V. Ghiasi and M. Koushki, “Numerical and artificial neural network analyses of ground surface settlement of tunnel in saturated soil,” SN Applied Sciences, Vol. 2, No. 5, p. 939, May 2020, https://doi.org/10.1007/s42452-020-2742-z
-
N. K. Manaswi, “Understanding and Working with Keras,” in Deep Learning with Applications Using Python, Berkeley, CA: APress, 2018, pp. 31–43, https://doi.org/10.1007/978-1-4842-3516-4_
About this article

The work is supported by the Natural Science Foundation of Zhejiang (No. LGF19E080005) and Science and Technology Project of Zhejiang Provincial Department of Transportation (No. 2020005).
