Abstract
Squeak and Rattle problems seriously affect the quality of the vehicles. In the adjustment stage of the automobile development process, engineers mainly rely on subjective evaluation to diagnose squeak and rattle noises, which is prone to misjudgment, missed judgment and time-consuming problems. There are gaps in relevant objective evaluation methods. This article proposed that speaker identification is used to identify squeak and rattle noises from the audio recorded in the test, to achieve objective and accurate results. In this paper, four kinds of squeak and rattle noise audios are used as samples, Mel Frequency Cepstrum Coefficient is extracted as feature vector to construct target Gaussian mixture models (GMM). The expectation, variance and correlation coefficient of the Gaussian mixture model can be calculated to describe the difference of multiple squeak and rattle noises. Using samples to judge accuracy rate, the results indicated that the acceptance accuracy rate reaches 100 %, and the rejection accuracy rate reaches more than 95 %.
1. Introduction
Squeak and Rattle (S&R) is mainly divided into two categories: Rattle and Squeak. The reason for the abnormal knocking noise is that the gap between adjacent parts is insufficient, which is smaller than the normal relative displacement response under environmental excitation, so that the contact generates impulse force. The reason for the abnormal friction noise is that the parts in contact with each other produce tangential relative displacement under environmental excitation. Abnormal percussive sound and frictional S&R can be regarded as a secondary excitation under the primary excitation of the environment, and the side effects of S&R form high-frequency vibration to produce sound, and then it is transmitted through the surrounding related structures.
The S&R utterance is analogous to the speaker’s speaking. Both are stimulated at the source of the sound, and the sound is transmitted through other structures. The method of speaker identification is to extract features from the vocal tract of different speakers, which are used to characterize the differences of different speakers, without looking for the source of the sound, which is the feature of the vocal cords. There are often similar sound transmission structures around the same kind of S&R, so you can consider using speaker identification methods for S&R recognition.
Mel Frequency Cepstrum Coefficient (MFCC), as an effective signal feature, has excellent characterization capabilities, and is widely used in the field of natural speech processing [1-5]. The Gaussian Mixture Mode (GMM) is a probability density function obtained by the weighted average of multiple high-dimensional Gaussian distributions [6]. Get the GMM corresponding to the S&R. In this article, for typical car knocking abnormal noise signals, including seat headrest guide rod knocking S&R, seat belt retractor knocking S&R, seat leather friction S&R and door panel friction S&R, try to use Speaker recognition model including MFCC and GMM, based on likelihood function for S&R recognition.
2. Squeak and Rattle sound audio feature extraction
The physical meaning of MFCC in the field of natural speech processing is the spectral envelope information of the vocal tract [7], which contains the unique characteristics of the target speaker. First, extract the frequency domain information of the sound signal and transform it into the Mel domain that is consistent with human hearing. Then take the logarithm of the energy value of the corresponding frequency band of the filter, perform Discrete Cosine Transform (DCT), and output a preset number of coefficients (i.e., the MFCC dimension). However, the purpose of calculating MFCC is to obtain the envelope information of the spectrum, that is, lower frequency information, so the number of DCT output coefficients should not be too large. Finally, the envelope information of the frequency spectrum is the important information of the sound transmission structure.
The spectral energy of each frame of signal after passing through the Mel filter is the sum of the product of the spectral energy of the signal and the spectral response and the spectral response of the Mel triangle filter:
The obtained represents the total energy of the -th frame signal in the -th frequency band of the Mel domain, which elements are used to represent the energy spectrum information of the signal in the Mel domain.
The formula for DCT is as follows:
The DCT calculation is equivalent to the real Cepstrum calculation, and the outputs are used to describe the spectral envelope, which is the characteristics of the sound transmission structure.
The common MFCC dimension is 5~15 [8], consider and add the logarithmic energy of the corresponding frame on the basis of the original MFCC, which is convenient for clustering in the subsequent algorithm, and adds the first-order difference and the second-order difference to reflect its dynamic characteristics form the final dimensional feature vector to improve the recognition performance.
3. S&R identify
For the problem of using sample sets to construct an unknown probability distribution, GMM [9] is a common method to solve the problem. GMM is essentially a multi-dimensional probability density function, which is a weighted combination of multiple multi-dimensional Gaussian distribution probability density functions. After determining the initial GMM, after Expectation-Maximization (EM) algorithm training, the GMM parameter set that maximizes the likelihood function of the sample set can be obtained.
The probability density function of M-order GMM is as follows:
Assuming that the sample set is the likelihood function of GMM [10, 11] with respect to the parameter set can be expressed as:
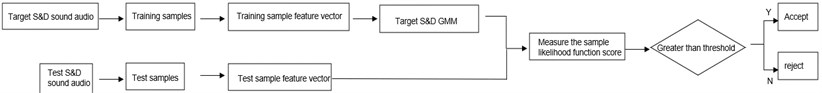
In the recognition stage, the feature vector set of the test sound signal is, and the corresponding likelihood function score is calculated on the target GMM model. The formula is as follows:
The calculated likelihood function score is compared with the preset likelihood threshold. If it is greater than the threshold, the test sound signal is accepted as the target sound signal, otherwise the signal will be rejected.
The GMM recognition flow chart of S&R in this article is shown in Fig. 1.
Fig. 1Recognition of vehicle rattle
3.1. Test data collection
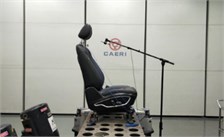
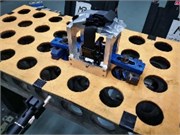
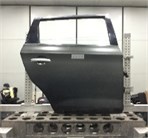
In this paper, four kinds of S&R are collected, namely the knocking sound of the seat headrest guide rod, the knocking sound of the seat belt retractor, the friction sound of the seat leather and the friction sound of the door panel, the vibration test is shown in Fig. 2 [12]. The experimental object is fixed on the vibration table, and the electromagnetic exciter is used for excitation. The load is the road surface excitation spectrum collected on the actual vehicle, and the experimental environment is a semi-anechoic environment. B&K equipment is used to record audio data, the sampling rate is 48 kHz, each sampling time is 5 s, and the audio is saved in wav format. Because there is a certain amount of background noise when the test bench is working, high-pass filtering is used for preprocessing.
Fig. 2Vibration experiment
3.2. The influence of the number of Mel triangular filters and the number of DCT output coefficients on the recognition rate
The sample is the percussion sound of the seat headrest guide rod, the number of Mel triangle filters are 50, 60, 70, 80, the number of DCT output coefficients are 10, 11, 12, 13, and the GMM order is 18. The results obtained are shown in Table 1, comparing the recognition results in Table 1 horizontally, it can be seen that when the number of DCT output coefficients increases, the recognition rate increases; but when the number of output coefficients reaches 13, the recognition rate decreases. When comparing the recognition results in Table 1 vertically, when the number of Mel triangle filters increases, the recognition rate increases accordingly; but when the number of filters reaches 80, the recognition rate decreases. When the number of DCT output coefficients is 12 and the number of triangular bandpass filters is 70, the recognition rate reaches the highest, which is 90 %; compared with the 24 filters generally used in speaker identification [13, 14], different It requires more Mel triangle bandpass filters to include the details of the spectrum.
Table 1Influence of different Mel filters and DCT coefficients on recognition rate
Number of DCT output coefficients | 10 | 11 | 12 | 13 |
50 filters | 48 % | 54 % | 62 % | 60 % |
60 filters | 52 % | 60 % | 68 % | 64 % |
70 filters | 70 % | 78 % | 90 % | 82 % |
80 filters | 60 % | 70 % | 72 % | 70 % |
3.3. The influence of eigenvector dimension and GMM order on recognition rate
This section studies the influence of different eigenvector dimensions and GMM order on the recognition rate. The sample is the percussion sound of the seat headrest guide rod, the number of Mel triangle filters is 70, and the eigenvector dimensions are 13 (12 DCT output coefficients and frame energy), 26 (13-dimensional eigenvector and first-order difference), 39 (13-dimensional feature vector, first-order difference and second-order difference), the GMM orders are 18, 27, 36, and 45, respectively. The results obtained are shown in Table 2.
It can be seen from the results in Table 2 that when the feature vector dimension is 39 and the GMM order is 36, the recognition rate reaches the maximum 100 %. Therefore, 70 Mel filters, 12 DCT output coefficients, 39-dimensional feature vectors and 36-order GMM are selected for subsequent experiments.
Table 2Influence of different feature vector dimensions and GMM orders on recognition rate
Eigenvector dimension | 13 | 26 | 39 |
18th order GMM | 94 % | 94 % | 96 % |
27th order GMM | 96 % | 98 % | 98 % |
36th order GMM | 98 % | 98 % | 100 % |
45th order GMM | 96 % | 96 % | 98 % |
3.4. S&R feature description
For different percussive sounds, different percussive sounds GMMs need to be constructed. Reflect the characteristics of abnormal percussion to a certain extent, and there are differences between the mathematical characteristics of different percussive GMMs.
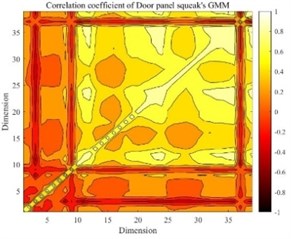
Figs. 3-8 shows the mathematical characteristics of the S&R GMM of the seat headrest guide rod.
It can be seen that there are differences in the mathematical characteristics of the four different GMMs. The low-dimensional performance of expectations, variance and correlation coefficients is obvious in Figs. 3-8. The correlation coefficient diagrams in Figs. 5 to 8 show that there is a certain correlation between the dimensions, with a positive correlation as a whole, and a negative correlation between some dimensions. The difference between the four kinds of abnormal noise GMM is manifested as the difference in likelihood function in the recognition process, which affects the recognition result. It should be noted that GMM is weighted by multiple high-dimensional joint normal distributions, so GMM is a high-dimensional multimodal probability density function. The expectation belongs to the first-order feature of the probability density function, and the variance and correlation coefficient belong to the second-order feature of the probability density function, and cannot fully characterize GMM.
3.5. S&R recognition result
The test audio is the S&R of the seat headrest guide rod knocking, the S&R of the seat belt retractor, the S&R of the seat leather friction, the S&R of the door panel friction and other audio, respectively, under the 4 kinds of S&R GMM Calculate the likelihood function, and count the acceptance and rejection accuracy rates. The relevant results are shown in Table 3.
Fig. 3GMM’s expectation
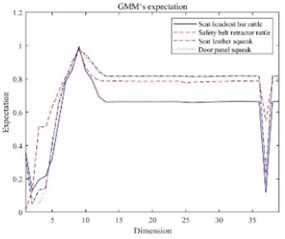
Fig. 4GMM’s variance
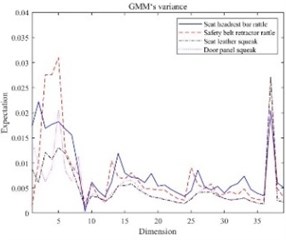
Fig. 5The correlation coefficient of seat headrest rod rattle’s GMM
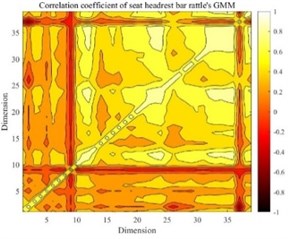
Fig. 6The correlation coefficient of safety seat belt retractor rattle’s GMM
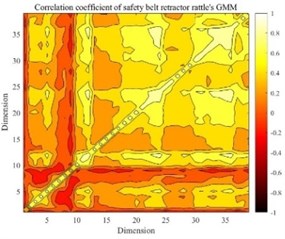
Fig. 7The correlation coefficient of seat leather squeak’s GMM
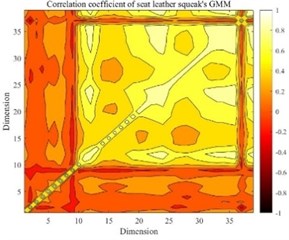
Fig. 8The correlation coefficient of door panel squeak’s GMM
It can be seen from Table 3 that when the test is the audio with the same S&R as the target GMM, the acceptance accuracy rate reaches 100 %, and when the test is the audio with the S&R different from the target GMM, the rejection accuracy rate of the 4 kinds of S&R GMM reaches above 95. The experimental research results show that the speaker recognition algorithm can be applied to the field of S&R recognition, and the accuracy rate of acceptance and rejection has a high level.
It can be seen from Table 3 that when the test is the audio with the same S&R as the target GMM, the acceptance accuracy rate reaches 100 %, and when the test is the audio with the S&R different from the target GMM, the rejection accuracy rate of the 4 kinds of S&R GMM reaches above 95. The experimental research results show that the speaker recognition algorithm can be applied to the field of S&R recognition, and the accuracy rate of acceptance and rejection has a high level.
Table 3Recognition results of squeak and rattle
Acceptance accuracy rate of the same S&R | Different S&R noise rejection accuracy rate | Other audio rejection accuracy rate | |
Rattle noise of seat head restraint guide rod | 100 % | 100 % | 100 % |
Knocking noise of seat belt retractor | 100 % | 100 % | 100 % |
Squeak of seat leather | 100 % | 95 % | 96 % |
Squeak of l door panel | 100 % | 97 % | 100 % |
4. Conclusions
This article attempts to use the speaker identification method to identify abnormal noises, and extract the S&R of seat headrest guide rod knocking, seat belt retractor knocking S&R, seat leather friction S&R, and door panel friction S&R. The MFCC of the 4 sample audios is used as the feature to describe the S&R, and the GMM of each of the 4 S&Rs is constructed. Calculate the likelihood function of the test audio on the 4 kinds of S&R GMM to determine whether it belongs to the target S&R. Through the experiment, the following conclusions are obtained:
1) After studying the number of different Mel triangular filters, DCT output coefficients, eigenvector dimensions and GMM order, it is finally determined that the number of Mel triangular filters is 70, the DCT output coefficient is 12, and the eigenvector dimension is 39. The S&R recognition model with GMM order of 36.
2) According to the 4 kinds of S&R GMM, calculate the corresponding expectation, variance and correlation coefficient, the difference of the 4 kinds of S&R can be seen from the mathematical characteristics.
3) When recognizing the test audio, the 4 kinds of S&R GMM can accurately identify the same kind of S&R audio, and the rejection accuracy rate of the different S&R audio is above 95 %.
References
-
H. Mukherjee, S. M. Obaidullah, K. C. Santosh, S. Phadikar, and K. Roy, “A lazy learning-based language identification from speech using MFCC-2 features,” International Journal of Machine Learning and Cybernetics, Vol. 11, No. 1, pp. 1–14, Jan. 2020, https://doi.org/10.1007/s13042-019-00928-3
-
D. M. Nogueira, C. A. Ferreira, E. F. Gomes, and A. M. Jorge, “Classifying heart sounds using images of motifs, MFCC and temporal features,” Journal of Medical Systems, Vol. 43, No. 6, pp. 1–13, Jun. 2019, https://doi.org/10.1007/s10916-019-1286-5
-
S. S. Upadhya, A. N. Cheeran, and J. H. Nirmal, “Discriminating Parkinson diseased and healthy people using modified MFCC filter bank approach,” International Journal of Speech Technology, Vol. 22, No. 4, pp. 1021–1029, Dec. 2019, https://doi.org/10.1007/s10772-019-09647-0
-
A. Mansouri and E. Castillo-Guerra, “Multitaper MFCC and normalized multitaper phase-based features for speaker verification,” SN Applied Sciences, Vol. 1, No. 4, pp. 1–18, Apr. 2019, https://doi.org/10.1007/s42452-019-0305-y
-
S. S. Liu, J. P. Tan, and Z. K. Yi, “A window motor abnormal noise identification method based on MFCC and SVM,” (in Chinese), Journal of Vibration and Shock, Vol. 36, No. 5, pp. 102–107, 2017, https://doi.org/10.13465/j.cnki.jvs.2017.05.016
-
L. L. Bai, Z. H. Ning, F. Xue, and Y. L. Yang, “Application of hidden markov model in malicious domain name detection,” (in Chinese), Computer Engineering, Vol. 45, No. 9, pp. 161–168, 2019, https://doi.org/10.19678/j.issn.1000-3428.0051486
-
A. Antony and R. Gopikakumari, “Speaker identification based on combination of MFCC and UMRT based features,” Procedia Computer Science, Vol. 143, pp. 250–257, 2018, https://doi.org/10.1016/j.procs.2018.10.393
-
F. Chang, X. Qiao, S. Zhang, and H. D. Xu, “Method of failure prediction and evaluation based on MFCC feature extraction,” (in Chinese), Application Research of Computers, Vol. 32, No. 6, pp. 1716–1719, 2015.
-
A. A. Mallouh, Z. Qawaqneh, and B. D. Barkana, “New transformed features generated by deep bottleneck extractor and a GMM-UBM classifier for speaker age and gender classification,” Neural Computing and Applications, Vol. 30, No. 8, pp. 2581–2593, Oct. 2018, https://doi.org/10.1007/s00521-017-2848-4
-
K. Peng, V. C. M. Leung, and Q. Huang, “Clustering approach based on mini batch kmeans for intrusion detection system over big data,” IEEE Access, Vol. 6, pp. 11897–11906, 2018, https://doi.org/10.1109/access.2018.2810267
-
F. Li, K.-T. Li, K. Lu, and Z.-Y. Li, “Random noise suppression and parameter estimation for magnetic resonance sounding signal based on maximum likelihood estimation,” Journal of Applied Geophysics, Vol. 176, p. 104007, May 2020, https://doi.org/10.1016/j.jappgeo.2020.104007
-
D. A. Reynolds and R. C. Rose, “Robust text-independent speaker identification using Gaussian mixture speaker models,” IEEE Transactions on Speech and Audio Processing, Vol. 3, No. 1, pp. 72–83, 1995, https://doi.org/10.1109/89.365379
-
H. Cao, C. Xu, X. Zhao, and S. J. Wu, “The Mel-frequency cepstral coefficients in speaker recognition,” (in Chinese), Journal of Northwest University, Vol. 43, No. 2, pp. 203–208, 2013, https://doi.org/10.16152/j.cnki.xdxbzr.2013.02.004
-
H. Z. Feng and Y. F. Wang, “An i-vector speaker recognition method based on spectrogram,” (in Chinese), Journal of Chongqing University, Vol. 40, No. 5, pp. 88–94, 2017.
About this article

