Abstract
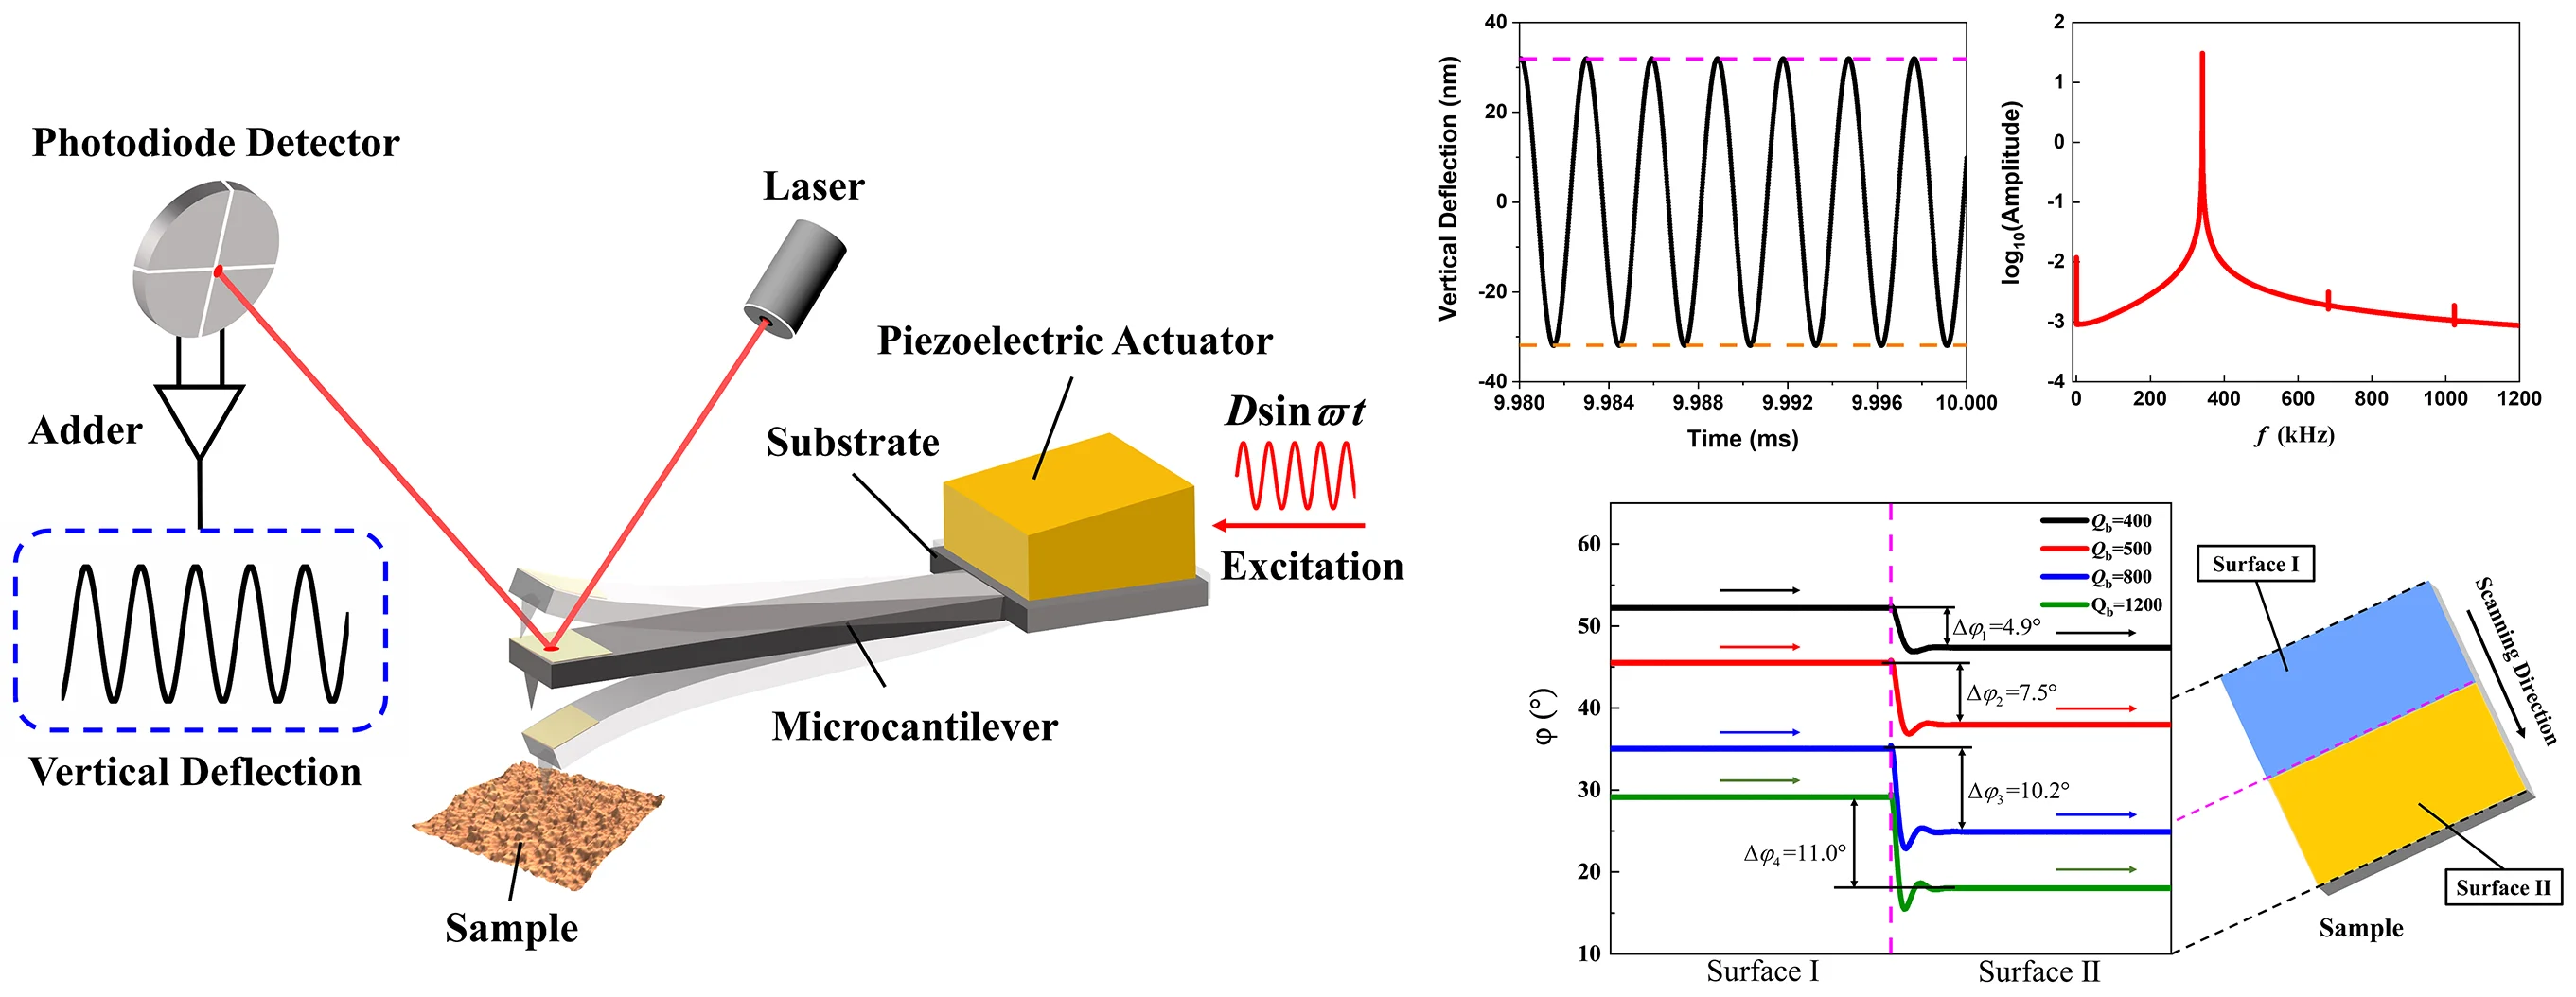
In this study, the vertical deflection responses of tapping mode atomic force microscope (TM-AFM) micro-cantilever tip are obtained by simulation and experiment. The results show that, under the blocking of the sample on one side, the steady-state response of the tip is still a sinusoidal form almost symmetrical about the equilibrium position. Furthermore, from the perspective of energy dissipation of the micro-cantilever system, the phases of two surfaces with different properties are simulated under different background dissipation. The result shows that eliminating partial background dissipation can increase the phase contrast between the two surfaces. These results are of significance for understanding the tip response and phase optimization in TM-AFM.
Highlights
- It is proved by experiment and simulation that in TM-AFM, the displacement response of the tip is almost a sine wave symmetrical about the equilibrium position.
- The phase response of the tip on the surface with different properties is obtained by numerical simulation.
- The simulation results show that reducing the background dissipation can improve the phase contrast between the components of the sample, which has hardly been mentioned by previous studies.
1. Introduction
Since the emergence of atomic force microscopes (AFM), it has become one of the most powerful tools in micro- and nanotechnology because of its excellent resolution [1, 2]. The key component of AFM is a micro-cantilever with sharp a tip. The information of the sample is recorded by transforming the interaction forces between the tip and the sample into the displacement signal of the tip [2]. Tapping mode (TM) is one of the most commonly used operation modes in atomic force microscopes. It can obtain high-resolution images of various information of samples, and can greatly reduce the wear of the tip and damages to the sample compared with contact mode [3]. Therefore, tapping mode atomic force microscope (TM-AFM) is widely used in various fields, including biomolecules, polymers, and nanostructures [4-7].
During the operation of TM-AFM, the micro-cantilever oscillates above the sample under the excitation of the piezoelectric actuator, and the tip contacts intermittently with the sample. The interactions between the tip and sample are very complex, including van der Waals interactions, short-range repulsive, adhesion, air damping, and capillary forces [8], which may make the response of the tip very complex. Payam [9] obtained the time history responses of the microcantilever with different distances between the tip and sample through simulation. Cleveland et al. [10] showed through experiments that the time history response of the tip vertical deflection was nearly sinusoidal. However, few researchers have conducted detailed analysis on the displacement response of the microcantilever tip in simulation and experiment.
In addition, phase-imaging is an important part of TM-AFM, which is very sensitive to the properties of samples. The different components and properties of the sample are distinguished by recording the difference between the tip response signal and the excitation signal. Phase-imaging has been widely used to study various heterogeneous materials and their viscoelasticity, wettability, and so on [11-13]. The phase in TM-AFM is considered to be related to the energy dissipation of the system [10, 14, 15]. At present, few studies have optimized the phase contrast in TM-AFM from the perspective of reducing the background dissipation of the micro-cantilever system.
In this paper, the time history response of the tip displacement is obtained by numerical simulation and experiment. Then, from the perspective of energy dissipation, the phases of the tip working on two surfaces with different properties under different background dissipation is simulated, and the factors affecting the phase contrast between the two surfaces are analyzed.
2. Analysis of tip response in TM-AFM
2.1. Model
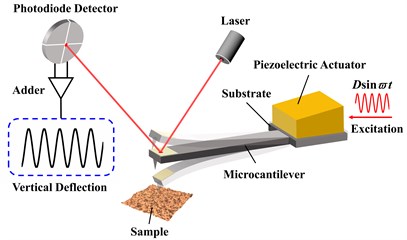
The key component of TM-AFM is a micro-cantilever with a sharp tip, which is sensitive to small forces. The piezoelectric actuator drives the substrate with sinusoidal displacement to make the micro-cantilever oscillate near its first natural frequency. The information of the sample can be obtained by detecting the change of the response at the tip. As shown in Fig. 1(a), the length of the micro-cantilever is , the width is , and the thickness is , the displacement excitation , is the excitation amplitude, is the excitation frequency. The differential equation of the micro-cantilever is as follows:
where is the absolute displacement of the micro-cantilever, is the relative displacement of the micro-cantilever relative to the substrate, and are the Young’s Modulus and section moment of inertia of the micro-cantilever respectively, is the density of the micro-cantilever, is the mass of the tip, is the equivalent damping coefficient per unit length of the micro-cantilever, represents the interaction forces between the tip and the sample, and Dirac function.
Fig. 1Micro-cantilever model of TM-AFM
a) Continuous micro-cantilever model
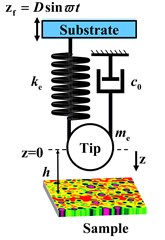
b) Simplified model of micro-cantilever
In TM-AFM, the surface information of the sample is imaged by monitoring the response at the tip of the micro-cantilever. At the same time, the micro-cantilever works near its first-order natural frequency, so the tip position and first-order mode can be used to simplify the micro-cantilever model. As shown in Fig. 1(b), the differential equation of motion of the needle tip can be written as:
where is the effective mass of the micro-cantilever, is the force constant of the micro-cantilever, is the equivalent damping coefficient representing the background dissipation, is the first-order natural angular frequency, is the effective quality factor representing the background dissipation of the micro-cantilever system. In tapping mode, the micro-cantilever has various energy dissipation paths when vibrates in air, such as air viscous dissipation, squeeze film damping, liquid bridge dissipation, and so on. This type of dissipation, which does not reflect the sample information is called background dissipation.
In AFM, the interaction between the tip and the sample is very complex, and the interaction forces are usually simplified in the response analysis. Assuming that the spherical tip interacts with the flat sample surface, van der Waals forces and DMT contact force are typically used to describe attraction and repulsion forces, respectively. The forces between the tip and sample can be expressed as follows [8, 15, 16]:
where is the distance between the tip and the sample at the equilibrium position, is Hamaker’s constant, is the radius of the tip, is the intermolecular distance, is the viscosity of the sample, and is the equivalent Young’s modulus, which can be expressed as follows:
where, , , and are the Young’s modulus and Poisson’s ratio of the tip and sample, respectively.
2.2. Analysis of time history response of the tip displacement
In order to simulate the response of the tip in TM-AFM, the parameters of the real micro cantilever are used. The effective quality factor used in this paper is obtained by processing the results of Tune experiment by half-power method. The excitation frequency is 99.9 % of the system’s natural frequency. The specific parameters are shown in Table 1.
Table 1Parameters used in simulation
Symbol | Value | Symbol | Value | ||
Effective mass (kg) | 9.13×10⁻¹² | Tip radius (nm) | 6 | ||
Force constant (N/m) | 42 | Equivalent Young’s modulus (GPa) | 10.08 | ||
Effective quality factor | 500 | Hamaker’s constant (J) | 2×10-19 | ||
Natural frequency (kHz) | 341.36 | Intermolecular distance (nm) | 0.38 | ||
Drive amplitude (nm) | 0.1 | Sample viscosity (Pa·s) | 20 | ||
Drive frequency (kHz) | 341.02 |
By substituting the parameters in Table 1 into Eq. (1-3), and solving Eq. (2) can obtain the tip response under the sample limitation. It is noted that the interaction forces between the tip and the sample in Eq. (3) are piecewise nonlinear. Therefore, Eq. (2) is a piecewise nonlinear second-order differential equation. Here, the fourth-order Range-Kutta algorithm is used to solve Eq. (2).
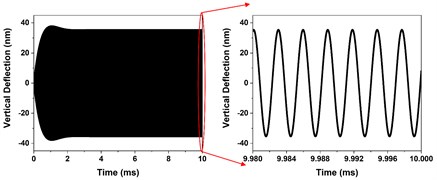
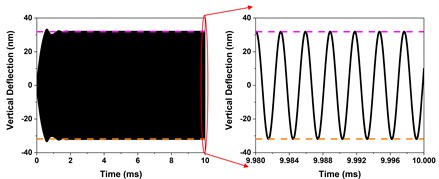
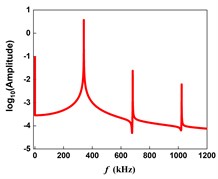
When the micro-cantilever is far away from the sample, the interaction forces between the tip and sample can be ignored, and Eq. (2) can be considered as a second-order linear differential equation. The time history response of the vertical deflection of the tip is shown in Fig. 2(a). The tip oscillates from the equilibrium position, and finally, the vertical deflection of the tip tends toward a steady state. The fast Fourier transform (FFT) of the steady-state response after 5 ms is shown in Fig. 2(b). It can be seen from the FFT diagram that there is only one frequency component which is the same as the excitation frequency. These results show that the steady-state response of the tip displacement when the micro-cantilever is far away from the sample is an absolute sine wave symmetrical about the equilibrium position. At this time, the amplitude of the steady-state response of the tip without sample constraint is .
Fig. 2Time history response and FFT of the tip vertical deflection when the micro-cantilever is far away from the sample
a) Time-history response of the tip vertical deflection
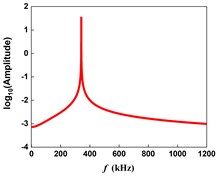
b) FFT of the steady-state response
Fig. 3Time history response and FFT of the tip vertical deflection at different initial distances between tip and sample
a) Time-history response of the tip vertical deflection when 0.9A0
b) FFT of the steady-state response when 0.9A0
c) Time-history response of the tip vertical deflection when 0.1
d) FFT of the steady-state response when 0.1
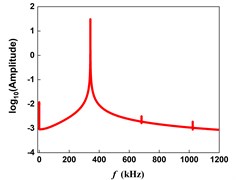
In tapping mode, the amplitude of the tip is generally 85 %-90 % of that when oscillating in air. It is assumed that the sample surface is smooth and uniform. When the initial distance between the needle tip and the sample 0.9, the time history response and FFT of the tip vertical deflection are shown in Fig. 3(a) and 3(b), respectively. The magenta dotted line represents the position of the sample, and the orange dotted line represents the symmetrical position of the sample with respect to the equilibrium position. The FFT of steady-state response is shown in Fig. 3(b), in which there are many very small frequency doubling components and a very small direct current (DC) component in addition to the fundamental frequency. This is due to the tip intermittently contacts with the sample, and the system is no longer linear, but piecewise nonlinear. Because the frequency doubling components and DC component of the response are very small compared with the fundamental frequency, the steady-state time history response of the tip displacement can be considered as a standard sinusoidal signal symmetrical about the equilibrium position.
In a more extreme case, when the initial distance between the needle tip and the sample 0.1, the time history response and FFT of the tip vertical deflection are shown in Fig. 3(c) and 3(d), respectively. As can be seen from the FFT diagram, the DC component and frequency doubling components are very obvious at this time. This is because the depth of the tip pressing into the sample is large, and the interaction time between the tip and the sample becomes longer in one cycle. In this case, although the DC component and frequency doubling components are obvious, they are very small compared with the fundamental frequency, so that the steady-state response can also be regarded as a sine wave.
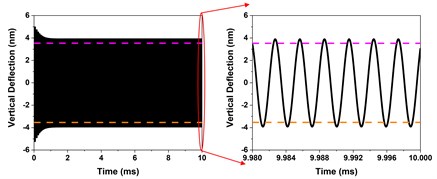
The experiment is carried out on a Bruker’s DimensionIcon AFM. The sample is a highly oriented pyrolytic graphene (HOPG). We select TappingMode to scan the sample. During operation, the vertical deflection signal of the tip is recorded by High-Speed Data Capture (HSDC) function. Fig. 4(a) shows the time history response of the tip vertical deflection when the amplitude setpoint 0.889. The magenta dotted line represents the amplitude setpoint, and the orange dotted line represents the symmetrical position of the amplitude setpoint with respect to the equilibrium position. FFT is performed on the time history response data of a certain point of the sample, as shown in Fig 4(b). The results show that the vertical deflection of the tip is a sine wave almost symmetrical about the equilibrium position. The experimental and simulation results show that the steady-state response of the needle tip in intermittent contact with the sample is a sinusoidal form symmetrical about the equilibrium position.
Fig. 4Experimental results of time history response and FFT of the tip vertical deflection when the amplitude setpoint Asp= 0.889A0
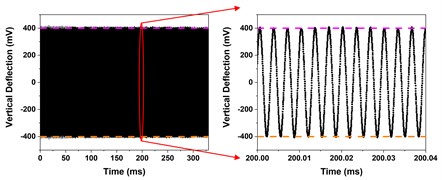
a) Time-history response of the tip vertical deflection
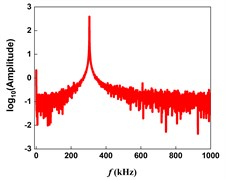
b) FFT of the steady-state response
2.3. Influence of background dissipation on phase contrast in TM-AFM
In TM-AFM, the phase image is performed by monitoring the phase shift between the tip response and excitation. The phase reflects the energy dissipation of the micro-cantilever system. During the operation of TM-AFM, there are various energy dissipation, such as air viscous dissipation, squeeze film dissipation, liquid bridge dissipation, and so on [18].
Fig. 5Simulation results of phase and phase contrast of the two-component sample under different background dissipation
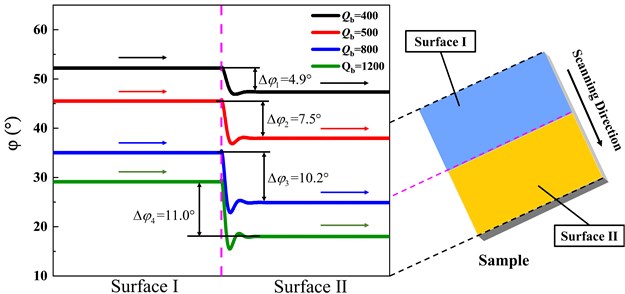
Such dissipation that cannot reflect the sample information is called background dissipation, and the background dissipation of the system can be expressed by the quality factor . When the tip works in two areas with different surface properties, the phase shifts and of the two areas are different, and the difference between the two-phase shifts is the phase contrast.
As shown in Fig. 5, the sample is composed of two components with different properties. The viscosity of surface І is 800 Pa·s, and the viscosity of surface Ⅱ is 200 Pa·s. The phase shifts of the two surfaces and the phase contrast results between the two surfaces under different background dissipation are obtained by simulation. It can be seen from the figure that the phase contrast between the two surfaces increases with the increase of the quality factor representing background dissipation. The results show that reducing the background dissipation of the system can improve the phase contrast between the components of the sample.
3. Conclusions
In this work, the displacement response of the tip in tapping mode is obtained by simulation and experiment. The results show that when one side is constrained by the sample, the steady-state time history response of the tip vertical displacement is still a sinusoidal form symmetrical about the equilibrium position, which is inconsistent with our perceptual understanding. In addition, the phase response of the tip on two surfaces with different properties under different background dissipation is simulated. The results show that reducing the background dissipation can improve the phase contrast between the components of the sample, which has hardly been mentioned by previous studies. The results of this study are of significance to understanding the response of intermittent contact in micro-nanoscale and provide a reference for the imaging of TM-AFM.
References
-
G. Binnig, C. F. Quate, and C. Gerber, “Atomic Force Microscope,” Physical Review Letters, Vol. 56, No. 9, pp. 930–933, Mar. 1986, https://doi.org/10.1103/physrevlett.56.930
-
R. Garcia, “Nanomechanical mapping of soft materials with the atomic force microscope: methods, theory and applications,” Chemical Society Reviews, Vol. 49, No. 16, pp. 5850–5884, Aug. 2020, https://doi.org/10.1039/d0cs00318b
-
W. Xiang, Y. Tian, and X. Liu, “Dynamic analysis of tapping mode atomic force microscope (AFM) for critical dimension measurement,” Precision Engineering, Vol. 64, pp. 269–279, Jul. 2020, https://doi.org/10.1016/j.precisioneng.2020.03.023
-
Y. Gan, “Atomic and subnanometer resolution in ambient conditions by atomic force microscopy,” Elsevier BV, Surface Science Reports, Mar. 2009.
-
Y. F. Dufrêne et al., “Imaging modes of atomic force microscopy for application in molecular and cell biology,” Nature Nanotechnology, Vol. 12, No. 4, pp. 295–307, Apr. 2017, https://doi.org/10.1038/nnano.2017.45
-
J. Melcher et al., “Origins of phase contrast in the atomic force microscope in liquids,” Proceedings of the National Academy of Sciences, Vol. 106, No. 33, pp. 13655–13660, Aug. 2009, https://doi.org/10.1073/pnas.0902240106
-
D. Wang and T. P. Russell, “Advances in Atomic Force Microscopy for Probing Polymer Structure and Properties,” Macromolecules, Vol. 51, No. 1, pp. 3–24, Jan. 2018, https://doi.org/10.1021/acs.macromol.7b01459
-
R. García, “Dynamic atomic force microscopy methods,” Elsevier BV, Surface Science Reports, Sep. 2002.
-
A. F. Payam, “Dynamic modeling and sensitivity analysis of dAFM in the transient and steady state motions,” Ultramicroscopy, Vol. 169, pp. 55–61, Oct. 2016, https://doi.org/10.1016/j.ultramic.2016.05.011
-
J. P. Cleveland, B. Anczykowski, A. E. Schmid, and V. B. Elings, “Energy dissipation in tapping-mode atomic force microscopy,” Applied Physics Letters, Vol. 72, No. 20, pp. 2613–2615, May 1998, https://doi.org/10.1063/1.121434
-
M. Stark, C. Möller, D. J. Müller, and R. Guckenberger, “From Images to Interactions: High-Resolution Phase Imaging in Tapping-Mode Atomic Force Microscopy,” Biophysical Journal, Vol. 80, No. 6, pp. 3009–3018, Jun. 2001, https://doi.org/10.1016/s0006-3495(01)76266-2
-
A. Gil, J. Colchero, M. Luna, J. Gómez-Herrero, and A. M. Baró, “Adsorption of Water on Solid Surfaces Studied by Scanning Force Microscopy,” Langmuir, Vol. 16, No. 11, pp. 5086–5092, May 2000, https://doi.org/10.1021/la9913304
-
J. Tamayo and R. Garcı́a, “Effects of elastic and inelastic interactions on phase contrast images in tapping-mode scanning force microscopy,” Applied Physics Letters, Vol. 71, No. 16, pp. 2394–2396, Oct. 1997, https://doi.org/10.1063/1.120039
-
J. Tamayo, “Energy dissipation in tapping-mode scanning force microscopy with low quality factors,” Applied Physics Letters, Vol. 75, No. 22, pp. 3569–3571, Nov. 1999, https://doi.org/10.1063/1.125391
-
B. Vasić, A. Matković, and R. Gajić, “Phase imaging and nanoscale energy dissipation of supported graphene using amplitude modulation atomic force microscopy,” Nanotechnology, Vol. 28, No. 46, p. 465708, Nov. 2017, https://doi.org/10.1088/1361-6528/aa8e3b
-
B. V. Derjaguin, V. M. Muller, and Y. P. Toporov, “Effect of contact deformations on the adhesion of particles,” Journal of Colloid and Interface Science, Vol. 53, No. 2, pp. 314–326, Nov. 1975, https://doi.org/10.1016/0021-9797(75)90018-1
-
M. Abbasi, “A simulation of atomic force microscope microcantilever in the tapping mode utilizing couple stress theory,” Micron, Vol. 107, pp. 20–27, Apr. 2018, https://doi.org/10.1016/j.micron.2018.01.008
-
M. Imboden and P. Mohanty, “Dissipation in nanoelectromechanical systems,” Elsevier BV, Physics Reports, Jan. 2014.
About this article

