Abstract
The technological advancements and policy reformations make the electric power distribution system an active network. The modern power system operational regulations encourage coordinated network operations among various entities and customer participation. Unlike traditional operational environments, real-time monitoring has become a mandate for secure and reliable operations. Phasor Measurement Units (PMU) is the most reliable data acquisition tool, and their application for State Estimation (SE) has already been proven. This work extends the application of PMUs for the distribution system. A multi-objective optimization framework is proposed considering the optimal placement of PMU, network reconfiguration, and topology expansion. A novel optimization tool, the sea lion optimizer has been chosen to address the developed optimization problem. The proposed operational model is employed in IEEE RBTS-2 bus system, IEEE 33 node system and 69 node radial distribution network. Numerical results provide new insights into PMUs role in enhancing distribution network operations. The statistical indices confirm that the intended optimizer performs well in the chosen highly constrained optimization environment.
Highlights
- Optimal PMU placements considering network reconfiguration and topology expansion.
- The most realistic PMU placement in DSSE is proposed and the various functional objectives are addressed in a single framework.
- The SLnO is used as a first attempt to solve the proposed PMU problem.
1. Introduction
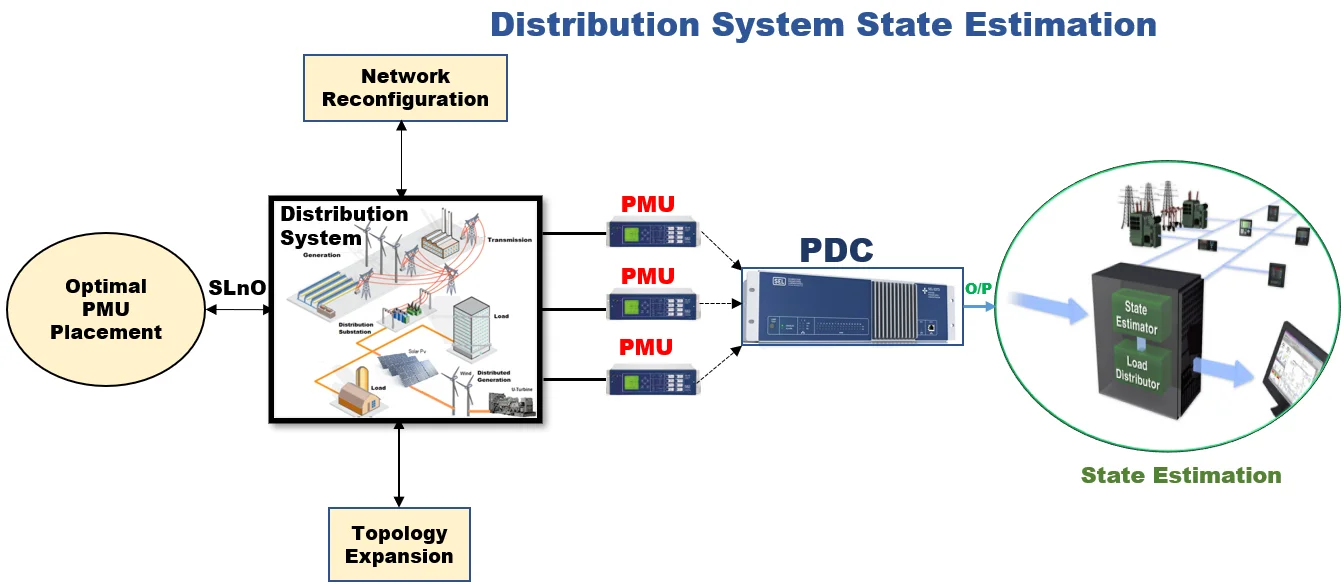
The motive of state estimation in the power system can be an exposure to bad measurement data, reduction in small errors, detection of wrong switch statuses, network parameters estimation, wide-area monitoring, and situational awareness, fault finding, protective relaying, islanding detection, and other several applications [1], [2]. Distribution System State Estimation [DSSE] plays a vital role while implementing the features of smart grids as the inclusion of renewable energy sources, distribution generation, and demand-side management. State estimation based on PMU placements in the distribution system is gradually sprouting. PMU gives configurable alerts to take immediate action. Hence placing PMU in the distribution system will make the total system observable.
1.1. Challenges in DSSE considering adaptability
As technology develops and the population in the world increases, the need for electricity is also increasing. For this reason, expansion in the topology is essential to satisfy the demand. Distribution networks are complex due to the interconnection of renewable energy sources, distribution grid integration, and increasing end-users. To face the expected load increase in the near future, topology expansion in the distribution systems plays a vital role. The purpose of topology extension as in distribution system is to improve the system's performance. Conversely, it has many challenges, including power quality issues like harmonics, frequency and voltage fluctuation, integration of renewable energy sources in the distribution network, electric vehicle, new client demands, operation management under island mode, and voltage stability problems. To overcome these problems, real-time monitoring is mandatory and can be easily achieved by deploying PMU at appropriate nodes in the distribution network.
1.2. State of the art methods
To make the Indian power grid reliable and efficient, moving towards a smart grid is crucial [3], [4]. It can be achieved by installing PMU in the power systems. The Indian power grid’s southern area is taken into account when determining the geographical location of PMU placements in [5]. Conversely, [6] developed a model for controlled islanding mode and normal operating conditions in the Tamilnadu power grid for PMU placement.
The changes of configuration in the distribution system under normal operation and contingency modes have a huge impact on finding the best location of PMUs. Hence [7] suggested a novel elucidation method to identify the best feasible location for PMUs. This method ensures full framework observability in all distribution network activity operation settings by calculating only one configuration. Further, the observability of the network considering topology changes is detailed [8].
On the other hand, a method has been proposed for collecting a minimal number of critical measures with high overall redundancy [9]. To enhance the measurement redundancy in the distribution system, Optimal PMU search space reduction techniques were presented [10], which provided a feasible solution with a reduced number of PMUs. An integer nonlinear programming mechanism was proposed to mitigate the effective PMU location problem, where the measurement redundancy is maximized to measure the redundancy for every bus [11]. In contrast, probabilistic percentage error was proposed to handle the impacts of failure probability and transmitting faulty data, probability in distribution network estimation problem to accomplish preset probabilistic error percentage in magnitude and angle [12]. Modified Greedy Algorithm [13] was used to solve the tri objective optimization problem; however, [14] suggested a technique for assigning metering equipment in electrical distribution systems and strives to provide candidate solutions that represent strong trading between two competing objectives. The Non-Dominated Sorting Genetic Algorithm [15] was also used for solving optimal PMU placement problems. Besides that, the tactic of pre-assigned PMUs enables significantly to reduces the number of possible candidates for PMU placement, allowing consideration to be given to other PMU placements in the power system [16]. A technique for different conditions, namely, normal condition, loss of single PMU, the effect of unequal PMU cost, lack of communication infrastructure, presence of conventional power flow measurements, the effect of channel limitation, and effect of zero injection buses proposed in [17]. The exponential binary particle swarm optimization [18] was implemented to provide multiple solutions for various practical problems like single PMU outages and single line outages. Data traffic was handled in [19] using the Hybrid Algorithm of Genetic Algorithm and Minimum Spanning Tree.
1.3. Research gap and motivation
The summary of the research works in the field of PMU placements is presented in Table 1. The following points are observed from the literature survey. Numerous research works were done on PMU placements in the transmission systems, but a few have been commenced for distribution systems; most of the research articles focused on network reconfiguration for loss minimization; the topology expansion is focused only on the transmission systems. To develop a realistic operational mode, a multi-objective model is developed to ensure highly reliable and complete observable distribution network operations using PMU. This research's main aim is to determine the best PMU site considering network reconfiguration, loss minimization, and topology expansion. To the author’s best knowledge, this realistic model is presented for the first time in the distribution system.
Table 1Consolidated literature survey
Year | Author | Algorithm / Approaches | Objectives | ||
Min OPP | Reconfiguration | Topology expansion in distribution system | |||
2008 | Prasad et al. [21] | Genetic algorithm | + | Research Gap No reports | |
2013 | Gopakumar et al. [5] | Integer linear programming | + | ||
2014 | Abdelsalam et al. [27] | Ant colony optimization | + | ||
2015 | Alvarez et al. [9] | Lower critical measurement with high redundancy | + | ||
2017 | Mabaning et al. [10] | OPP Search space reduction | + | ||
2018 | Zhang et al. [22] | Mixed-integer nonlinear programming | + | ||
2019 | Arefi et al. [12] | Binary particle swarm optimization | + | ||
2019 | Souifi et al. [23] | Genetic algorithm-based graph theory | + | ||
2020 | Chen et al. [11] | Integer linear programming | + | + | |
2020 | Tiwari and Kumar [24] | Hybrid Taguchi and binary particle swarm optimization | + | + | |
2021 | Duque et al. [14] | Modified monkey search | + | + | |
Proposed | Sealion optimization algorithm | + | + | + | |
1.4. Objectives
The objectives of the proposed work are as follows:
1) Optimal PMU placement in the distribution system to make the system observable and keep away from system failures. This can be achieved by placing PMU in nodes.
2) Network reconfiguration will minimize the losses and load balancing in the distribution system.
3) Expansion of the topology will give an idea to expand the topology in real-time in case there is any need for topology extension.
2. Problem formulation
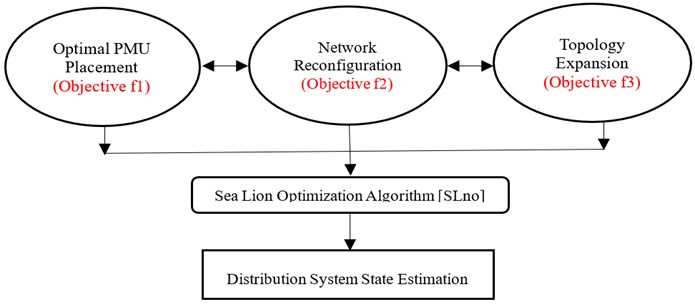
A multi-objective optimization problem is performed to discover the least number of PMUs while minimizing losses. Fig. 1. depicts a diagrammatic illustration of a multi-objective prototype. It’s described as follows:
Fig. 1Multi objective prototypical for PMU placement
2.1. PMU placement in the adaptable distribution system
The OPP’s primary goal is to determine the least number of PMU required for complete system observability [10]. It is stated as follow:
where is the cost for simplicity, the cost is assumed as constant, is binary decision variable of installing PMU at bus (1 to install, 0 otherwise), number of network buses.
The measurements are taken with the system consent to calculate the magnitude of the bus voltage and the angle to each bus of the network, aimed at comprehensive system observability. This indicates each bus in the network should be seen at least once. As a result, various constraints developed cannot be applied to a system with minimum 1 bus observability:
where is the number of PMUs observing bus , is the binary connectivity coefficient between bus and bus
is determined by the PMU’s ability to measure the bus voltage from bus and bus using ohm’s law, presuming that line impedance is specified. Assuming that the line impedance is known.
The set of constraints may also be written in terms of vectors and matrices as:
where is the binary connectivity matrix, is the binary decision variable in installing PMUs, is the minimum bus observability required for each bus.
2.2. Radial distribution network reconfiguration
For a radial topology, minimization of network power losses while meeting operational constraints [21]-[22] can be stated as follows:
where is the resistance of the branch , is the magnitude of the current flowing through the branch , is the total number of branches in the system.
2.3. Topology expansion
Topology expansion in the distribution system for full system observability is achieved using Eq. (10). Subsequently, the topology expansion [28] problem becomes:
Subject to the minimum true value of error (, , ,…, ), where is decision variable that corresponds to the placement of PMU at th bus = 1, if a PMU placed at th bus = 0, otherwise.
2.4. Constraints
– Radial system constraint:
From an operational point of view, the distribution network should be made up of radial structures [27].
– Bus voltage magnitude:
The magnitude and angle of state variables at each node should be within their acceptable limits to sustain power quality:
where is the voltage on bus , and are minimum and maximum bus voltage limits, respectively.
The reasonable minimum voltage is 0.95 volts and also the maximum voltage is 1.05 volts (5 %). The construction process starts with the initial population.
– Current constraints:
Each branch’s current magnitude (feeder, laterals, and switches) must be within its authorized ranges:
where max is maximum current limit of branch .
– Feeder capability limits:
3. DSSE considering network reconfiguration and topology expansion
3.1. Need for optimization algorithm
In 2019 [29], a new bio-inspired algorithm was introduced to solve the optimization problem named Sea lion Optimization algorithm. It is verified that it has superior performance and high convergence compared to the others presented in the literature.
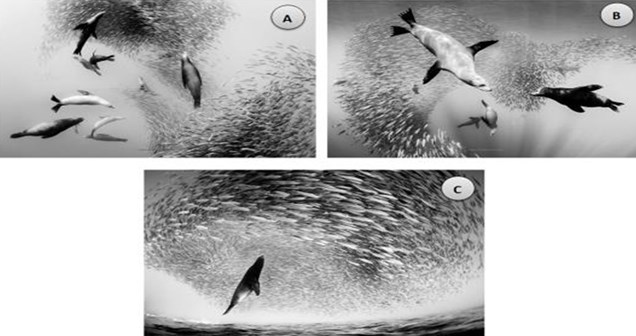
For solving a wide area problem like optimal PMU placement in the distribution system the metaheuristic algorithm named sea lion optimization is used. SLnO is a population-based method used to determine the quality of a solution by applying fitness principles [30]. The proposed methodology proceeds by generating a population of various search agents in this manner. The fitness function of an effective solution based on the largest value is generated for each search agent in order to evaluate them. The best search agent with the fittest individuals among some of the group of feasible solutions is established at that moment, and all associated locations belonging towards the other search agents should be adjusted simultaneously in accordance with this modification. The hunting behaviours of sea lions [29] are shown in Fig. 2.
The main phases of the hunting behaviour of sea lions are as follows:
1) Using their whiskers to track and chase the prey.
2) Asking additional individuals of their subgroup to join them in chasing and surrounding the prey.
3) Make an attack on the prey.
This work mathematically models the sea lion's hunting technique to develop the SLnO algorithm and optimize it.
Fig. 2Hunting behaviour of Sea Lions: a) chasing, approaching, and tracking prey, b) encircling, c) Stationary situation and attack
3.2. Multiobjective optimization based on SLnO considering network reconfiguration and topology expansion
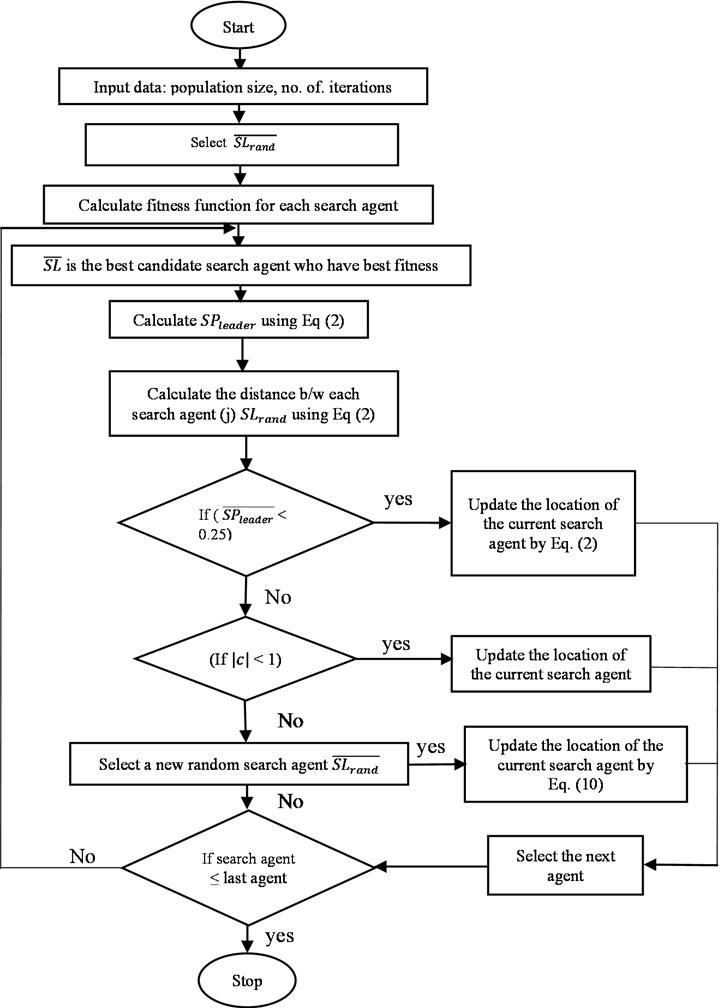
The following is the staging process trying to implement Multiobjective PMU placement and distribution system reconfiguration: The flowchart of multi objective sea lion optimization algorithm in shown in Fig. 3.
Step 1: Read data of the test bus systems.
Step 2: Set the initial value for the SLnO parameter’s population.
Step 3: Make a population of ‘n’ sea lions as a starting point.
Step 4: Develop a multi-objective strategy to reach the objective.
Step 5: Evaluate each search agent’s fitness function.
Step 6: Compare the fitness of each sea lion and update the position of the search agents.
Step 7: Stop when the best solution is met.
Fig. 3Flowchart for multi-objective sea lion optimization algorithm
3.3. Fitness calculation
The supremacy of each potential position is resolved through fitness function practice. As a result, the smooth selection of the fitness value seems to have an effect on the candidate solution recruitment process as well as the actual evaluation phase in recognizing the features of solutions based on their efficiency level. Consequently, in any new trial, each of the search agent’s fitness values must be re-calculated [30]. Therefore, the best search mediator (SL) was picked, and the placements of the other search mediator’s positions should be altered accordingly. Through using its unique vocalization to alert them to the presence of the prey, , sends a vocal communication to other sea lions on the coast or under the ocean by using its particular vocalization to tell them about the prey. As a result, all sea lions who have heard their leader’s vocalization will flock together as one and form a cluster, depending on the value of (), will update their locations toward the position.
4. Optimal PMU placements result and discussion
The details of the test bus system, together with line and bus data, are extracted from [20-27]. All simulations were created using MATLAB, then executed on a personal computer with an Intel Core i3 – 5005U processor running at 2.00 GHz, 8 GB of RAM, and a 64-bit operating system.
The Sea lion algorithm has been used to put the encrypted PMU. It has been tested on many systems, including standard IEEE systems, to authenticate the usefulness of the proposed prototype. In calculating the feasibility of the system formulation, OPP was done for the objectives mentioned above to satisfy the following scenarios.
Scenario 1. PMU placements in DSSE.
Scenario 2. Reconfiguration with PMU placement
Scenario 3. Optimizing PMU with Expansion topology
The following test systems were used for each of the aforementioned scenarios.
Test Case 1: IEEE RBTS-2.
Test Case 2: IEEE 33.
Test Case 3: IEEE 69.
4.1. PMU placements in DSSE
The results showed that the proposed technique could discover the optimum option for complete redundancy in a system. For IEEE RBTS-2, IEEE 33, and IEEE 69 bus distribution systems, this study proposes a simple and effective PMU placement method. The PMU placement in several IEEE test systems is shown in Table 2. From the table, it can be easily understood that the proposed algorithm obtained the optimal locations with a better coverage value. The computational time for the program execution in each test system is obtained as shown in Table 2. Many locations are obtained for each test system with different coverage values. The proposed algorithm chooses the optimal locations based on the high coverage values. For example, in the IEEE RBTS-2 Test System, 9 PMUs are essential to examine the entire system, and the ideal positions are 1, 4, 7, 10, 13, 16, 19, 21, 23. The System Measurement Redundancy Index (SMRI) is sum of the Bus Observability Index (BOI). The BOI for each bus is calculated by using the bus connectivity matrix. The SMRI value for the above places is determined as 24, which is greater than the other locations.
Table 2PMU placements in DSSE with computational time
Test system | No. of PMUs | PMU location | SMRI | Computational time in sec |
IEEE RBTS-2 | 9 | 1, 4, 7, 10, 13, 16, 19, 21, 23 | 24 | 0.060 |
IEEE 33 | 11 | 2, 5, 8, 11, 14, 17, 21, 24, 26, 29, 33 | 34 | 0.082 |
IEEE 69 | 23 | 1, 3, 5, 8, 12, 15, 18, 21, 24, 27, 30, 33, 38, 41, 44, 48, 50, 52, 55, 58, 61, 64, 69 | 81 | 0.164 |
4.2. Reconfiguration with PMU placement
For full framework discernibility, the issue with Optimal PMU Placement was fully resolved on the transmission network. Changing the configuration in normal and emergency modes in a distribution network, on the other hand, has a substantial impact on locating PMUs on the network. Some solutions have been proposed; however, the researchers had to work very hard to calculate the system data in all network configurations. In this study, a novel method for determining the best position for PMUs that ensures entire system observability in all distribution network operation configurations while only calculating one configuration. The condition of sectionalizing switches and tie switches determines the distribution network configuration. Proposed algorithms define the position of these switches and their status under various operating scenarios. If the number of tie switches in the distribution network is , there will be up to 3 configurations. When m is a large number, determining the exact position of PMUs from each configuration but then combining them all into one is impracticable; thus, another solution is required.
Fig. 4Diagram of IEEE RBTS-2 bus distribution system
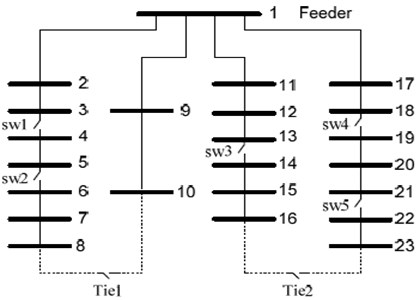
Fig. 4 shows a single-line diagram of the IEEE RBTS-2 bus distribution system. Table 3 illustrates the PMU placement after utilizing the proposed technique on this network, which has 22 load buses, 5 sectionalizing switches, and 2 tie switches. During the configurations, 11 PMUs are required to monitor the entire system, and their locations are 1, 3, 5, 7, 10, 12, 14, 16, 18, 20, 22, respectively. The SMRI is found as 32 and is determined based on the location.
Table 3 shows the numerous different types of reconfigurations. For the experiment, only three combinations are investigated. The outcomes are shown in Tables 3 and 4.
Table 3Placement of PMU on IEEE RBTS-2 bus system
Test system | Parameters | Achieved results |
IEEE RBTS-2 bus system | Number of Tie switch | 2 |
Number of configurations | 9 | |
Number of PMU | 11 | |
PMU location | 1, 3, 5, 7, 10, 12, 14, 16, 18, 20, 22 | |
SMRI | 32 |
Table 4Three configurations of RBTS-2 bus system
Switches | Config. 1 | Config. 2 | Config. 3 |
Switch (S1) | Close | Close | Close |
Switch (S2) | Close | Open | Close |
Switch (S3) | Close | Close | Close |
Switch (S4) | Close | Close | Close |
Switch (S5) | Close | Open | Close |
Tie Switch (T1) | Open | Close | Close |
Tie Switch (T2) | Open | Close | Close |
Comment | Normal operation | Load balancing | Lines 6-7 and 15-16 outage |
The state of the sectionalizing switches and tie switches is cleared, as shown in Table 4. Normal/Base case operating circumstances is the default setup. The second and third configurations are a mix of the first two. Table 5 illustrates the three PMU optimum locations and their accompanying coverage values for the three setups. The final combination of three configurations results in superior placement in all other configuration combinations. 1, 2, 3, 4, 5, 6, 7, 9, 11, 12, 13, 15, 16, 18, 19, 20, 21, 22, 23, 24, 25, 26, 27, 28, 29, 30, 31, 32, 33, 34, 35, 36, 37, 38, 39, 40, 41, 42, 43, 44, 45, 46, 47, 48, 49, 50, If the distribution system may be reconfigured, the PMU at the above location monitors the entire system.
Table 5Placement of PMU for different configurations of IEEE RBTS-2 bus system
Configuration | No of PMU | PMU locations | SMRI |
Base case | 9 | 1, 4, 7, 10, 13, 16, 19, 21, 23 | 24 |
Conf 1 | 8 | 1, 4, 7, 10, 13, 16, 19, 22 | 22 |
Conf 2 | 9 | 2, 5, 6, 10, 12, 15, 18, 21, 22 | 26 |
Conf 3 | 9 | 3, 4, 7, 9, 12, 15, 18, 20, 23 | 26 |
Merging | 19 | 1, 2, 3, 4, 5, 6, 7, 9, 11, 12, 13, 15,16, 18, 19, 20, 21, 22, 23 | 55 |
Table 6Placement of PMU
Parameters | IEEE 33 Bus | IEEE 69 Bus |
Number of Tie switch | 5 | 5 |
Number of Configuration | 243 | 243 |
Number of PMU | 17 | 27 |
PMU location | 1, 2, 3, 5, 7, 8, 9, 11, 13, 14, 17, 21, 24, 25, 26, 29, 33 | 1, 3, 4, 5, 8, 10, 12, 15, 18, 21, 24, 27, 30, 33, 38, 41, 44, 48, 50, 52, 55, 58, 61, 63, 64, 68, 69 |
SMRI | 52 | 92 |
The simulation runs on 33 and 69 bus distribution systems and illustrates the effect of the proposed approach. Table 6 shows the number of tie switches, configurations, and minimum number of PMU required to observe the entire system, as well as their related locations. Tables 7 and 8 show the results of the simulation. On the network, 17 and 27 PMUs are required to ensure the entire system observability. As an outcome of this PMU placement, each bus is covered through at least two separate PMUs, except PMU buses, ensuring reliable entire system observability in all configurations.
Table 7PMU placements with corresponding SMRI
Configuration | No of PMU | PMU locations | SMRI |
Base Case | 11 | 2, 5, 8, 11, 14, 17, 21, 24, 26, 29, 33 | 34 |
Conf 1 | 12 | 1, 3, 5, 7, 9, 11, 14, 17, 21, 25, 26, 29 | 36 |
Conf 2 | 13 | 2, 3, 5, 7, 8, 11, 14, 17, 24, 25, 26, 29, 33 | 39 |
Conf 3 | 13 | 1, 3, 5, 7, 8, 13, 14, 17, 24, 25, 26, 29, 33 | 40 |
Merging | 17 | 1, 2, 3, 5, 7, 8, 9, 11, 13, 14, 17, 21, 24, 25, 26, 29, 33 | 52 |
Table 8Configuration of PMU placements in DSSE
Configuration | No of PMU | PMU locations | SMRI |
Base case | 23 | 1, 3, 5, 8, 12, 15, 18, 21, 24, 27, 30, 33, 38, 41, 44, 48, 50, 52, 55, 58, 61, 64, 69 | 81 |
Conf 1 | 24 | 1, 3, 5, 8, 12, 15, 18, 21, 24, 27, 30, 33, 38, 41, 44, 48, 50, 52, 55, 58, 61, 64, 68, 69 | 84 |
Conf 2 | 25 | 1, 3, 4, 5, 8, 12, 15, 18, 21, 24, 27, 30, 33, 38, 41, 44, 48, 50, 52, 55, 58, 61, 64, 68, 69 | 86 |
Conf 3 | 25 | 1, 3, 5, 8, 10, 12, 15, 18, 21, 24, 27, 30, 33, 38, 41, 44, 48, 50, 52, 55, 58, 61, 64, 68, 69 | 88 |
Merging | 27 | 1, 3, 4, 5, 8, 10, 12, 15, 18, 21, 24, 27, 30, 33, 38, 41, 44, 48, 50, 52, 55, 58, 61, 63, 64, 68, 69 | 92 |
Compared to previous strategies, the reconfiguration techniques discover an optimal solution to the placement problem while also reducing the computational time required to get ideal PMU locations. Even though the number of locations obtained by both methods is comparable, the suggested technique takes much less time (about half) than the existing method.
Table 9Comparison of results with existing methods for IEEE 33 bus system
Method | Switches | Losses |
Initial | 33, 34, 35, 36, 37 | 203.673 |
Proposed method (SLnO) | 7, 9, 14, 32, 37 | 134.80 |
HAS | 7, 10, 14, 28, 36 | 146.39 |
ITS | 7, 9, 14, 36, 37 | 145.11 |
FWA | 7, 9, 14, 28, 32 | 140.98 |
GA | 7, 9, 14, 32, 37 | 140.55 |
RGA | 7, 9,14,32, 37 | 139.55 |
ALO | 7, 9, 14, 32, 37 | 139.54 |
CGA | 7, 9, 14, 32, 37 | 138.87 |
PSO | 7, 9, 14, 32, 37 | 138.87 |
The comparison of findings with existing approaches is shown in Table 9 and 10. It demonstrates that the suggested method has the most negligible losses compared to other strategies. It is possible to conclude that the proposed method is further qualified than the existing approach since it can effectively address the computational burden and long processing time for large-scale distribution systems in practice.
Table 10Comparison of results with existing methods for IEEE 69 bus system
METHOD | SWITCHES | LOSSES |
Initial | 69, 70, 71, 72, 73 | 224.93 |
CSA | 14, 57, 61, 69, 70 | 98.56 |
PSO | 14, 57, 61, 69, 70 | 98.56 |
CGA | 14, 57, 61, 69, 70 | 98.56 |
FWA | 14, 56, 61, 69, 70 | 98.59 |
HAS | 13, 18, 56, 61, 69 | 99.3 |
IAICA | 14, 57, 61, 69, 70 | 98.57 |
Proposed algorithm | 14, 57, 61, 69, 70 | 97.48 |
4.3. Optimizing PMU placement considering topology expansion
One of the most critical aspects of PMU deployment is the topology expansion of a relevant network. This section goes in-depth on extending the topology of different test systems and cramming information into it. In practice, there are still no well-defined topologies. The size, the design of the system, choice of relevant sites, and expense problems must be considered while extending the topology.
Table 11Feasible PMU placements for topology expansion
Test system (Topology extension) | Minimum number of PMUs | Coverage |
IEEE 33 Bus | 2, 5, 8, 11, 14, 17, 21, 24, 26, 29, 33, 35,38,41, 44, 47,50, 54, 57, 59, 62, 66 | 68 |
IEEE 69 Bus | 1, 3, 5, 8, 12, 15, 18, 21, 24, 27, 30, 33, 38, 41, 44, 48, 50, 52, 55, 58, 61, 64, 69, 70, 72, 77, 77, 81, 84, 87, 90, 93, 96, 99, 102, 107, 110, 113, 117, 119, 121, 124, 127, 130, 133, 138 | 162 |
A probabilistic method can be used to generate the notion of topology extension, in which each bus selects a binary number at random (1 or 0) – considering the IEEE 33 and IEEE 69 bus systems in Table 11, where 11 and 23 PMUs are required in normal operation without regard for topology extension to ensure entire network observability. While identical test systems were naturally extended (*2), however, a least between 22 and 46 PMUs are put at the equivalent bus, which would not guarantee complete system observability. Furthermore, the respective PMUs will provide substantial coverage.
5. Performance evaluation of algorithm
5.1. Effect of search mediators
The number of sea lions created in each generation is calculated by sacrificing a more extensive search zone exploration while increasing computing difficulty. Every generation adds more sea lions, increasing the size of the search area and the computing load. The Search Agent (SA) size in the SLnO algorithm must be properly chosen. The SA is a number that varies from 10 to 40. Table 12 illustrates the SA’s selection parameter.
Table 12Statistical measures of SLnO for various test systems considering the total cost
Test system | Search agent | Best | Average | Worst |
IEEE 33 Bus | 10 | 144.5 | 148.25 | 152.3 |
20 | 139.2 | 144.35 | 149.5 | |
30 | 134.8 | 140.575 | 146.35 | |
40 | 136.4 | 142.1 | 147.8 | |
IEEE 69 Bus | 10 | 104.8 | 109.55 | 114.3 |
20 | 102.6 | 107.7 | 112.8 | |
30 | 97.48 | 103.28 | 109.28 | |
40 | 98.9 | 104.7 | 110.5 |
Table 13Statistical measures of SLnO for various test systems considering the total cost
Indices | IEEE 33 Bus | IEEE 69 Bus |
Best | 134.8 | 97.48 |
Worst | 146.35 | 109.28 |
Average | 140.575 | 103.38 |
Standard Deviation | ±4.715 | ±4.817 |
Epsilon | 142 | 108 |
Iter | 30 | 40 |
Sol_Iter | 24 | 36 |
The goal function is not minimized in SA 10 and 20. As a result, the SA is increased to 30, which provides the best results. Only when SA = 30 is used to compare the SA values of 10, 20, 30, and 40, the overall losses are minimized. Finally, 30 SA is chosen as the optimal number. The overall power loss in the IEEE 33 and 69 bus systems is 134.8 and 97.48 kw, respectively, when SA is set to 30.
5.2. Statistical measures
The disparity of objective functions for 40 trials of the algorithm is analyzed to check the validity of the acquired results. The traditional statistical indices such as finest, worse, mean, and difference Between the values calculated for every trial are shown in Table 13. The total losses for all test systems are evidently towards the ideal values. This demonstrates the desired algorithm's consistency in locating the best possible answer, and the intended technique has demonstrated its high success rate. Furthermore, the Iter and Sol Iter values improve SLnO algorithm convergence properties. Fig. 5 represents the characteristic convergence curves of the IEEE 33 and 69 bus system for the different optimization algorithms.
Fig. 5Convergence characteristic curve
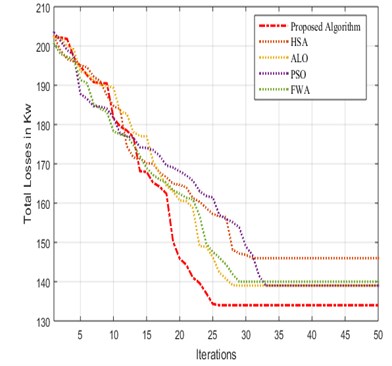
a) IEEE 33 bus system
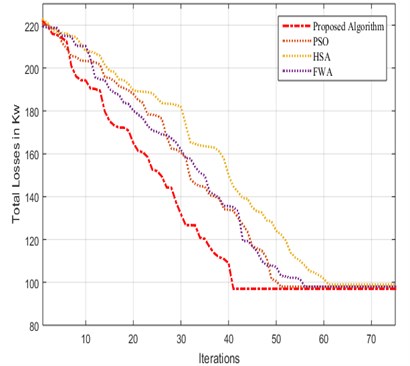
b) IEEE 69 bus system
6. Conclusions
6.1. Contributions
This research proposes a sea lion optimization strategy for tackling an optimal PMU Placement problem that includes network reconfiguration and topology enlargement. The proposed prototype assures that now the system is entirely observed. Losses in the distribution network are decreased by providing network reconfiguration as an optimization objective. The results specify that the location of PMUs changes as the network is reconfigured. PMUs should be placed at nearly all nodes to avoid observability difficulties during network reconfiguration. The IEEE RBTS-2 bus system, IEEE 33, and 69 node feeder results are examples. The results of SLnO are compared to those of prevailing approaches, and the study determines that the suggested methodology is superior and trustworthy. Future research will focus on the resilience power networks.
6.2. Policy implication
The proposed technique minimizes the power losses and gives situational awareness about the status of the distribution network. As a result, it may be utilized in various typical power industry applications, such as decision-making, security, and creating the groundwork for smart grids.
References
-
M. S. Alam and S. A. Arefifar, “Energy management in power distribution systems: review, classification, limitations and challenges,” IEEE Access, Vol. 7, pp. 92979–93001, 2019, https://doi.org/10.1109/access.2019.2927303
-
M. U. Usman and M. O. Faruque, “Applications of synchrophasor technologies in power systems,” Journal of Modern Power Systems and Clean Energy, Vol. 7, No. 2, pp. 211–226, Mar. 2019, https://doi.org/10.1007/s40565-018-0455-8
-
F. Ahmad, A. Rasool, E. Ozsoy, R. Sekar, A. Sabanovic, and M. Elitaş, “Distribution system state estimation-A step towards smart grid,” Renewable and Sustainable Energy Reviews, Vol. 81, No. 2, pp. 2659–2671, Jan. 2018, https://doi.org/10.1016/j.rser.2017.06.071
-
M. Todescato, R. Carli, L. Schenato, and G. Barchi, “Smart grid state estimation with PMUs time synchronization errors,” Energies, Vol. 13, No. 19, p. 5148, Oct. 2020, https://doi.org/10.3390/en13195148
-
P. Gopakumar, G. S. Chandra, M. J. B. Reddy, and D. K. Mohanta, “Optimal placement of PMUs for the smart grid implementation in Indian power grid-A case study,” Frontiers in Energy, Vol. 7, No. 3, pp. 358–372, Sep. 2013, https://doi.org/10.1007/s11708-013-0257-7
-
R. Ramachandran and S. Karthick, “Optimal PMU placement for Tamil Nadu grid under controlled islanding environment,” Procedia Technology, Vol. 21, pp. 240–247, 2015, https://doi.org/10.1016/j.protcy.2015.10.021
-
V.-K. Tran, H.-S. Zhang, and V.-N. Nguyen, “Optimal PMU placement in multi-configuration power distribution networks,” in 2016 4th International Conference on Electrical and Electronics Engineering and Computer Science (ICEEECS 2016), pp. 508–514, 2016, https://doi.org/10.2991/iceeecs-16.2016.104
-
H. Su, C. Wang, P. Li, Z. Liu, L. Yu, and J. Wu, “Optimal placement of phasor measurement unit in distribution networks considering the changes in topology,” Applied Energy, Vol. 250, pp. 313–322, Sep. 2019, https://doi.org/10.1016/j.apenergy.2019.05.054
-
M. J. Alvarez, F. S. Sellschopp, and E. Vazquez, “A PMUs placement methodology based on inverse of connectivity and critical measurements,” International Journal of Electrical Power and Energy Systems, Vol. 68, pp. 336–344, Jun. 2015, https://doi.org/10.1016/j.ijepes.2014.12.055
-
A. A. G. Mabaning, J. R. C. Orillaza, and A. Von Meier, “Optimal PMU placement for distribution networks,” in 2017 IEEE Innovative Smart Grid Technologies – Asia (ISGT-Asia), pp. 1–6, Dec. 2017, https://doi.org/10.1109/isgt-asia.2017.8378415
-
X. Chen, F. Wei, S. Cao, C. B. Soh, and K. J. Tseng, “PMU placement for measurement redundancy distribution considering zero injection bus and contingencies,” IEEE Systems Journal, Vol. 14, No. 4, pp. 5396–5406, Dec. 2020, https://doi.org/10.1109/jsyst.2020.2990435
-
A. Arefi, M.-R. Haghifam, S.-H. Fathi, B. Behi, S. E. Razavi, and P. Jennings, “Optimal probabilistic PMU placement in electric distribution system state estimation,” in 2019 IEEE 10th International Workshop on Applied Measurements for Power Systems (AMPS), pp. 1–6, Sep. 2019, https://doi.org/10.1109/amps.2019.8897793
-
V.-K. Tran and H.-S. Zhang, “Optimal PMU placement using modified greedy algorithm,” Journal of Control, Automation and Electrical Systems, Vol. 29, No. 1, pp. 99–109, Feb. 2018, https://doi.org/10.1007/s40313-017-0347-6
-
F. G. Duque, L. W. de Oliveira, E. J. de Oliveira, and J. C. S. de Souza, “A cost-benefit multiobjective approach for placement of meters in electrical distribution systems,” Electric Power Systems Research, Vol. 191, p. 106897, Feb. 2021, https://doi.org/10.1016/j.epsr.2020.106897
-
R. Andreoni, D. Macii, M. Brunelli, and D. Petri, “Tri-objective optimal PMU placement including accurate state estimation: the case of distribution systems,” IEEE Access, Vol. 9, pp. 62102–62117, 2021, https://doi.org/10.1109/access.2021.3074579
-
N. H. A. Rahman and A. F. Zobaa, “Optimal PMU placement using topology transformation method in power systems,” Journal of Advanced Research, Vol. 7, No. 5, pp. 625–634, Sep. 2016, https://doi.org/10.1016/j.jare.2016.06.003
-
V. Basetti and A. K. Chandel, “Optimal PMU placement for power system observability using Taguchi binary bat algorithm,” Measurement, Vol. 95, pp. 8–20, Jan. 2017, https://doi.org/10.1016/j.measurement.2016.09.031
-
Z. Wu et al., “Optimal PMU placement considering load loss and relaying in distribution networks,” IEEE Access, Vol. 6, No. 2, pp. 33645–33653, 2018, https://doi.org/10.1109/access.2018.2841891
-
M. Meenakshi Devi and M. Geethanjali, “Hybrid of genetic algorithm and minimum spanning tree method for optimal PMU placements,” Measurement, Vol. 154, p. 107476, Mar. 2020, https://doi.org/10.1016/j.measurement.2020.107476
-
M. E. Baran and F. F. Wu, “Network reconfiguration in distribution systems for loss reduction and load balancing,” IEEE Power Engineering Review, Vol. 9, No. 4, pp. 101–102, 1989, https://doi.org/10.1109/mper.1989.4310642
-
P. V. Prasad, S. Sivanagaraju, and N. Sreenivasulu, “Network reconfiguration for load balancing in radial distribution systems using genetic algorithm,” Electric Power Components and Systems, Vol. 36, No. 1, pp. 63–72, Dec. 2007, https://doi.org/10.1080/15325000701473783
-
S. Zhang, H. Cheng, D. Wang, L. Zhang, F. Li, and L. Yao, “Distributed generation planning in active distribution network considering demand side management and network reconfiguration,” Applied Energy, Vol. 228, pp. 1921–1936, Oct. 2018, https://doi.org/10.1016/j.apenergy.2018.07.054
-
H. Souifi, O. Kahouli, and H. Hadj Abdallah, “Multi-objective distribution network reconfiguration optimization problem,” Electrical Engineering, Vol. 101, No. 1, pp. 45–55, Apr. 2019, https://doi.org/10.1007/s00202-019-00755-3
-
S. Tiwari and A. Kumar, “Reconfiguration and optimal micro-phasor unit placement in a distribution system using Taguchi-binary particle swarm optimization,” Arabian Journal for Science and Engineering, Vol. 46, No. 2, pp. 1213–1223, Feb. 2021, https://doi.org/10.1007/s13369-020-04973-x
-
M. Shahriar, I. Habiballah, and H. Hussein, “Optimization of phasor measurement unit (PMU) placement in supervisory control and data acquisition (SCADA)-based power system for better state-estimation performance,” Energies, Vol. 11, No. 3, p. 570, Mar. 2018, https://doi.org/10.3390/en11030570
-
S. Ganesh, V. Vengatesan, J. A. Richard Jimreeves, and B. Ramasubramanian, “Simultaneous network reconfiguration and pmu placement in the radial distribution system,” Advances in Mathematics: Scientific Journal, Vol. 9, No. 10, pp. 8143–8151, Sep. 2020, https://doi.org/10.37418/amsj.9.10.44
-
H. A. Abdelsalam, A. Y. Abdelaziz, and V. Mukherjee, “Optimal PMU placement in a distribution network considering network reconfiguration,” in 2014 International Conference on Circuit, Power and Computing Technologies (ICCPCT), pp. 191–196, Mar. 2014, https://doi.org/10.1109/iccpct.2014.7054997
-
S. Veeramuthu, G. Sivarajan, and S. Srikrishna, “Phasor measuring unit calibration considering topology expansion of electric power utilities,” Journal of Measurements in Engineering, Vol. 8, No. 1, pp. 1–14, Mar. 2020, https://doi.org/10.21595/jme.2020.21193
-
R. Masadeh, B. A., and A. Sharieh, “Sea Lion optimization algorithm,” International Journal of Advanced Computer Science and Applications, Vol. 10, No. 5, pp. 388–395, 2019, https://doi.org/10.14569/ijacsa.2019.0100548
-
El-Omari and Dr. Nidhal Kamel Taha, “Sea Lion optimization algorithm for solving the maximum flow problem,” International Journal of Computer Science and Network Security, Vol. 20, No. 8, pp. 30–68, Aug. 2020, https://doi.org/10.22937/ijcsns.2020.20.08.5
Cited by
About this article

This work is supported by Tamilnadu State Council of Higher Education (TANSCHE) under the Research Grant Project [RGP/2019-20/AMU/HECP-0033]. The work is executed in the Power System Simulation laboratory of Department of Electrical Engineering, Annamalai University using MATLAB version 2020 software. The authors would like to thank the Authorities of Annamalai University for their continued guidance and support while carrying out this research work.
