Abstract
With the air leakage test methods, the leakage tests of the products that are required to be leakproof are carried out. This leakage test starts with placing the product on a fixture. The in-ternal pressure is increased by filling compressed air into the product placed in the Fixture. The product is filled with compressed air up to a previously calculated test pressure value. After the test pressure value is reached for the desired product, the air filling process is completed, and the stabilization period begins. At the end of this period, information about the leakage of the product is obtained, depending on whether there is a change in the internal pressure of the product. In order to fill the product with compressed air, there must be an air hole on the product. Products without this air hole cannot be tested with these methods. With the new method we will develop, it will be possible to test the leakage of closed products without atmosphere-air connection.
1. Introduction
Leakage elements are used at many points both in industry and in everyday life. Depending on the operating conditions, many standard leakage elements can be selected and used according to the appropriate parameters from the catalogs, but leakage elements that need to be produced specifically for special non-standard applications are also widely used. The concept of leakage can basically be defined as preventing and controlling the passage of fluid through the contact area between two media. Whether the working environment is static or dynamic for leakage is examined by different analyzes and the appropriate sealing elements are selected [1].
Air leakage means that the products that are desired to be impermeable keep the air inside the structure with a constant pressure. [2] The life of these products depends on making this stabilization. [3]. The most well-known product can be shown the table tennis ball. The material of these products can be plastic, iron, brass, etc. pipes, vehicle exhausts, bags, pet bottles, balls, hybrid structures. These products are produced with different production methods and the devices that perform their air leakage tests are actively used. There are many different leakage methods used in the industry. In the literature, three different methods have been found to measure the air leakage value. These are fan pressurization, tracer gas and pulse [4]. The fan pressurization method is mostly used to examine the sealing conditions of high-rise structures. Fan pressurization is the most commonly used method in practice to achieve an air leakage value (ALV) [5]. In its simplest form, this method is based on measuring the constant pressure difference (usually 50 Pa) created between the indoor and outdoor environment and the air flow rate passing through the fan with the help of a fan mounted on a portable-adjustable door [6]. The fan pressurization method was first used to determine the leakage of the building shell by using a fan fixed on the window. The same technique was then used to detect and repair air loss-leaks in the building shell with the help of a fan fixed to the door with the help of a fan fixed to the window. For this reason, this method is often known informally as the blower door, or more technically as the fan pressurization method [7], [8].
Leak tests are carried out on glass windows [9], buildings [10], air ducts [11], bellows [12]. The test method to be applied in order to obtain the air leakage value of the volumes with a single thermal zone will be mentioned. In some cases, it may also be necessary to calculate the air leakage value of volumes with multiple thermal zones. There are also widely used approaches for this.
The tracer gas method is a method based on measuring the change over time of a special gas that is filled homogeneously into the volume to be determined by the air leakage value. Some tracer gas leakage test methods include helium mass spectrometry, hydrogen leakage testing and refrigerant gas leakage for cooling applications. As a basic logic, in gas leakage tests, gas impregnation is made to the parts to be tested for leakage. These gases are then detected by means of sensors and leaky products are detected.
The pulse method is based on measuring the instantaneous (1-2 second) pressure and volume change created by the release of previously compressed air using a piston cylinder assembly [5].
Table tennis ball is one of the products that must be absolutely leakage. Air leakage of this product causes many problems. In particular, aerodynamic factors must be at a good level [2], [3]. A damaged and leakage ball cannot achieve this. This is done both mechanically and software. [13]–[16].
In the product test with the classical air leakager method, the products have parts that are open to the atmosphere and compressed air is supplied from these places, then the air supply is stopped, the change value in the compressed air in the product to be tested is checked with the sensor after stopping. If this value is more than the critical value, it is decided that the product does not meet the desired conditions. It is not possible to test products that do not have an openness to the atmosphere, in other words, cannot be filled with air with this classical method. The method we will develop will overcome this situation.
In this article, it is the realization of air leakage tests of products that cannot be tested by the classical air leakage method. With this system we have developed, it is possible to test the products that cannot be tested for leakage by standard methods in the industry by air leakage method.
2. Materials and methods
Leakage tests are the tests that are subjected to after the production of products that do not want to be leakage. Air leakage tests include air leakage tests of manufactured products. These tests are based on monitoring the pressure change as a result of air inflation of the products to be tested. The product planned to be tested is filled with air with a pressure that will not deform the product. This filling process continues until the formation of a certain pressure. Then the pressure change is monitored for the time considered as the stabilization time. If a certain pressure change is not visible in the product, the product is said to be intact. This test can be carried out in the test of products that have a hole in which air will be filled. The air is filled through this hole. After the filling process is finished, the airway is closed and the air pressure value of the product inside is examined. While there is no serious pressure change in robust products, a serious pressure drop is detected in faulty products. In this way, the defective and error-free product is extracted.
Basic scientific approaches are examined as the first stage of system design. Although many theories shed light on our work on this subject, 2 basic laws have been discussed. Boyle and Mariotte's gas law and the Ideal Gas Equations were used in the development of the study:
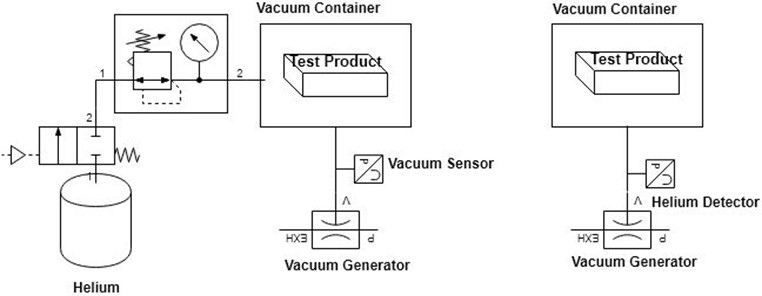
When the tracer gas methods are examined, vacuum is applied to the volume of the product to be tested first to perform a leakage test of products that do not have an openness to the atmosphere. This vacuum also affects the product in volume. The scheme of the measurement system we have developed is given in Fig. 1.
Fig. 1Vacuum method pneumatic scheme
In the method we are developing, hydrogen, helium gas or any other gas is not used as shown in Fig. 2. In the operation, 2 areas with identical volume were created in 2 containers. These two identical volumes are connected to each other by means of a valve. One of the identical volumes is filled with gas at a certain pressure. The ideal gas law is referenced here.
Fig. 2Connection diagram between containers
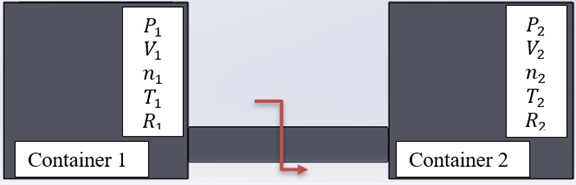
Container 1: There is pressurized air in this container.
Container 2: This container contains atmospheric pressure.
The sealed valve located between container 1 and container 2 allows the air in container 1 to be transferred to container 2.
Under these conditions, a constant pressure is created in container 1. When the valve between the two containers is opened, the number of moles is constant, since there is no gas addition to the medium. Likewise the temperature can be considered equal for the first and last state. If we express this situation with the formula:
If one of the two identical container is filled with compressed air and the valve in between is opened, the final pressure will become:
After all, if the test product that has a volume nearly the container volume is put into container 2 and the valve in between is open, pressure will be more than and near to .
If the faulty product that have a hole, put into the container 2 and then the valve in between is opened, will be almost . In this way, the air leakage controls of the products will be provided.
3. Air leakage test system design
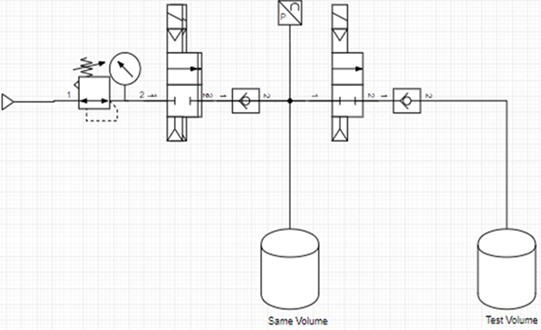
System operation: The pressure of the air coming into the device is reduced between 500-750 mbar with the regulator. Compressed air follows the main air inlet line to the air leak less valve I. If the air leak less valve I, the air fills to the same volume. We have a pressure sensor on this airline. We read the pressure value of the same volume. Then the air leak less valve II is opened, and compressed air is filled into the test volume. After the test volume is filled with air, a pressure reading is performed by waiting for a certain period of time. The decision is made by comparing the data obtained from this pressure reading process with the results from previous tests.
If we open the connection between the same volume and the test volume directly, the pressure value of the same volume drops to half. When we put a faulty pinp pong ball in the test volume, the pressure value drops to about half of the same volume pressure value. Because air fills into the ping pong ball.
If a solid ping pong ball is placed in the test volume, the pressure value read in the same volume will not decrease to half the value since air cannot be filled into the ping pong ball. In this way, faulty and faultless ping pong balls will be sorted out.
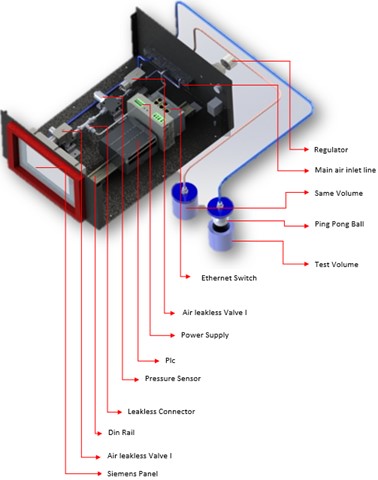
The design of the system was carried out through Solidworks software. The system main body is st37 sheet metal. Sheet metal is styled by metal bending. System view is pre-sented in Fig. 3.
Programmable logic controller (PLC) is a microcomputer system that processes the in-formation it receives from the sensors according to the program given to it and transfers the results to the work elements. It has been developed to eliminate the troublesome parts of the controls made with relay cards. Over time, its properties have been improved and made available in industrial control areas for purposes such as sequential control, motion control (linear and rotary motion control), process control (temperature, pressure, humidity, speed), data management (data collection, monitoring and reporting about machinery or process).
Fig. 3Control unit components
PLC is a special computer used to control operators such as manufacturing lines or machines in factories. It has a microprocessor inside and can be used to program complex systems. The main difference from personal computers (PC) is that the signal inputs and outputs are worked and processed. Unlike general-use computers, PLCs are ar-ranged to have many inputs and outputs and are designed to be more resistant to electrical noises, temperature differences, mechanical shocks, and vibrations. Programs suitable for the operation of the system to be inspected are installed on PLCs. PLC programs scan the input information rapidly in milliseconds and work in a way that responds to the appropriate output information in close to real time. [2]. Automatic control systems provide various advantages to enterprises in terms of speed, security, flexibility of use, product quality and number of personnel. Today, the most effective system that provides these advantages is PLC or PC based control systems. An electronic system that works numerically in PLC inspection is provided in industrial environmental conditions. This electronic system controls many types of machines or processes thanks to digital or analogue input/output modules.
Fig. 4Pneumatic scheme of the system
Although the cost of microprocessors is lower, the reason why PLCs are preferred is; minimizes the time to be spent on electronic design. At the same time, they are ready-made solutions that can work without being affected by the difficult conditions (magnetic field, large temperature differences, dust, etc.) that industrial environments have.
There are PLCs with enough Input/Output numbers to load all the automation jobs of a factory. When necessary, additional input-output modules, RS232, RS485, modem, ethernet communication modules can be added to the PLCs developed today in modular structure. With such features, the existing structure can be improved. In addition, many models have ready-made ON-OFF, PID, Fuzzy etc. controllers for process control as standard.
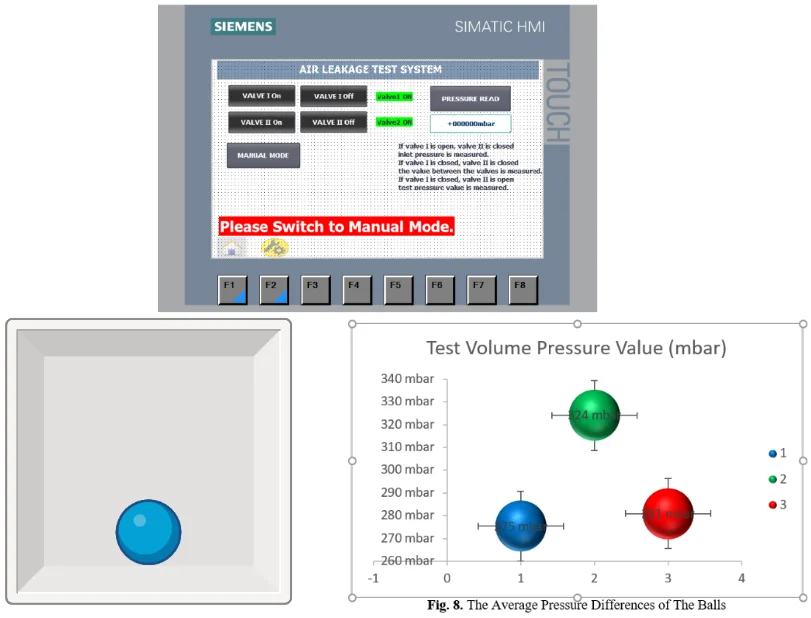
Fig. 5Siemens KTP700 basic panel
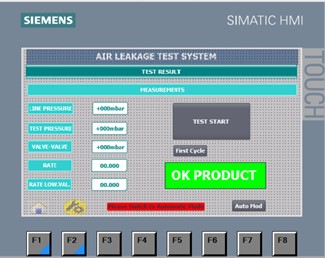
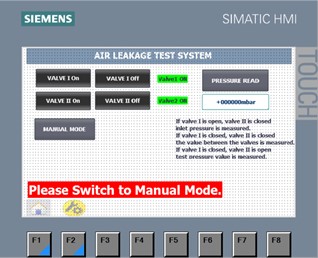
Siemens KTP700 panel used shown in Fig. 5. A simple interface has been created in the system to ensure test operations. Depending on the PLC used for the Controller Software, the Siemens TiaPortal software was used. Panel Software is made with Siemens TiaPortal software because Siemens KTP700 is used.
4. Experimental
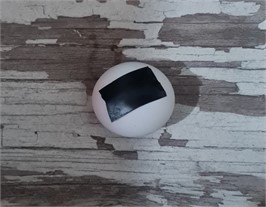
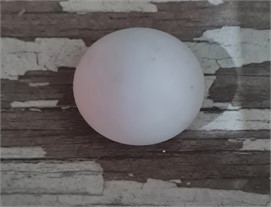
Two ping-pong balls were used in the system experiment. One of the ping-pong balls was pierced with a needle to obtain a faulty ping-pong ball. There is no hole in the other ping-pong ball. This ping-pong ball will be expressed as intact.
Fig. 6Faulty ping-pong ball and intact ping-pong ball
A plastic, capped, cylindrical volume was used as the test volume in which the ping-pong ball will be placed for the test.
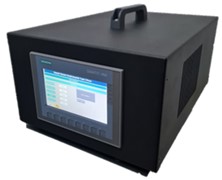
Fig. 7Test equipment development (The device was manufactured by İbrahim Temiz in his own company. The pressure vessel was formed by the metal sheet bending method and the touch screen was placed on the front of the box)
5. Results
The data obtained as a result of the experiment are given in this section. By operating the device without the product to be tested in the system, the formation of equal volumes was checked.
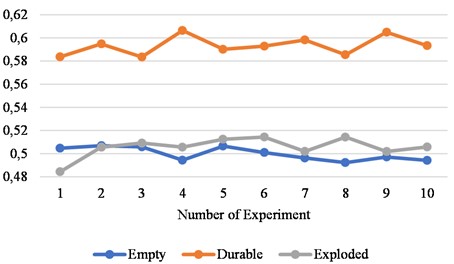
In the experimental application, 10 measurements were made with the device. The value received without opening the valve between the same volumes and the values taken after the valve opening were proportional. In the experimental operation, data on the intact ball were first collected. Experiments on the system were repeated 9 times. Then the data for faulty ball and intact ball were obtained by 9 repeated experiments.
The average of the differences between the initial pressure and final pressure values of the balls is given as follows.
The results obtained were evaluated by non-parametic test. The data obtained show that the average of the pressure differences between the reference value and the intact ball was found to be significantly different. Reference – Intact ball data based on Mann Whitney U test results.
The U-value is 0. The critical value of U at 0.01 is 19. Therefore, the result is significant at 0.01. The z-score is 3.74185. The p-value is 0.00009. The result is significant at 0.01.
When the results of the Mann Whitney U test are examined, the relationship between the burst ball values and the reference values: The U-value is 149. The critical value of U at 0.01 is 92. Therefore, the result is not significant at 0.01. The z-score is 0.89168. The -value is 0.37346. The result is not significant at 0.01.
The results of the statistical analysis show that the data between the bowl and the exploded ball are close to each other. Intact ball measurement results differ from these results and show that there is a significant value difference.
Fig. 8The average pressure differences of the balls
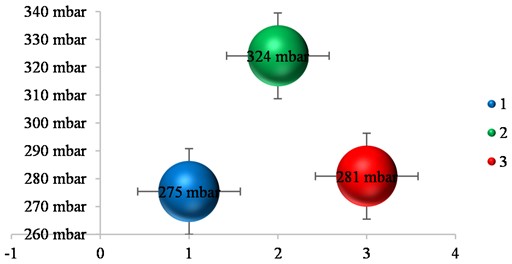
Fig. 9Results of the repeated test
6. Conclusions
After the measurements made with the device, the pressure drop is up to two empty volumes by placing the faulty ping-pong ball in the volume, while this pressure drop is less when the intact product is placed.
Considering all these situations, the air leakage test of products that do not have an openness to the atmosphere has been successfully carried out with the developed device.
References
-
C. Beyçayırı and Z. Parlar, “Analysis of the gasket geometry for sealing glass lamination autoclaves,” Emerging Materials Research, Vol. 10, No. 3, pp. 289–294, Sep. 2021, https://doi.org/10.1680/jemmr.20.00271
-
J. Nonomura, A. Nakashima, and Y. Hayakawa, “Analysis of effects of rebounds and aerodynamics for trajectory of table tennis ball,” in Proceedings of SICE Annual Conference, pp. 1567–1572, 2010.
-
A. Nakashima, K. Takayanagi, and Y. Hayakawa, “A learning method for returning ball in robotic table tennis,” in 2014 International Conference on Multisensor Fusion and Information Integration for Intelligent Systems (MFI), pp. 1–6, Sep. 2014, https://doi.org/10.1109/mfi.2014.6997710
-
M. Mattsson, S. Lindström, E. Linden, and M. Sandberg, “Methods to identify air leakages in the building envelope of churches,” in Conference on Energy Efficiency in Historic Buildings, 2011.
-
E. Cooper, D. Etheridge, M. Mattsson, and H. Wigö, “Pressure pulse technique – a new method for measuring the leakage of the building envelope of churches,” in Conference on Energy Efficiency in Historic Buildings, 9-11 February 2011, Visby, Sweden, Nov. 2012.
-
M. B. Door, “Operation manual for model 3 and model 4 systems,” The Energy Conservatory, 2012.
-
M. H. Sherman and W. R. Chan, Building Ventilation. Routledge, 2006, pp. 155–180, https://doi.org/10.4324/9781849770620-7
-
C. D. Şahin, Z. Durmuş Arsan, and G. G. Akkurt, “İzmir’de bulunan bir konutta ölçülen hava sizdirmazlik değerinin yillik isitma amaçli enerji tüketimi üzerine etkisinin incelenmesi,” in Ulusal Tesisat Mühendisliği Kongresi, 2015.
-
Erdem Cüce, “Hava sızdırmazlığının konvansiyonel pencerelerin ortalama ısıl yalıtım performansındaki rolü,” Dicle Üniversitesi Mühendislik Fakültesi Mühendislik Dergisi, Vol. 8, No. 1, pp. 159–174, Mar. 2017.
-
A. Boylu, “Hastanelerde Iç Hava Kalitesi; Çağdaş Teknoloji ve Türkiye’de Görünüm,” 2015.
-
Erol Türkoğlu and Ahmet Özsoy, “Farklı dikdörtgen hava kanallarındaki sızıntının deneysel incelenmesi,” Türk Bilim ve Mühendislik Dergisi, Vol. 2, No. 2, pp. 57–63, Dec. 2020.
-
E. Turna, F. Kafkas, U. Şeker, and H. S. Yücesu, “Kauçuk hava süspansiyon körüklerinin üretim yöntemi ve yorulma ömrünün ürün kalitesi üzerine etkisinin belirlenmesi,” Journal of Polytechnic, Vol. 21, No. 4, pp. 759–764, Sep. 2018, https://doi.org/10.2339/politeknik.457954
-
H. Su, Z. Fang, Xu, and M. Tan, “Trajectory prediction of spinning ball based on fuzzy filtering and local modeling for robotic ping-pong player,” IEEE Transactions on Instrumentation and Measurement, Vol. 62, No. 11, pp. 2890–2900, Nov. 2013, https://doi.org/10.1109/tim.2013.2263672
-
Z. Zhang, Xu, and M. Tan, “Visual measurement and prediction of ball trajectory for table tennis robot,” IEEE Transactions on Instrumentation and Measurement, Vol. 59, No. 12, pp. 3195–3205, Dec. 2010, https://doi.org/10.1109/tim.2010.2047128
-
Z. Wang, Y. Zhao, and C. Bian, “The analysis of tennis recognition model for human health based on computer vision and particle swarm optimization algorithm,” International Journal of System Assurance Engineering and Management, Vol. 13, No. S3, pp. 1228–1241, Dec. 2022, https://doi.org/10.1007/s13198-022-01673-7
-
Y. Inaba, S. Tamaki, H. Ikebukuro, K. Yamada, H. Ozaki, and K. Yoshida, “Effect of changing table tennis ball material from celluloid to plastic on the post-collision ball trajectory,” Journal of Human Kinetics, Vol. 55, No. 1, pp. 29–38, Jan. 2017, https://doi.org/10.1515/hukin-2017-0004
About this article

The authors have not disclosed any funding.
The datasets generated during and/or analyzed during the current study are available from the corresponding author on reasonable request.
İbrahim Temiz – data curation, funding acquisition, investigation, resources, software, validation. Ahmet Feyzioğlu – conceptualization, formal analysis, project administration. Mehmet Fatih Çelebi – visualization, writing-review and editing. Sezgin Ersoy – methodology, supervision, writing – original draft preparation.
The authors declare that they have no conflict of interest.
